Hello, I am working on D3 bar graph. I get the basic concepts, but the issue I am running in to is that my bars go to the bottom of my div and do not stop at the padding or the axis. What kind of setting would I adjust to get this action to change?
I have attached a picture of what I am dealing with. I have tried altering the yScale.range as well as the transform attribute for my axis to no avail.
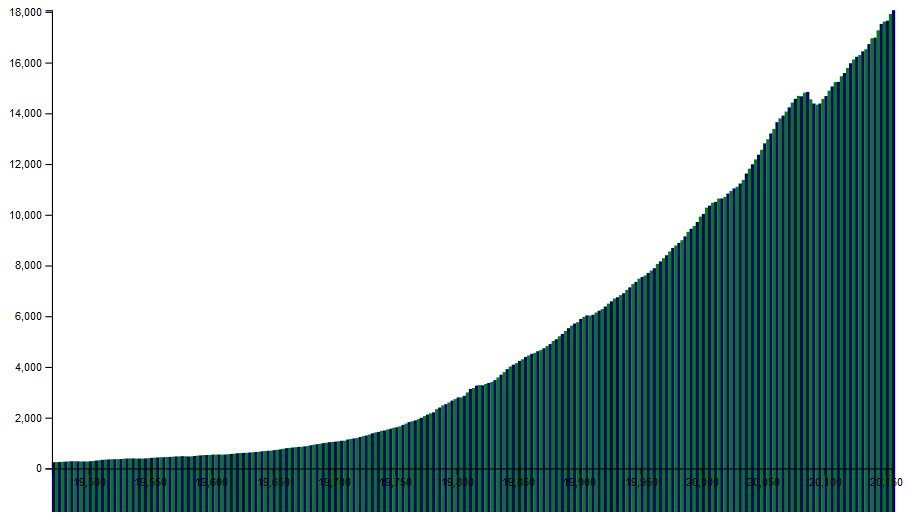
Update: My graph now lines up. For some unexplained reason the graph looked like a weird Rorschach shape with the x axis at the center. I think the problem is in my yScale but I cannot tell.
I have fixed the issue by doing this:
.attr(“height”, (d) => d[1] / 47.75)
but why on Earth is dividing by 47.75 fixing my lines?
I have updated my code.
@camperextraordinaire, thank you so much for responding. Most of my code is in the JS.
window.onload = function () {

    let json = {};

    const lightBlue = '#59a5d8';
    const mainBlue = '#2c5aa0';
    const tan = '#a9927d';
    const grey = '#e3dbdb';
    const black = '#0a0908';

    req = new XMLHttpRequest();
    req.open("GET", 'https://raw.githubusercontent.com/freeCodeCamp/ProjectReferenceData/master/GDP-data.json', true);
    req.send();
    req.onload = function () {
        json = JSON.parse(req.responseText);
        const dataset = json.data;

        dataset.forEach(function (element) {
            element[0] = element[0].split('-').join('');
            let sum = '';
            let sum2 = 0;
            sum += element[0].slice(0, 4);
            sum2 += Number(element[0].slice(4, 6)) - Number(element[0].slice(6, 8));
            switch (sum2) {
                case 0:
                    sum2 = ' Q1';
                    break;
                case 3:
                    sum2 = ' Q2';
                    break;
                case 6:
                    sum2 = ' Q3';
                    break;
                case 9:
                    sum2 = ' Q4';
                    break;
            }
            element[0] = sum + sum2;
        });

        const w = 850;
        const h = 500;
        const barWidth = 3
        const padding = 40;

        const anchor = d3.select('#graph')
            .append('svg')
            .attr('id', 'svg')
            .attr('width', w)
            .attr('height', h);

        const xScale = d3.scaleLinear()
            .domain([d3.min(dataset, (d) => Number(d[0].slice(0, 4))), d3.max(dataset, (d) => Number(d[0].slice(0, 4))+.75)])
            .range([padding, w - padding]);

        const yScale = d3.scaleLinear()
            .domain([0, d3.max(dataset, (d) => d[1])+2000])
            .range([h - padding, padding]);

        const xAxis = d3.axisBottom(xScale)
            .tickFormat(d3.format("d"));

        const yAxis = d3.axisLeft(yScale);

        anchor.selectAll('rect')
            .data(dataset)
            .enter()
            .append("rect")
            .attr("x", (d) => xScale(Number(d[0].slice(0, 4)) + Number((d[0].slice(6, 7) - 1) * .25)))
            .attr("y", (d) => yScale(d[1]))
            .attr("width", barWidth)
            .attr("height", (d) => d[1] / 47.75) */What??/*
            .attr('fill', function (d, i) {
                switch (String(d[0].slice(5))) {
                    case 'Q1':
                        return black
                        break;
                    case 'Q2':
                        return 'grey'
                        break;
                    case 'Q3':
                        return black
                        break;
                    case 'Q4':
                        return 'grey'
                        break;
                }
            })
            .attr('class', 'bar')
            .append('title')
            .text((d) => 'Date: ' + d[0].substring(0, 4) + ' ' + d[0].substring(5) + ', GDP: ' + d[1])


        anchor.append("g")
            .attr("transform", "translate(" + (0) + "," + (h - padding) + ")")
            .call(xAxis)

        anchor.append('g')
            .attr("transform", "translate(" + (padding) + ", " + (0) + ")")
            .call(yAxis);

    };

}
Added my CSS incase that was the issue:
#graph-div{
    display: flex;
    justify-content: center;
    align-content: center;
    width: 900px;

}

#graph{
    background: var(--light-blue);
    display: flex;
    width: 100%;
    align-items: center;
    justify-content: center;
}

#svg{

}

.bar:hover{
    fill: var(--tan)
}