Tell us what’s happening:
Unable to Pass these Test Cases didn’t understand why.
9. Each bar element’s height should accurately represent the data’s corresponding GDP
10. The data-date attribute and its corresponding bar element should align with the corresponding value on the x-axis.
11. The data-gdp attribute and its corresponding bar element should align with the corresponding value on the y-axis.
Could you put your code somewhere we could view/run/edit it (like codepen or jsfiddle or something)?
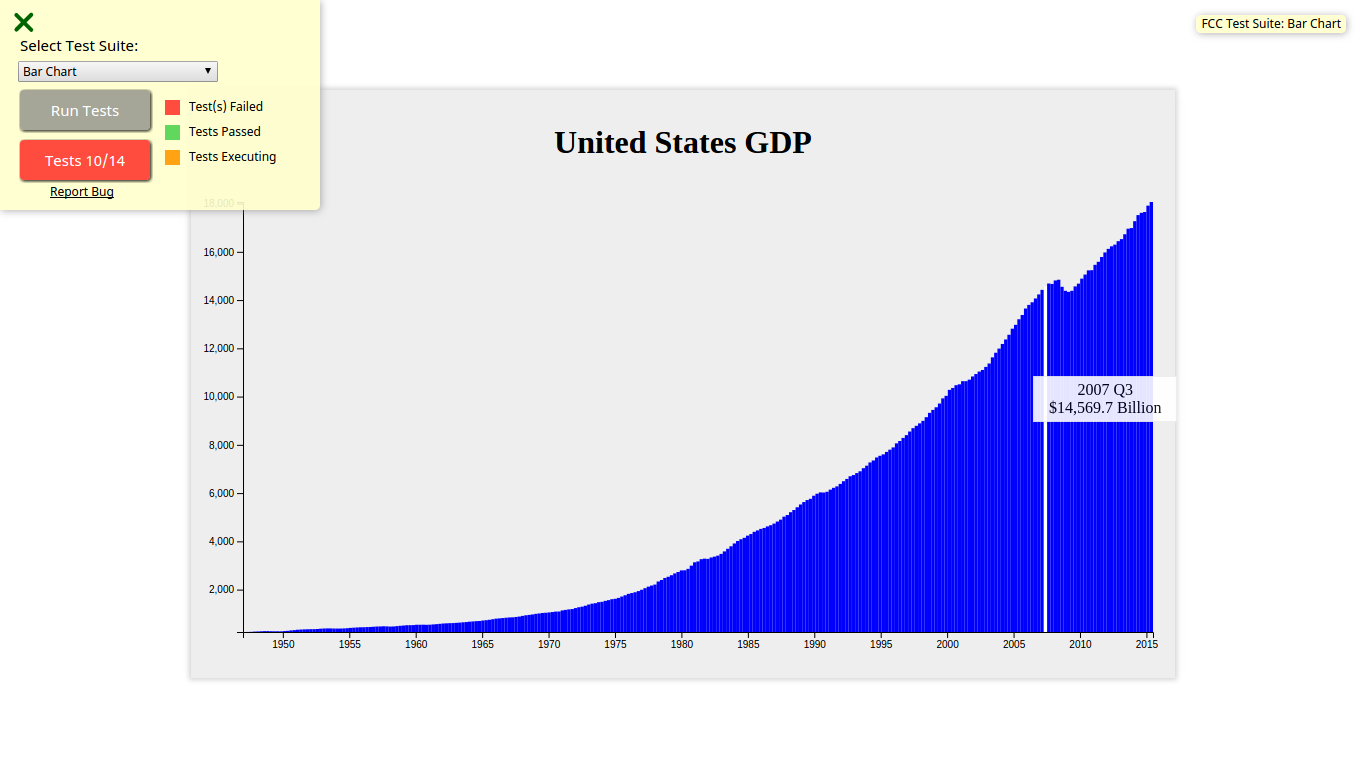
One obvious error is the gap in the graph-- either you are laying out the dates with a gap or there was a year the US had $0 GDP (the economy was bad 10-11 years ago, but not THAT bad)
Yes! I was debugging the same issue and I believe the idea is that unlike the x-axis, the y-axis domain should not be scaled using d3.min() from the dataset because you want the vertical axis to start from $0. If you use the min GDP value as the low domain for the graph, it will look like the GDP was 0 in 1947 like in the graph above. Cheers!