
Mapping is hard, but spinning up a new app that renders maps doesn’t have to be. Here’s how you can easily get started working with maps in a new React app.
Not that AAA map under your car seat
Maps have been around for thousands of years, but they’ve become more complex and powerful within the last couple decades simply due to the fact that computers exist. This has enabled the creation of products we use every day - like Google Maps that help us get home from work and avoid traffic, or weather maps that allow us to check real time radar images. Taking that a step further, scientists use maps every day using data from satellite imagery to try to get a better understanding of our humble planet.
This sounds hard…
Building maps
Plot twist, it’s not hard!

At least it’s not hard to get started. Thankfully, the parts that are the hardest are already built into libraries that can easily be tapped into with JavaScript.
Enter Leaflet…
Mapping Libraries
There are a few libraries in the mapping space right now (like OpenLayers), but we like Leaflet.
To get started with Leaflet, first include the library’s assets on your page. Next, mount the application onto a root element within the DOM with some basic settings. You can kind of think of it like how React mounts to a DOM node, but Leaflet itself doesn’t use React. Once initialized, Leaflet allows you to start utilizing it’s API to project a basemap, add layers, tiles on those layers, and even start to draw on it.
Basemap? Layers? Tiles?
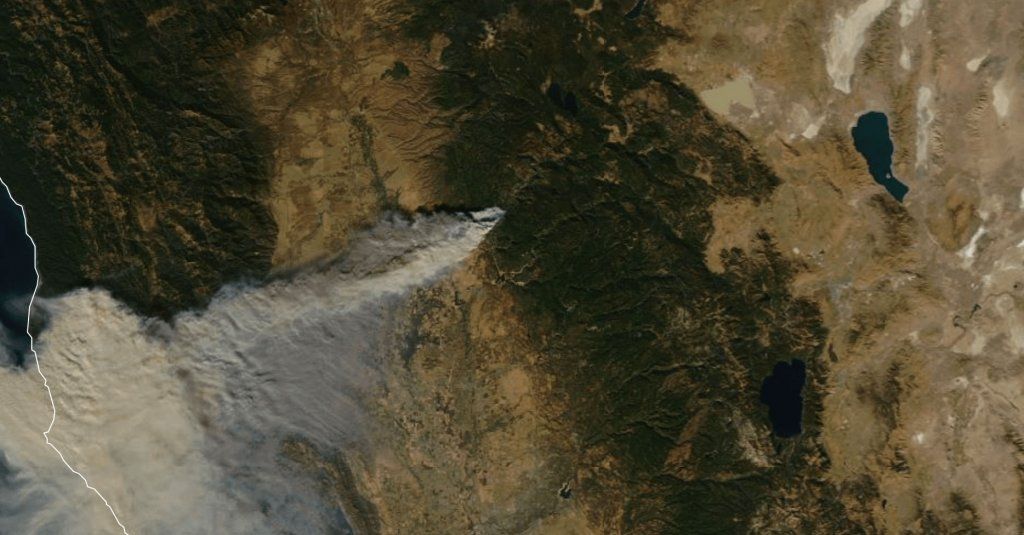
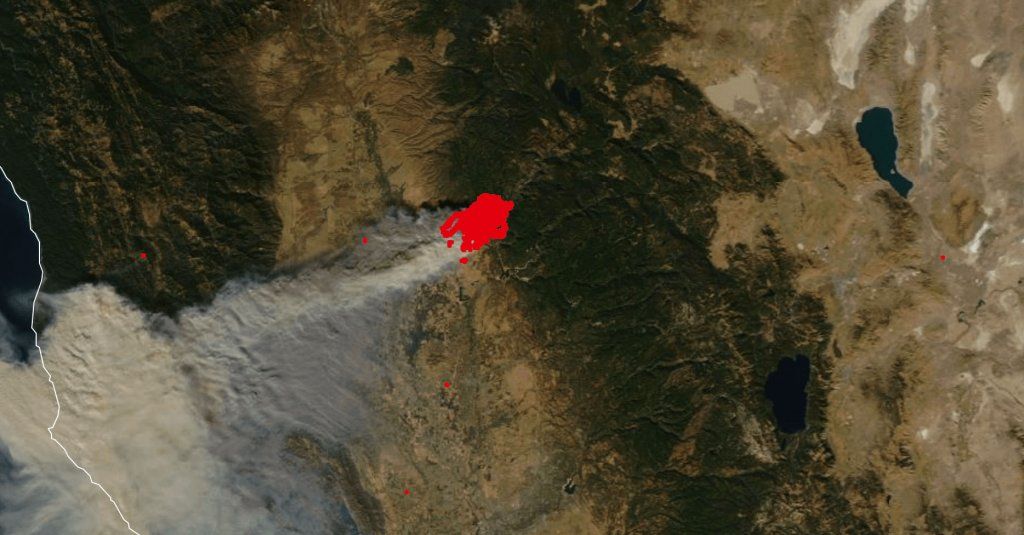
To get the basic gist, think of a cake. Traditionally, cakes have different layers, some on the bottom, some on the top, some might just cover one side with icing. Your map layers function similarly. The bottom layer, which is your foundation, will be your “basemap”. Below, we’re seeing a snapshot of the 2018 California Camp Fire wildfires on top of NASA’s MODIS Aqua satellite imagery.
Now, to get a basemap, we need the imagery to produce it, which is where tiles come in. A tile is a single image block that makes up your group of tiles that represent your layer.
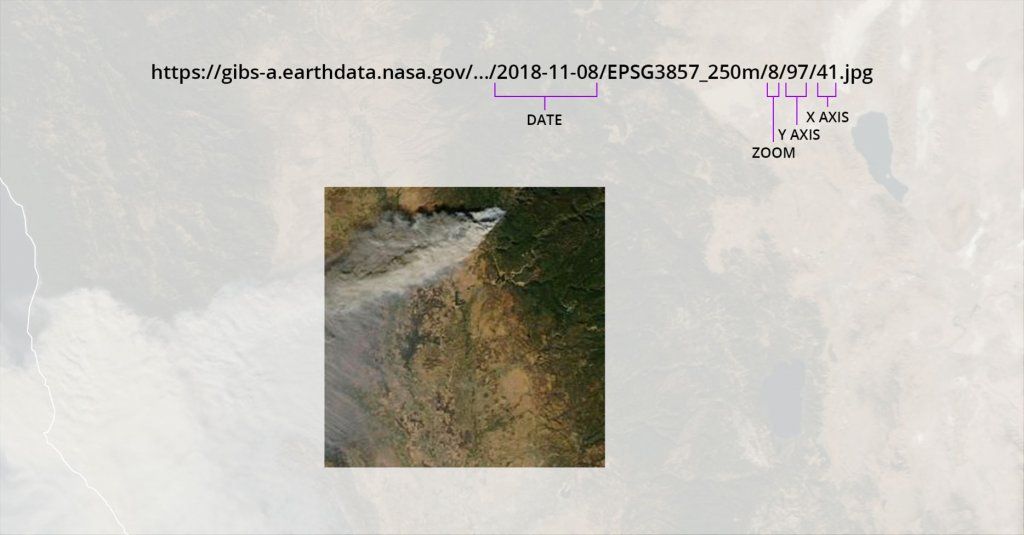
Your tiles are really just a simple image, but alongside the rest, coordinated by geographic positions and zoom levels, make up what you see when you’re looking at a web map like the basemap shown above. The goal of including these smaller individual pieces rather than 1 huge image is that between dealing with the entire globe, the different zoom levels available, and the resolutions available beyond that, we’re talking about gigabytes upon gigabytes of image assets that just wouldn’t be reliable or realistic to serve as a whole.
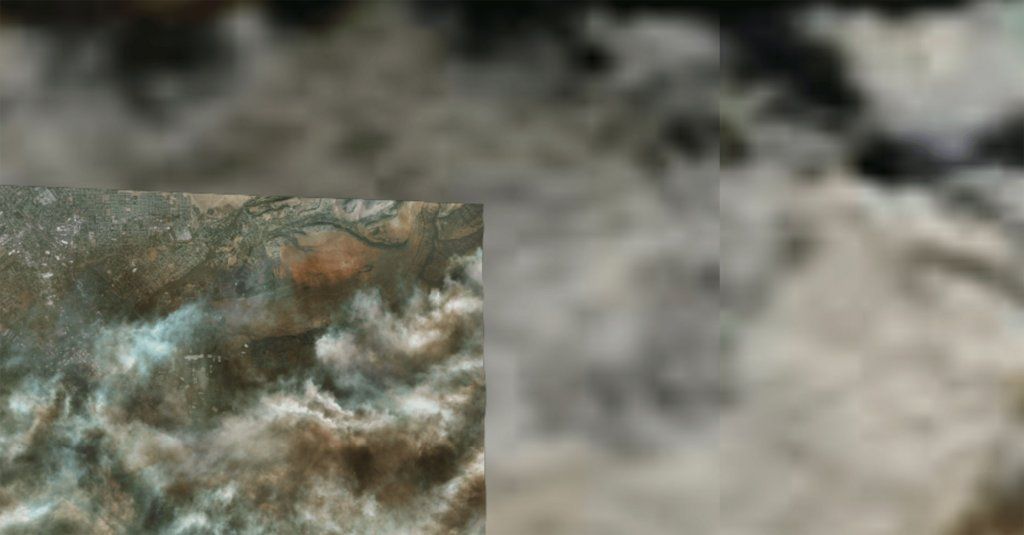
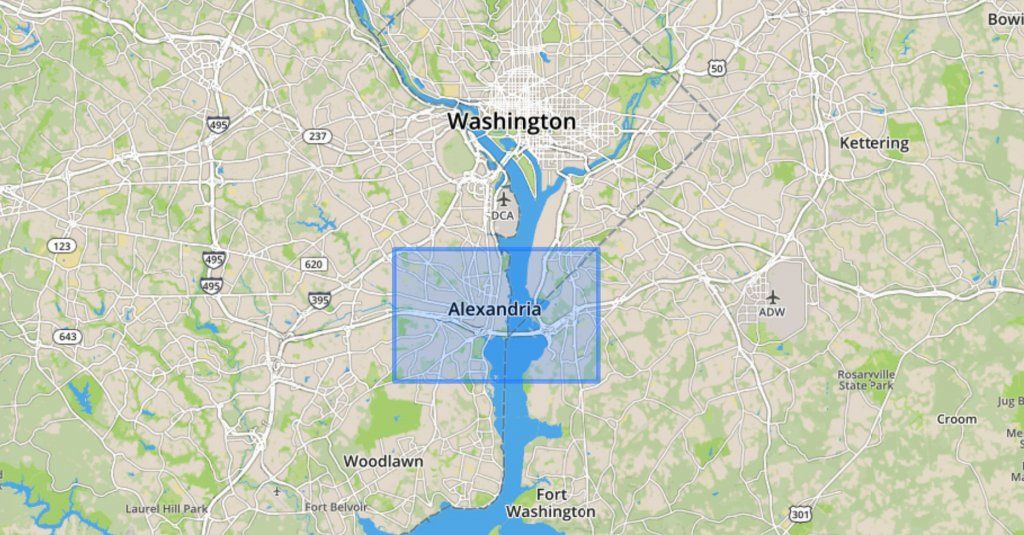
Once you’ve established your basemap, you can then overlay additional layers using more imagery, vector tiles, or datapoints that get transformed to layers. In the screenshot below, we’re zoomed in beyond the highest resolution of our basemap. Notice though the imagery on the left, is an individual overlay tile from Digital Globe that provides us with a higher resolution of part of the area surrounding the fire zone.
Another example on top of that is adding points representing fires collected from NASA’s VIIRS imagery.
This allows us to have the context of the basemap as well as being able to cast any type of data we’d like to better understand its effects.
In addition to the VIIRS data, there are many sources of imagery, vector tiles, and datasets published by governments and municipalities that you can use to help build interesting maps and data visualizations. NASA is one good source of these types of assets, but many commercial providers release open access to disaster datasets that help others build solutions around relief efforts.
What’s this about drawing stuff?
Usually when people use maps, they want to look at points of interest. Drawing gives us the ability to frame those areas of interest with different drawing tools such as creating a rectangle using a bounding box tool or drawing a circle. These are simple shapes, but those shapes represent a geographic space that can then be used to gather data about that area.
React ❤️ Leaflet
Leaflet in itself gives you a lot to work with, but there’s still a lot of manual effort that goes along with it. If you’re used to building a React app, you’re probably not as used to building an entire UI using nothing but APIs based on the browser’s window, and this is where React Leaflet shines.
React Leaflet is a React library that takes the map building and bundles it into intuitive components that represents those parts of the map. Consider the above, where we talked about your basemap and layers to along with it, you might see it looking something along the lines of:
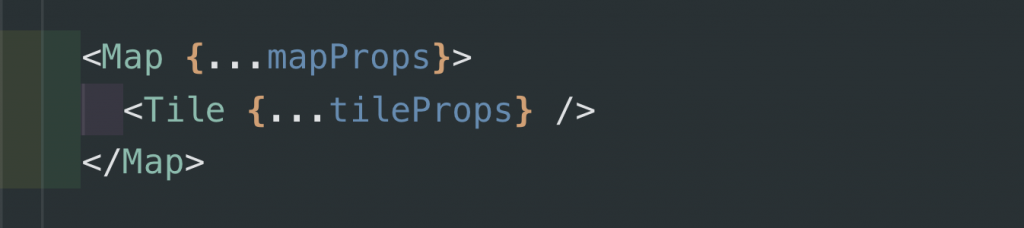
While you would probably expect that it’s not as flexible as utilizing the Leaflet APIs directly, this completely opens up one’s world to being able to easily spin up simple map solutions in an intuitive way without all the effort. After all, at that point, you’re spinning up a React app which you’re probably already familiar with.
Taking it a bit further with Gatsby
You want it easier, you say? You want me to build the map for you, you say? Well, you’re in luck! First, let’s give a brief introduction to another tool.
For the unfamiliar, Gatsby is a javascript framework that allows developers to easily spin up full, completely working React applications in a matter of minutes. They have all the nuts and bolts in place and moved out of the way to let you do what you do best: focus on the important parts of your application.
The beautiful part about Gatsby is that it supports extensions of their default installation which they call Starters. What better way to make it easier for people to spin up maps than to create a Gatsby Starter?
Gatsby Starter Leaflet
Combining the ease of a Gatsby Starter and the flexibility of Leaflet, we have Gatsby Starter Leaflet. This simple tool allows you to scaffold a new React application running Leaflet along side React Leaflet in the matter of seconds (or minutes depending on your computer).
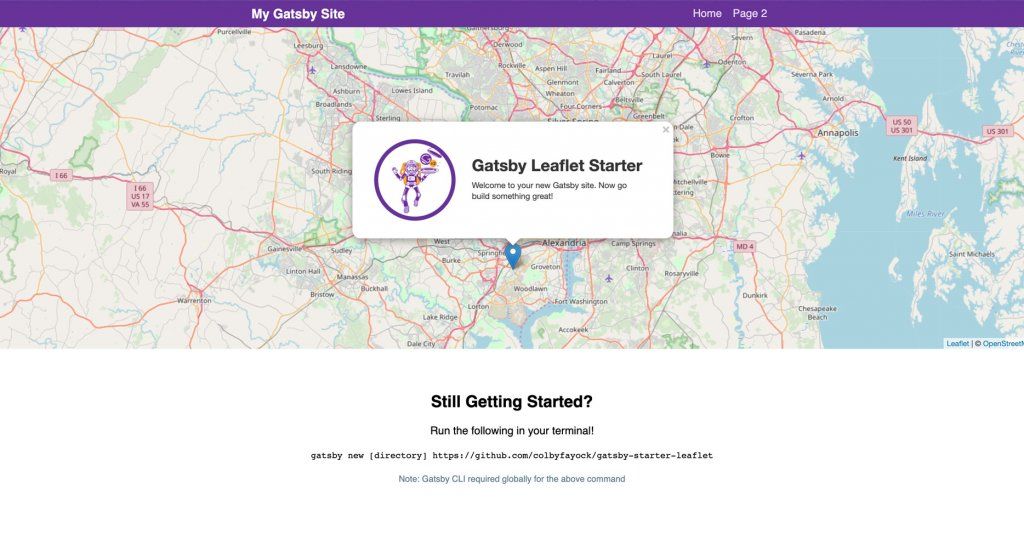
With a few basic commands, including installing your dependencies, you have an app that’s ready for you to start building on top of to create maps that will save the world. Even better, it includes some out of the box integrations like OpenStreetMap and an easy to setup map service configuration to the foundational React Leaflet component APIs that allow you to easily get product and have more flexibility to create smarter Mapping apps.
There’s gotta be some downsides…
No library or framework isn’t without its downsides. The more complicated your mapping application gets, the more pain points you run into. Here are a few from our experience that might help you settle in.

Leaflet — from the Window to React
Trying to manage state and the lifecycle between your Leaflet map and your React components can prove to be tricky. Trying to constantly maintain and update your component using props will immediately start to create issues between stale map state or memory leaks due to maps not properly unmounting when the component does.
Advice: mount your map with React, interact with it using the native Leaflet API. Once your map is rendered and settled down, you can use Leaflet to fly your user around the world and draw on your map without running into the state issues of multiple component renders.
Limited Use of Public Tiles
While there are a few tiling services available that allow you to easily plug in and create a basemap, not all of these are actually intended to be heavily used. Take for instance OpenStreetMap, while you may be able to play around and develop basic solutions on their public endpoint, heavy use will be throttled and potentially blocked without explicit permission from those who maintain their servers.
Advice: when you’re just starting out playing around, you shouldn’t have to worry too much. Worst case the maps will be a little slow to download. As your application starts to get more traffic, you’ll want to look into spinning up your own tiling service or paying for an out of the box solution such as Mapbox.
Get mapping!
It has never been easier to build a map-based web application. There is enough tooling, documentation, and public data available to help you get off the ground and start building maps to explore our world in the time it takes you to set up a blog or static website. So what are you waiting for?


Originally published at https://www.element84.com/blog/mapping-with-leaflet-and-react