
Life can be tough sometimes for UI designers. While they get to create great designs, they also get to deal with pressure from clients or PMs. They’re required to consider user experience and user flow. And they often struggle to find an effective way to communicate with developers.
To relieve some of the pressure from my fellow designers, I want to help by introducing a better way of handling UI components with state variations. I believe this is one of the biggest challenges designers face.
Dealing with state variations of UI components is painful. At first, I thought it was so difficult because you need to create different views, which can be boring. But then I realized that design is not the terrifying part. Rather, missing states and telling developers exactly what you want are. So, this article will address these two issues.
State and flowchart
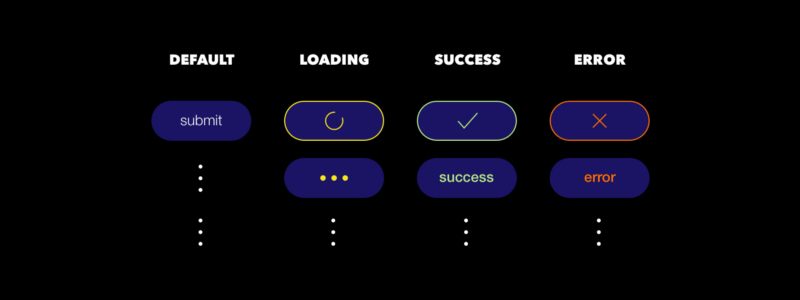
To prevent the design team from failing to prepare necessary states, these five states have been proposed as the norm for designers to follow. But for the sake of accuracy, I’d like to point out the difference between a state and a matching view first.
State is in fact the output of a UI component after receiving an input. One state might or might not need a matching view to interact with users.
Therefore, a UI component can only have five states, but each state can actually have various versions of the views. Confused? Let’s take a look at an everyday example of a submit button, and I think you’ll grasp it immediately.
But how do we know that there are three others states besides the initial one? And how do these states switch between each other? It’s easier to understand this question by looking at a flowchart.
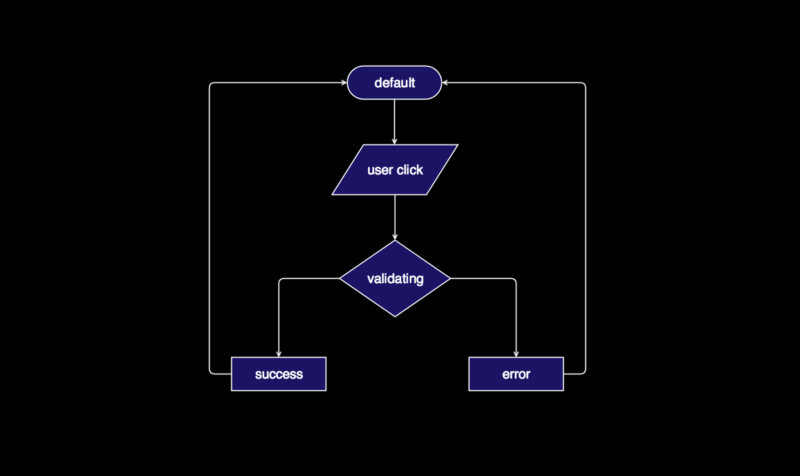
The method that helps us manage UI states is crucial. It should convey the message of what state the component should switch to after receiving certain input. But even though that flowchart is a powerful tool in most cases, it’s not ideal for detailed state variations, because of these disadvantages:
- Inconvenience. It requires the help of software or plugins (other than classic office or design software) to draw, modify, or maintain the chart. And it’s huge.
- Impreciseness. It’s hard to tell which states require a view, and which inputs switch the states.
- Complexity. It requires extra attention when choosing correct symbols and colors.
To sum up, it’s inefficient and inaccurate to manage the states of UI components using a flowchart. I believe most designers would agree. So, I’m now going to propose a better way here.
Finite State Machine (FSM) table
Designers, don’t get freaked out by the tech-sounding name! Let me break it down.
What is the Finite State Machine?
Finite state machine (FSM) is an abstract machine that organizes all possible states and inputs. This methodology is commonly applied in programming and all kinds of devices. Take a look at the finite state machine example of a turnstile illustrated in Wikipedia, and you’ll have a better idea right away.
Again, the FSM is just a collection of states and inputs. It’s that simple. Let’s take a deeper look at the usage of this table, and experience the power of it.
How to use the FSM table
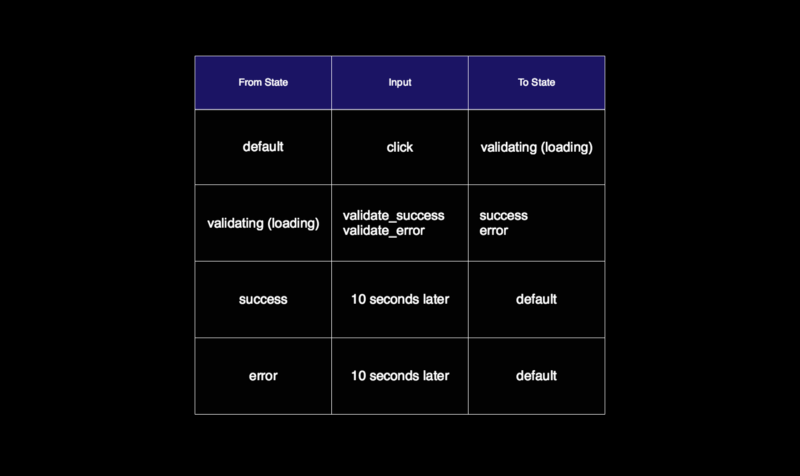
There are three columns in the table: From State, Input, and To State.
In the column From State, each cell represents one possible state the component can have.
The Input column contains the most important information in the table: what limited actions can be executed or inputs to receive in each state.
Finally, the To State column is in fact the output state according to the corresponding input.
Why is this better?
The table clearly lists three things:
- all the possible states
- when each action can be completed
- the result of completing a certain action
Comparing this to the flowchart, text notes, or interactive prototype, I believe most developers would be glad to receive this table. It covers almost all the information a developer needs!
Besides lowering communication costs, the FSM table encourages a mindset as well. It helps build a clear connection between cause and effect, preventing you from making decisions without the support of sound logic.
Better Team Communication
Now, after this brief introduction to the FSM table, let’s consider a more practical and complicated example so we can really see the power of it. Let’s look at a login page.
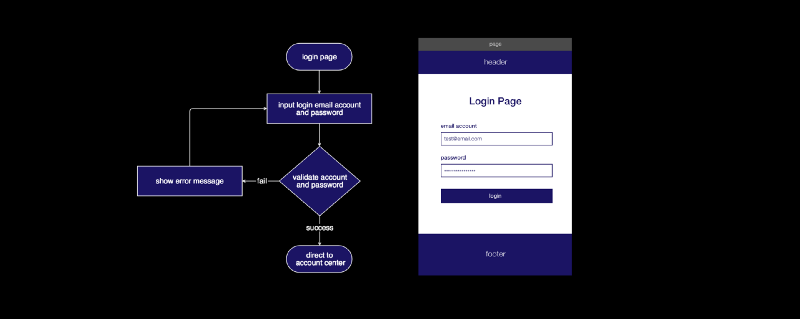
The page contains a header, a main heading, a form group with two input fields, and a submit button. To get an overview of the authentication functions, we still need a clear flowchart. But it can’t express the detailed variations of the components, because of the disadvantages mentioned above.
For example, if a user clicks the submit button and the validation fails, we get an error message — and we get this information from the flowchart. But what about specific input validation messages when the user tries to focus, blur, or click against each input field? When should the input validation function init? Should the submit button be locked until the user’s input in the form is validated?
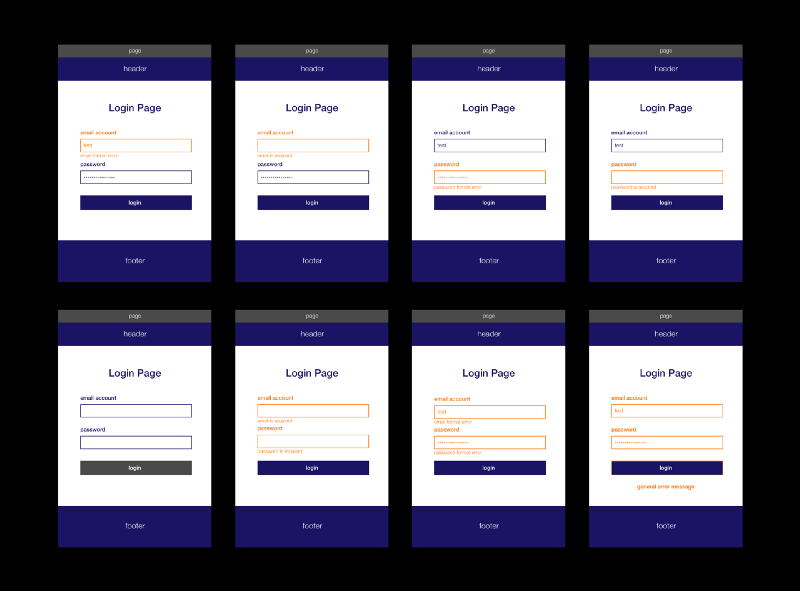
These are all detailed decisions that might affect user experience, and they shouldn’t be ignored. But how do you, as a designer, tell the developer exactly what you’re thinking? Interactive prototypes, lists of notes, and face-to-face meeting can all be ineffective.
But by preparing an FSM table, things instantly become crystal clear. You can even prepare numerous versions rapidly according to different user experience concerns.
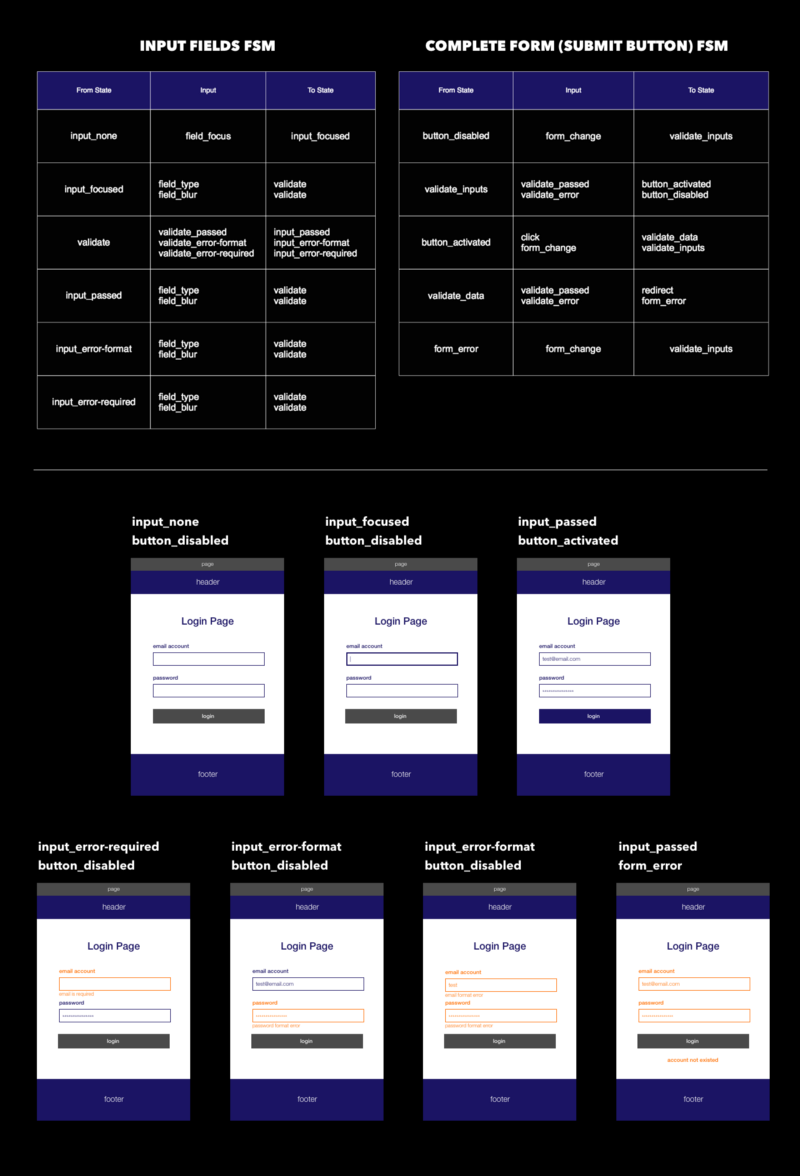
If you want the submit button to be disabled before all input fields are correctly completed, the table would look like this:
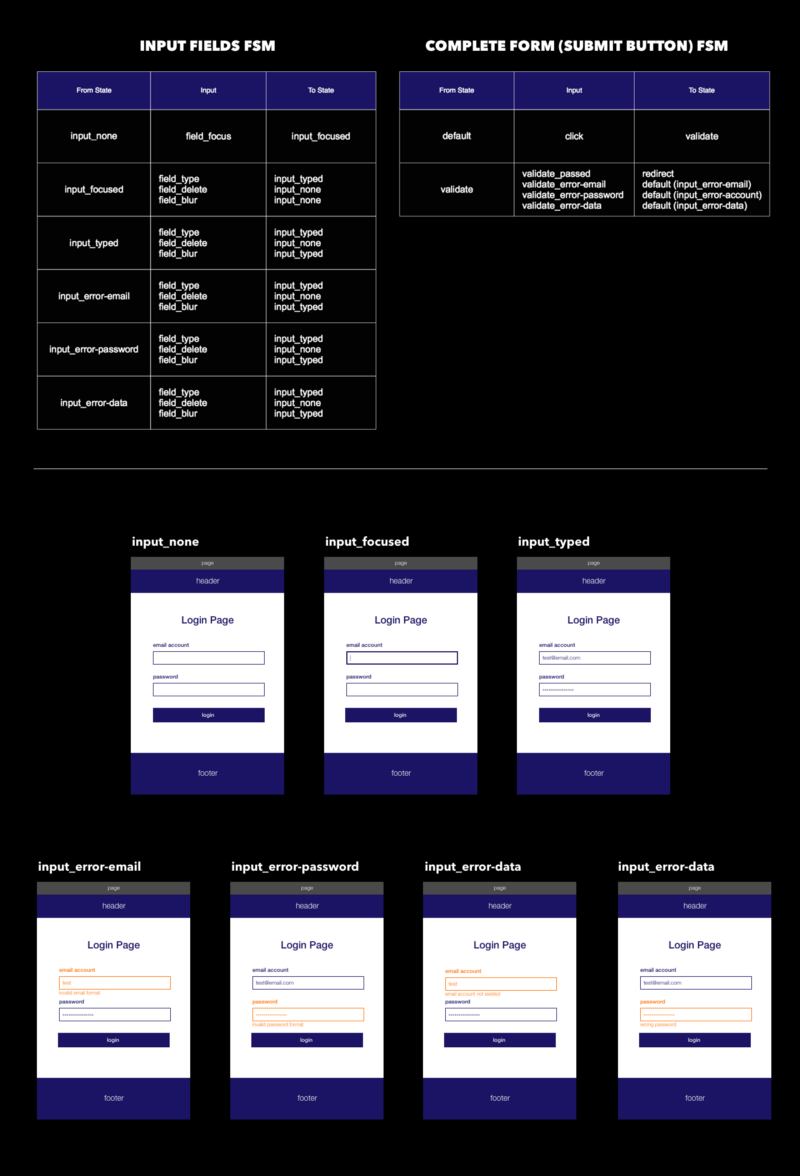
Or if you follow Google’s Material Design Guide, the table then looks like this:
Isn’t that easy, fast, and clear? I think it’s way better than other methods!
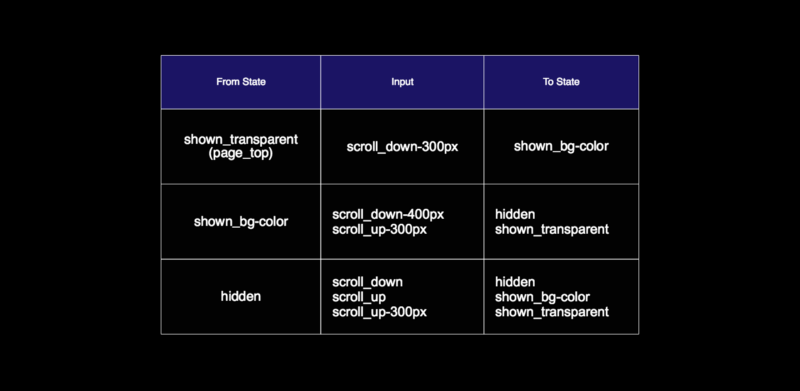
Furthermore, an FSM table can take care of components that aren’t related to data processing as well. Say that the designer wants the header to behave like this beautiful site. The FSM table can help provide thresholds and views of each state.
That’s it! Congratulations on completing a simple yet understandable document for your authentication page, by combining a wireframe, flowchart and FSM table!
One final note
In a big company with specialized teams that collaborate intimately on one product, designers might not be required to think about state management problems. I’ve just never been a part of this kind of team before. In general, I think most UI designers still need to communicate with developers, managers, or other designers about state transition in their careers.
I sincerely hope that the FSM table helps designers reduce precious time resources on dealing with communication obstacles, and even helps them discover a new way of thinking.
Finally, please let me know if you have any thoughts about this!
Chinese Version (中文版連結) / Read more of my work on vinceshao.com