

There is more to scalability than using cluster mode. In this tutorial, we'll explore 10 ways you can make your Node.js API ready to scale.
When working on a project, we often get a few real nuggets here and there on how to do something in a better way. We get to learn retrospectively, and then we're fully prepared to apply it next time around.
But how often does that actually work out? I don't even remember what I did yesterday sometimes. So I wrote this article.
This is my attempt to document some of the best Node.js scalability practices that are not talked about as often.
You can adopt these practices at any stage in your Node.js project. It doesn't have to be a last-minute patch.
With that said, here's what we will cover in this article:
- 🚦Use throttling
- 🐢 Optimize your database queries
- ䷪ Fail fast with circuit breaker
- 🔍 Log your checkpoints
- 🌠 Use Kafka over HTTP requests
- 🪝 Look out for memory leaks
- 🐇 Use caching
- 🎏 Use connection pooling
- 🕋 Seamless scale-ups
- 💎 OpenAPI compliant documentation
Use Throttling
Throttling allows you to limit access to your services to prevent them from being overwhelmed by too many requests. It has some clear benefits – you can safeguard your application whether it's a large burst of users or a denial-of-service attack.
The common place to implement a throttling mechanism is where the rate of input and output don't match. Particularly, when there is more inbound traffic than what a service can (or wants to) handle.
Let’s understand with a visualization.
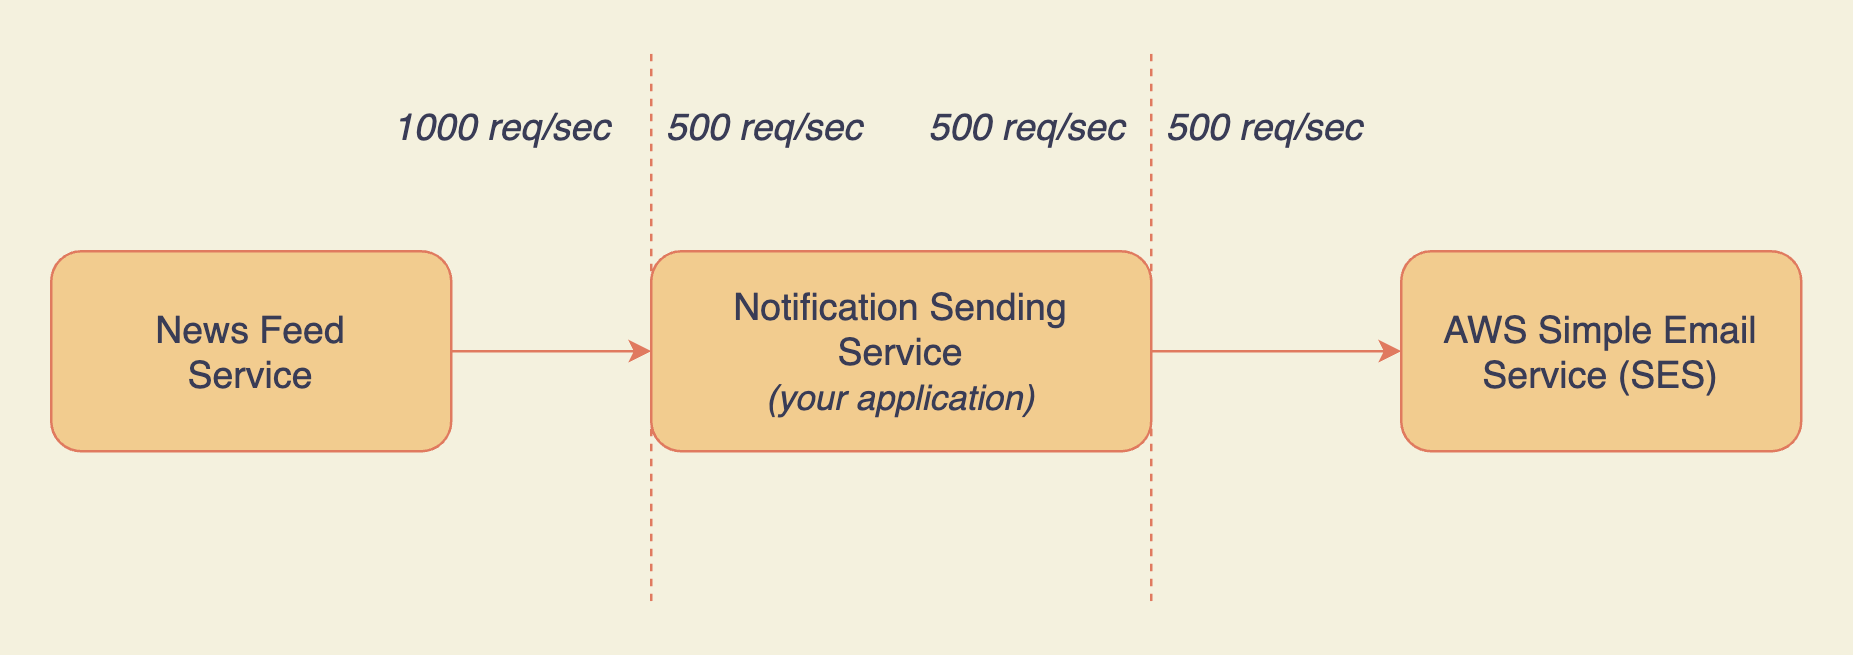
There's throttling at the first junction point between your application and the News Feed Service:
- News Feed Service (NFS) subscribes to your application for sending notifications.
- It sends 1000 requests to your application every second.
- Your application only handles 500 requests/sec based on the billing plan NFS subscribed to.
- Notifications are sent for the first 500 requests.
Now it is very important to note that all the requests by NFS that exceed the quota of 500 requests/sec should fail and have to be retried by the NFS.
Why reject the extra requests when you can queue them? There are a couple of reasons:
- Accepting all the requests will cause your application to start accumulating them. It will become a single point of failure (by RAM/disk exhaustion) for all the clients subscribed to your application, including NFS.
- You should not accept requests that are greater than the scope of the subscription plan of your clients (in this case, NFS).
For application level rate limiting, you can use express-rate-limit middleware for your Express.js API. For network level throttling, you can find solutions like WAF.
If you are using a pub-sub mechanism, you can throttle your consumers or subscribers as well. For instance, you can choose to consume only limited bytes of data when consuming a Kafka topic by setting the maxBytes option.
Optimize Your Database Queries
There will be times when querying the database is the only choice. You might have not cached the data or it could be stale.
When that happens, make sure your database is prepared for it. Having enough RAM and disk IOPS is a good first step.
Secondly, optimize your queries as much as possible. For starters, here are a couple of things that will set you on the right path:
- Try to use indexed fields when querying. Don't over-index your tables in hopes of the best performance. Indexes have their cost.
- For deletes, stick to soft deletes. If permanent deletion is necessary, delay it. (interesting story)
- When reading data, only fetch the required fields using projection. If possible, strip away the unnecessary metadata and methods (for example, Mongoose has lean).
- Try to decouple database performance from the user experience. If CRUD on the database can happen in the background (that is, non-blocking), do it. Don't leave the user waiting.
- Directly update the desired fields using update queries. Don't fetch the document, update the field, and save the whole document back to the database. It has network and database overhead.
Fail Fast with a Circuit Breaker
Imagine you get burst traffic on your Node.js application, and one of the external services required to fulfill the requests is down. Would you want to keep hitting the dead end for every request thereafter? Definitely Not. We don't want to waste time and resources on the requests destined to fail.
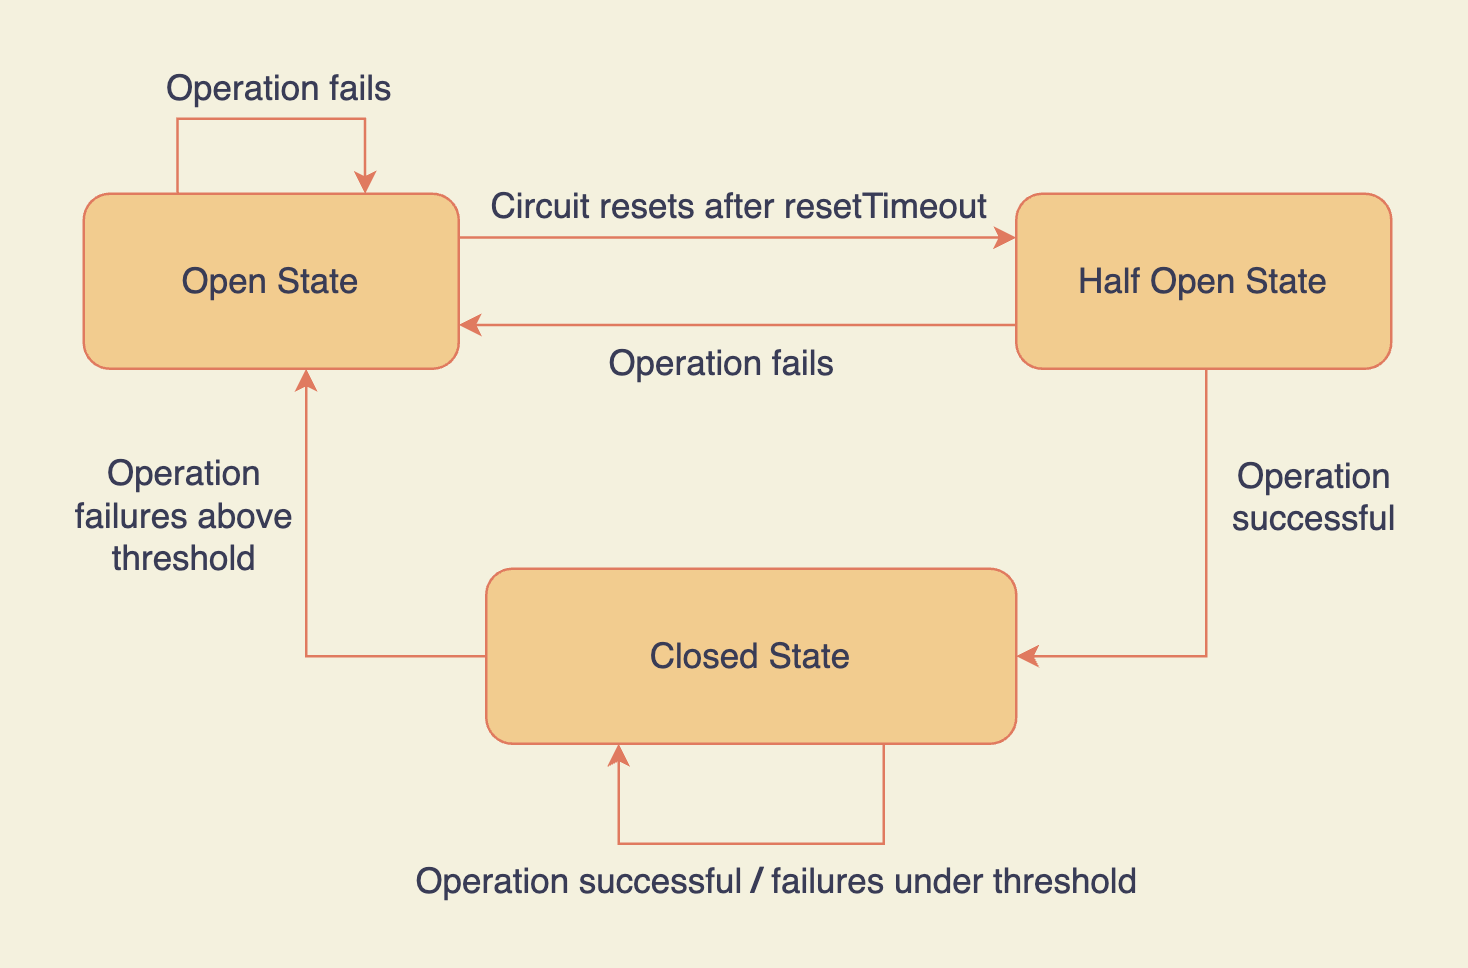
This is the whole idea of a circuit breaker. Fail early. Fail fast.
For example, if 50 out of 100 requests fail, it doesn't allow any more requests to that external service for the next X seconds. It prevents firing requests that are bound to fail.
Once the circuit resets, it allows requests to go through. If they fail again, the circuit breaks and the cycle repeats.
To learn more about how to add a circuit breaker to your Node.js application, check out Opposum. You can read more on circuit breakers here.
Log Your Checkpoints
A good logging setup allows you to spot errors quickly. You can create visualizations to understand your app's behavior, set up alerts, and debug efficiently.
You can check out the ELK stack for setting up a good logging and alerting pipeline.
While logging is an essential tool, it is very easy to overdo it. If you start logging everything, you can end up exhausting your disk IOPS causing your application to suffer.
As a good rule of thumb is to only log checkpoints.
Checkpoints can be:
- Requests, as they enter the main control flow in your application and after they are validated and sanitized.
- Request and response when interacting with an external service/SDK/API.
- The final response to that request.
- Helpful error messages for your catch handlers (with sane defaults for error messages).
PS: If a request goes through multiple services during the lifecycle, you can pass along a unique ID in the logs to capture a particular request across all the services.
Use Kafka Over HTTP Requests
While HTTP has its use-cases, it is easy to overdo it. Avoid using HTTP requests where it is not necessary.
Let's understand this with the help of an example.
Let's say you are building a product like Amazon and there are two services:
- Vendor service
- Inventory service
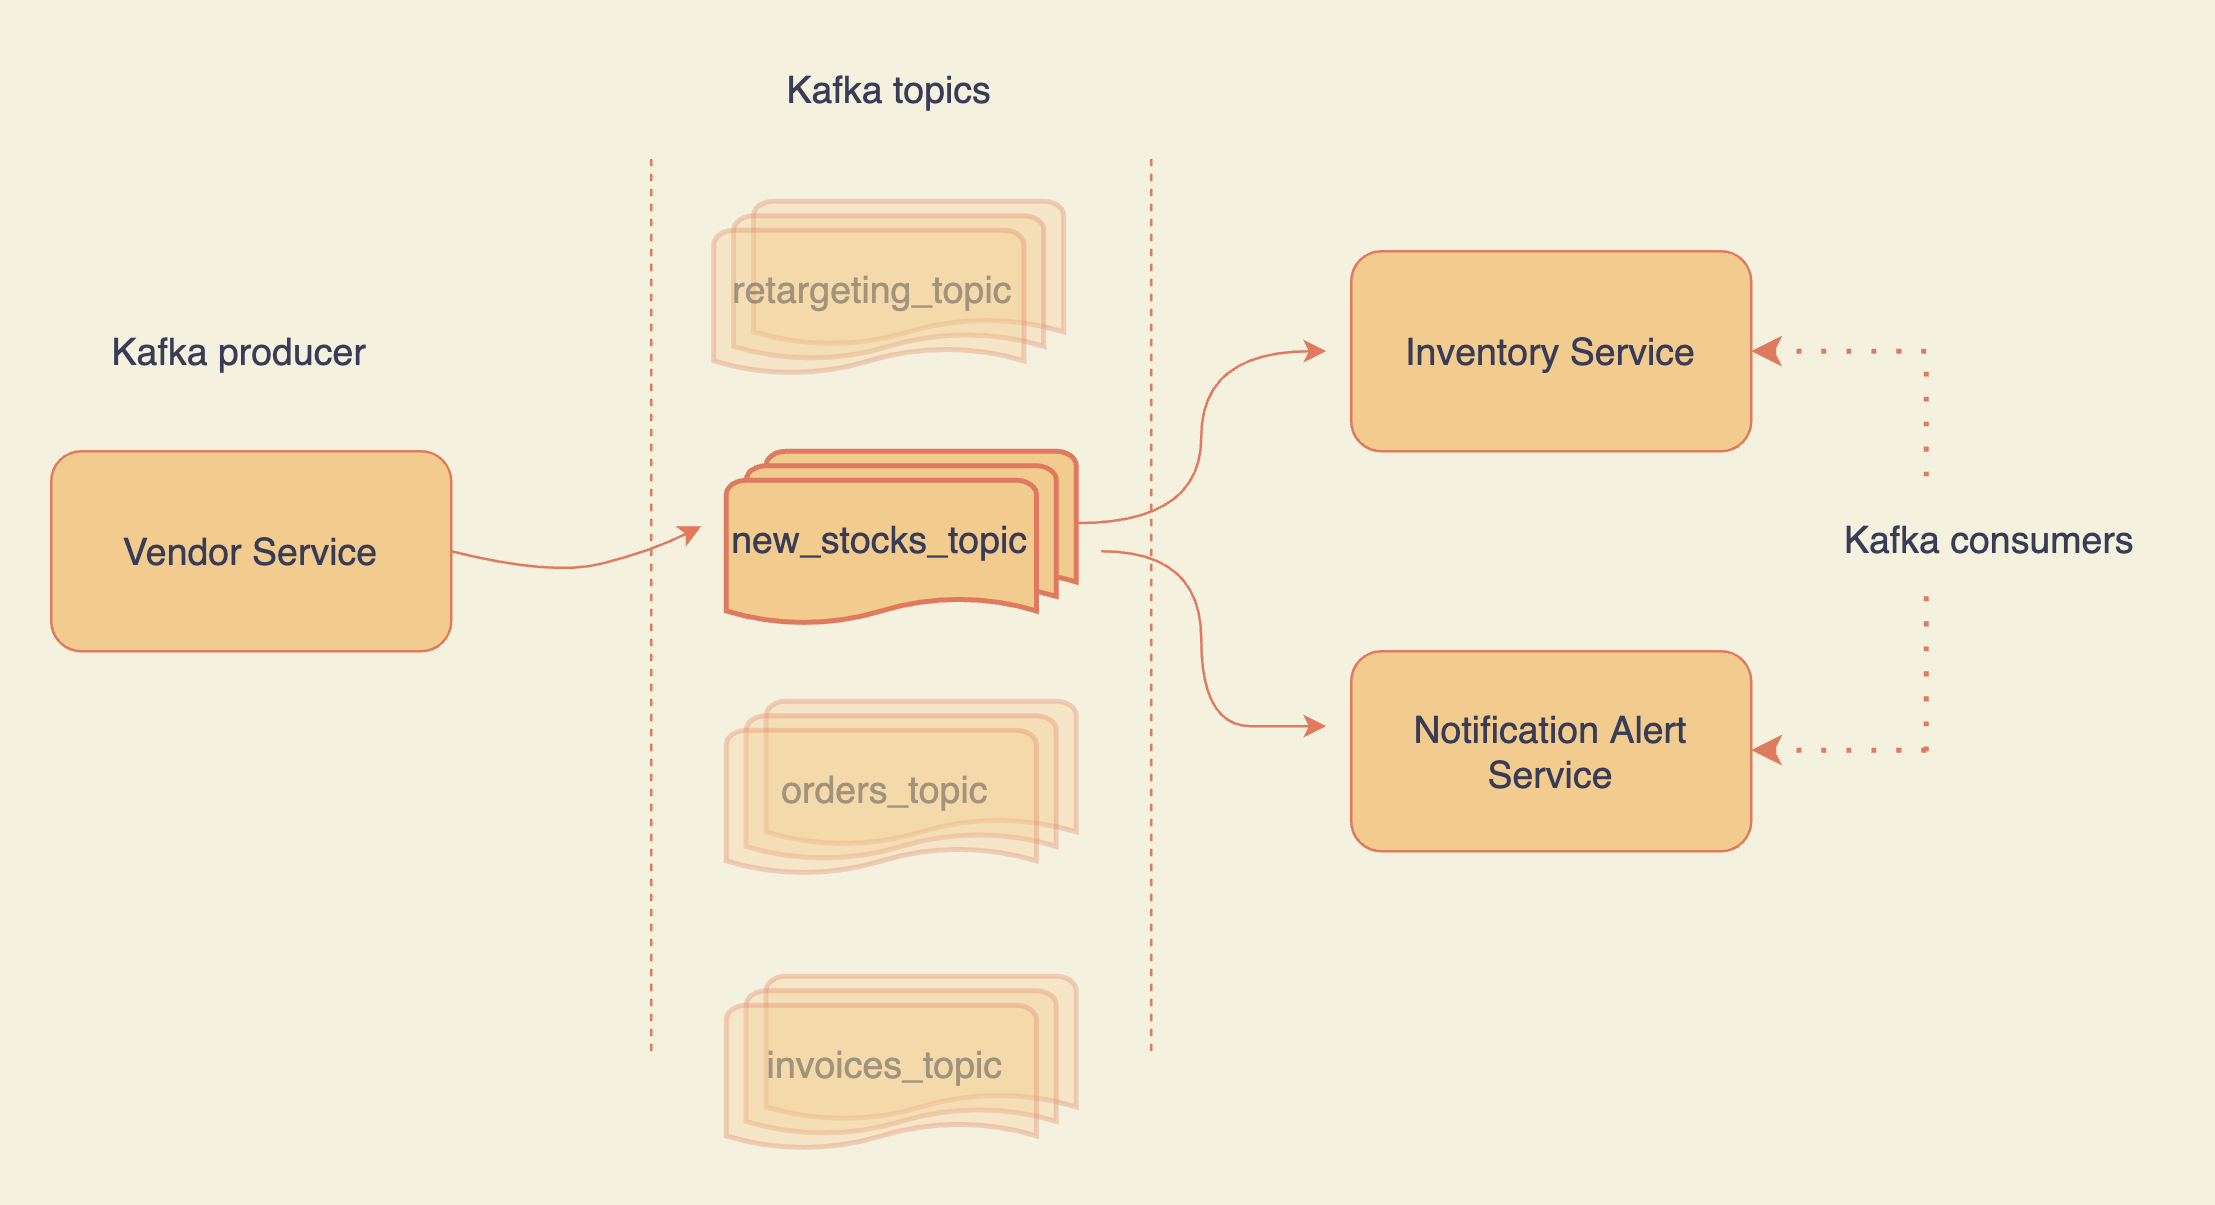
Whenever you receive new stock from the vendor service, you push the stock details to a Kafka topic. The inventory service listens to that topic and updates the database acknowledging the fresh restock.
To note that, you push the new stock data into the pipeline and move on. It is consumed by the inventory service at its own pace. Kafka allows you to decouple services.
Now, what happens if your inventory service goes down? It is not straightforward with HTTP requests. Whereas in the case of Kafka, you can replay the intended messages (for example using kcat). With Kafka, you do not lose data after consumption.
When an item comes back in stock, you might want to send out notifications to the users who wishlisted it. To do that, your notification service can listen to the same topic as the inventory service. This way, a single message bus is consumed at various places without HTTP overhead.
The Getting Started page of KafkaJS shares the exact snippet to get you started with a basic setup in your Node.js application. I’d highly recommend checking it out, as there's a lot to explore.
Look Out for Memory Leaks
If you don't write memory-safe code and don't profile your application often, you may end up with a crashed server.
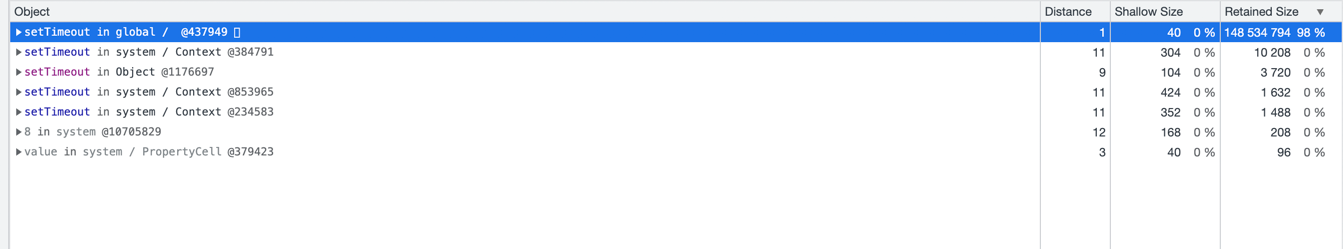
You do not want your profiling results to look like this:
For starters, I would recommend the following:
- Run your Node.js API with the
--inspectflag. - Open
chrome://inspect/#devicesin your Chrome browser. - Click inspect >
Memorytab >Allocation instrumentation on timeline. - Perform some operations on your app. You can use apache bench on macOS to fire off multiple requests. Run
curl cheat.sh/abin your terminal to learn how to use it. - Stop the recording and analyze the memory retainers.
If you find any large blocks of retained memory, try to minimize it. There are a lot of resources on this topic. Start by googling "how to prevent memory leaks in Node.js".
Profiling your Node.js application and looking for memory utilization patterns should be regular practice. Let's make "Profiling Driven Refactor" (PDR) a thing?
Use Caching to Prevent Excessive Database Lookup
The goal is to not hit the database for every request your application gets. Storing the results in cache decreases the load on your database and boosts performance.
There are two strategies when working with caching.
Write through caching makes sure the data is inserted into the database and the cache when a write operation happens. This keeps the cache relevant and leads to better performance. Downsides? Expensive cache as you store infrequently used data to the cache as well.
Whereas in Lazy loading, the data is only written to the cache when it is first read. The first request serves the data from the database but the consequent requests use the cache. It has a smaller cost but increased response time for the first request.
To decide the TTL (or Time To Live) for the cached data, ask yourself:
- How often the underlying data changes?
- What is the risk of returning outdated data to the end user?
If it is okay, having more TTL will help you with a better performance.
Importantly, add a slight delta to your TTLs. If your application receives a large burst of traffic and all of your cached data expires at once, it can lead to unbearable load on the database, affecting user experience.
final TTL = estimated value of TTL + small random deltaThere are a number of policies to perform cache eviction. But leaving it on default settings is a valid and accepted approach.
Use Connection Pooling
Opening a standalone connection to the database is costly. It involves TCP handshake, SSL, authentication and authorization checks, and so on.
Instead, you can leverage connection pooling.
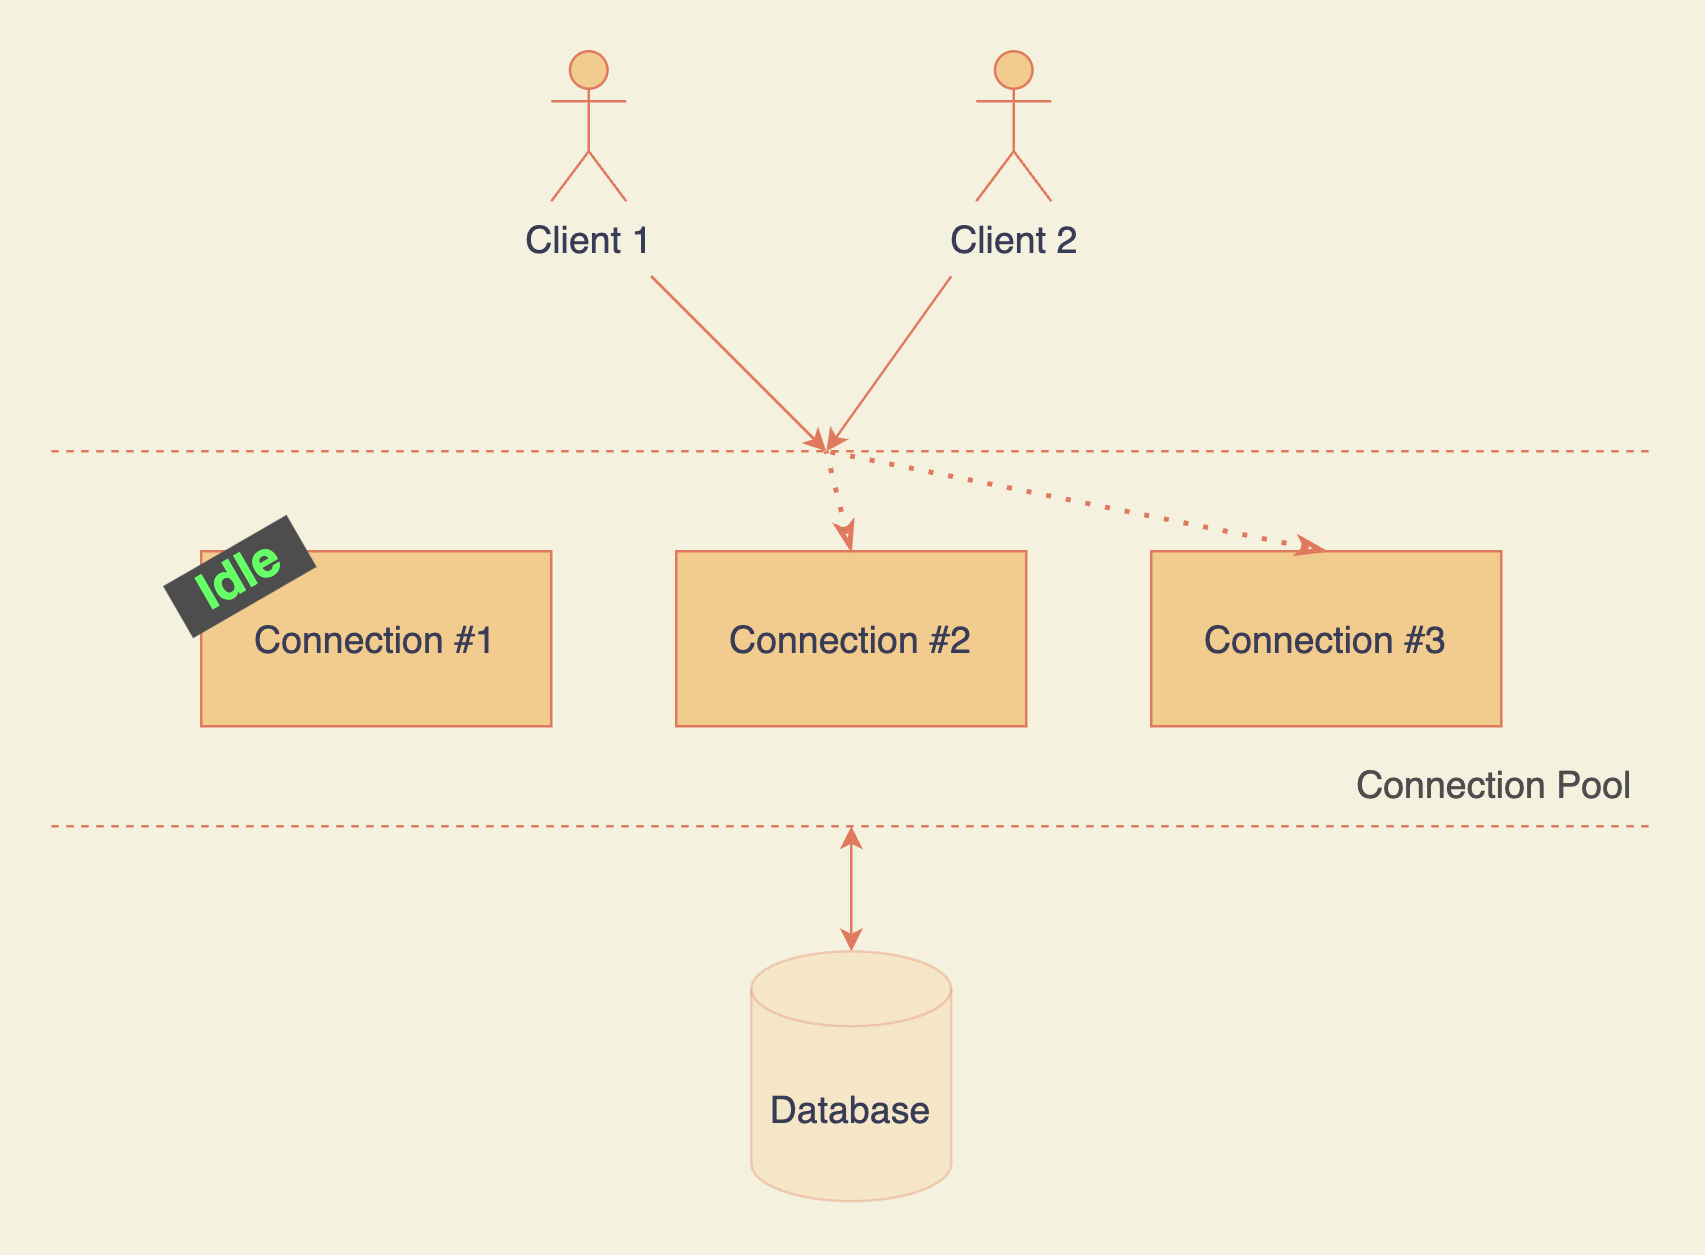
A connection pool holds multiple connections at any given time. Whenever you need it, the pool manager assigns any available/idle connection. You get to skip the cold start phase of a brand new connection.
Why not max out the number of connections in the pool, then? Because it highly depends on your hardware resources. If you ignore it, performance can take a massive toll.
The more the connections, the less RAM each connection has, and the slower the queries that leverage RAM (for example sort). The same principle applies to your disk and CPU. With every new connection, you are spreading your resources thin across the connections.
You can tweak the number of connections till it matches your needs. For starters, you can get an estimate on the size you need from here.
Read about the MongoDB connection pool here. For PostgreSQL, you can use the node-postgres package. It has built-in support for connection pooling.
Seamless Scale-ups
When your application's user base is starting to grow and you have already hit the ceiling on vertical scaling, what do you do? You scale horizontally.
Vertical scaling means increasing the resources of a node (CPU, memory, etc.) whereas horizontal scaling involves adding more nodes to balance out the load on each node.
If you’re using AWS, you can leverage Automatic Scaling Groups (ASG) which horizontally scales the number of servers based on a predefined rule (for example when CPU utilization is more than 50%).
You can even pre-schedule the scale up and scale down using scheduled actions in case of predictable traffic patterns (for example during the World Cup finals for a streaming service).
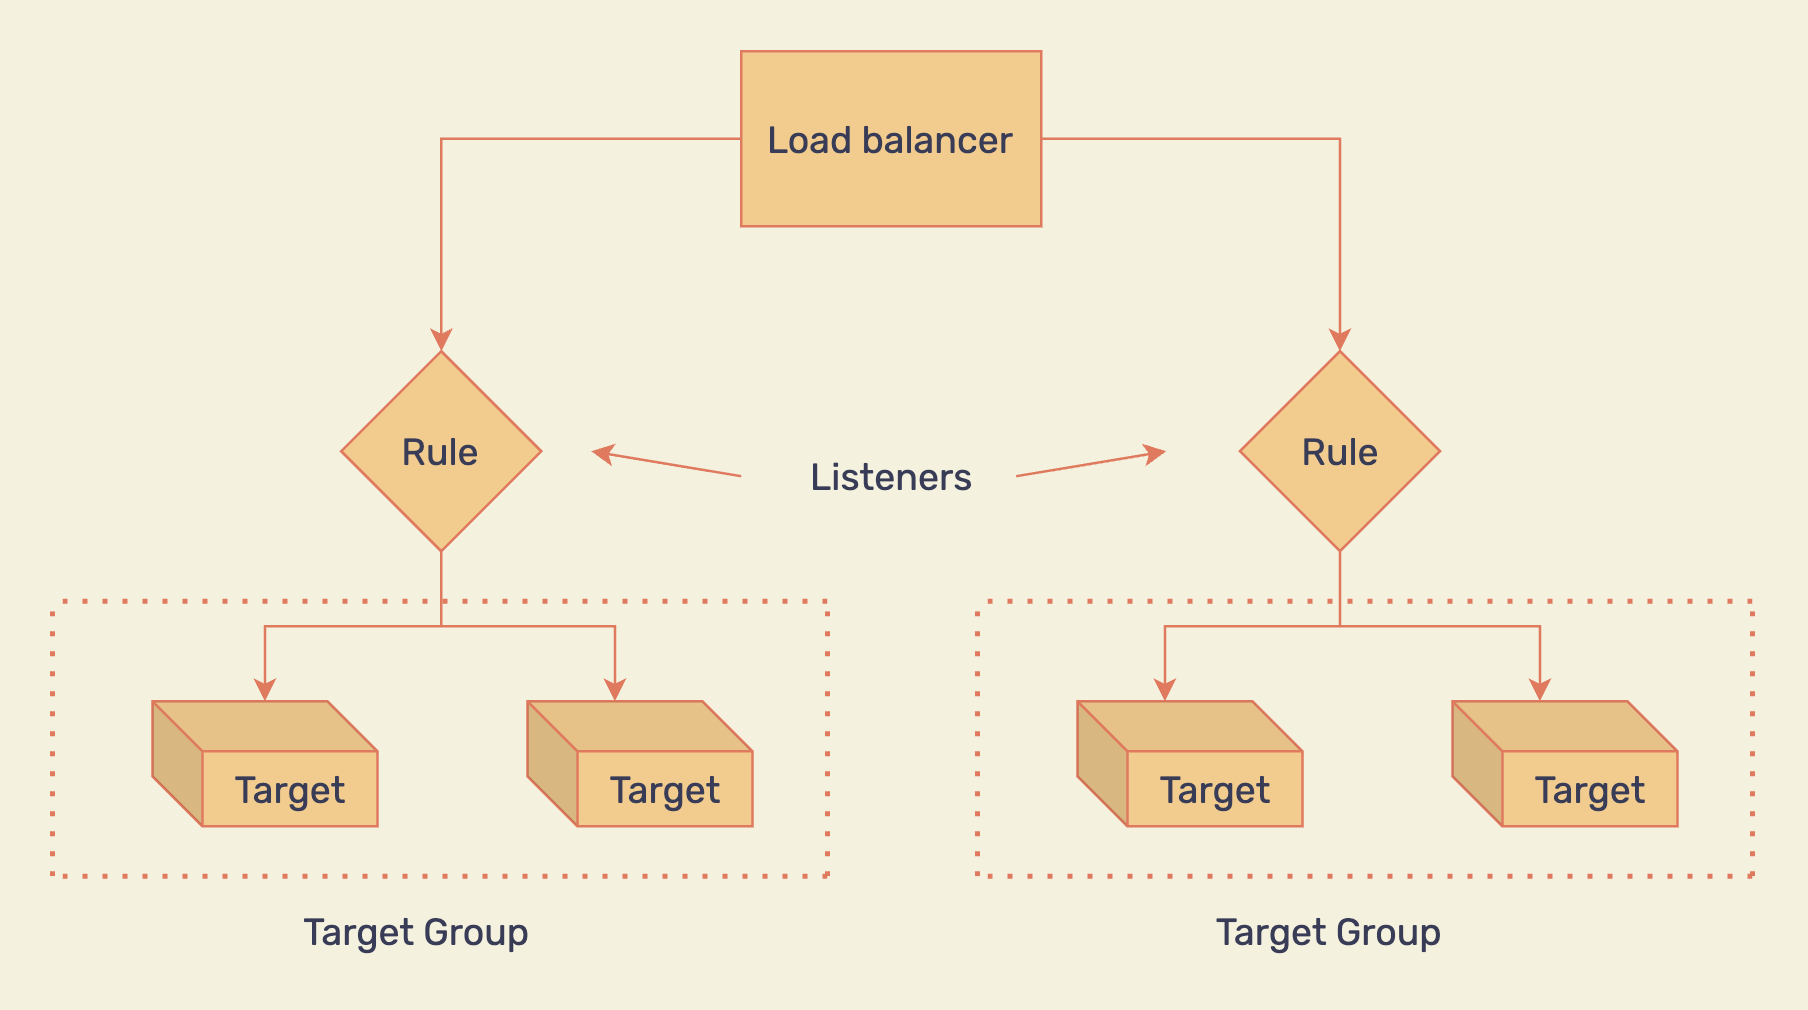
Once you have your ASG in place, adding a load balancer in front will make sure the traffic is routed to all the instances based on a chosen strategy (like round robin, for example).
PS: It is always a good idea to estimate the requests your single server can handle (CPU, memory, disk, and so on) and allocate at least 30% more.
OpenAPI Compliant Documentation
It might not directly affect your ability to scale a Node.js application, but I had to include this in the list. If you've ever done an API integration, you know it.
It is crucial to know everything about the API before you take a single step forward. It makes it easy to integrate, iterate, and reason about the design. Not to mention the gains in the speed of development.
Make sure to create OpenAPI Specification (OAS) for your Node.js API.
It allows you to create API documentation in an industry-standard manner. It acts as a single source of truth. When defined properly, it makes interacting with the API much more productive.
I have created and published a sample API documentation here. You can even inspect any API using the swagger inspector.
You can find all of your API documentations and create new ones from the Swagger Hub dashboard.
Now you go, captain!
We have looked at ten lesser-known best practices to prepare Node.js for scale and how you can take your first steps with each one of them.
Now it is your turn to go through the checklist and explore the ones you find lacking in your Node.js application.
I hope you found this helpful and it gave you some pointers to move forward in your scalability endeavor. This is not an exhaustive list of all the best practices – I have just included the ones I found are not talked about as much based on my experience.
Feel free to reach out on Twitter. I'd love to hear your feedback and suggestions on other best practices that you are using.
Liked the article? Get the improvement pills on backend web development 💌.