

Working with data is becoming an increasingly important skill in the modern workplace.
Data is no longer the domain of analysts and software engineers. With today's technology, anyone can work with data to analyse trends and inform their decision making.
A fundamental concept when working with data is 'querying' a data set. This is to literally ask questions about a set of data. A query language is a software language that provides a syntax for asking such questions.
If you don't have any experience writing queries, they can appear a little intimidating. However, with a little practice, you can master the basics.
Here's how you can get started in Google Sheets.
Google Visualization API Query Language
You may already be using Google Sheets for much of your day-to-day work. Perhaps you are familiar with using it to generate charts and graphs.
The Google Visualization API Query Language is the magic that works behind the scenes to make this possible.
But did you know you can access this language through the QUERY() function? It can be a powerful tool for working with large sheets of data.
There are a lot of similarities between the query language and SQL.
In both cases, you define a data set of columns and rows, and choose different columns and rows by specifying various criteria and conditions.
In this article, the example data will come from a large CSV file containing international football results between 1872 and 2019. You can download the data from Kaggle.
In a new Google Sheet, upload the CSV file. You can select all the data with Ctrl+A (or Cmd+A on Mac).
From the menu ribbon, choose Data > Named ranges... and call the range selected something like 'data'. This will make it easier to work with.
Now, you are ready to start querying the data. Create a new tab in the spreadsheet, and in cell A1, create a new QUERY() formula.
Get all England matches
This first query finds all the rows in the data set where England are either the home team or the away team.
The QUERY() formula takes at least two arguments. The first is the named range, which will be the data set queried. The second is a string that contains the actual query.
=QUERY(data, "SELECT * WHERE B = 'England' OR C = 'England'")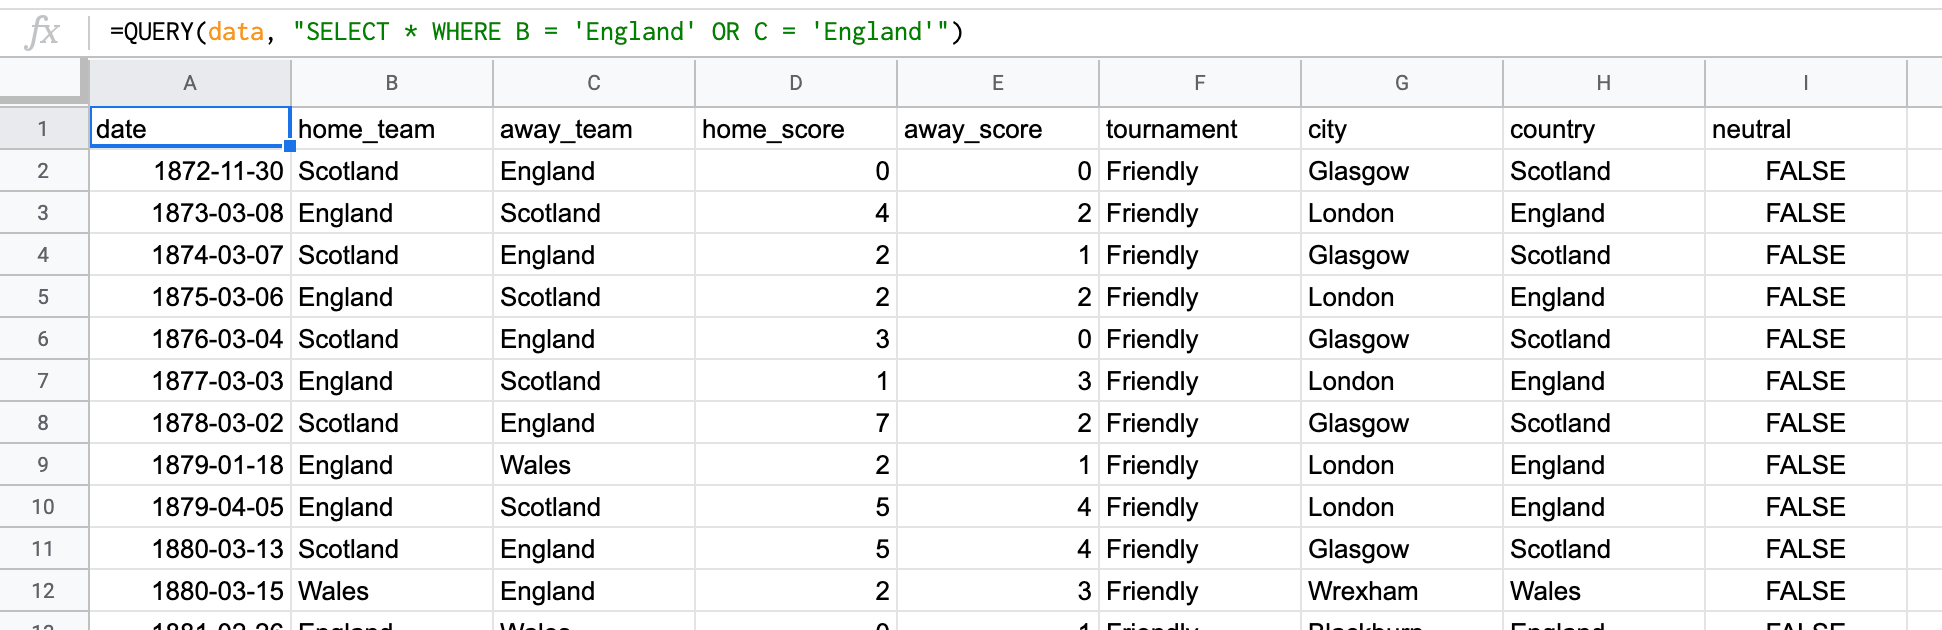
Let's break this down.
SELECT * asks to return all columns in the data set. If you only wanted columns A, B and C, you would write SELECT A, B, C.
Next, you include a filter to find only rows where column B or column C contain the team 'England'. Make sure to use single-quotes for strings inside the query. Double-quotes are used to open and close the query itself.
This formula returns all the rows where England have played. If you want to search for another team, simply change the condition in the filter.
Count all friendly matches
Next, let's count how many friendly matches are in the data set.
=QUERY(data, "SELECT COUNT(A) WHERE F = 'Friendly'")This makes use of the Query Language's COUNT() function. This is an example of an aggregate function. Aggregate functions summarise many rows into one.
For example, in this data set there are 16,716 rows where column F equals 'Friendly'. Instead of returning all these rows, the query returns a single row - which counts them instead.
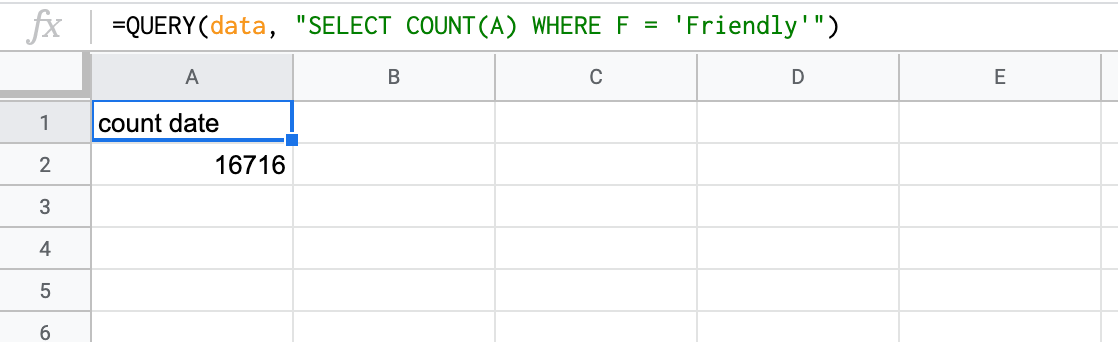
Other examples of aggregate functions include MAX(), MIN() and AVG(). Instead of returning all the rows matching the query, it finds their maximum, minimum and average values instead.
Group by tournament
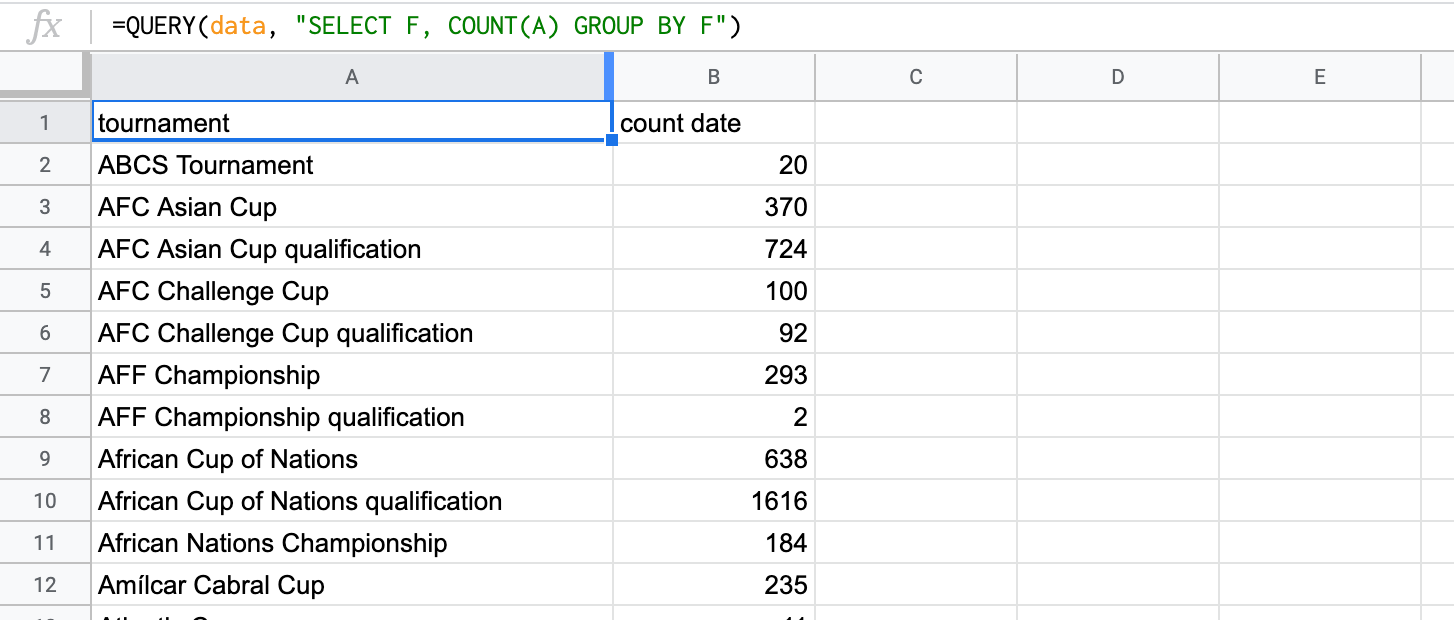
Aggregate functions can do more if you use a GROUP BY statement alongside them. This query finds out how many matches have been played by each tournament type.
=QUERY(data, "SELECT F, COUNT(A) GROUP BY F")This query groups the data set by each of the values in column F. It then counts how many rows there are in each group.
You can use GROUP BY on more than one column. For example, to find how many matches have been played in each country by tournament, use the query below:
=QUERY(data, "SELECT H, F, COUNT(A) GROUP BY H, F")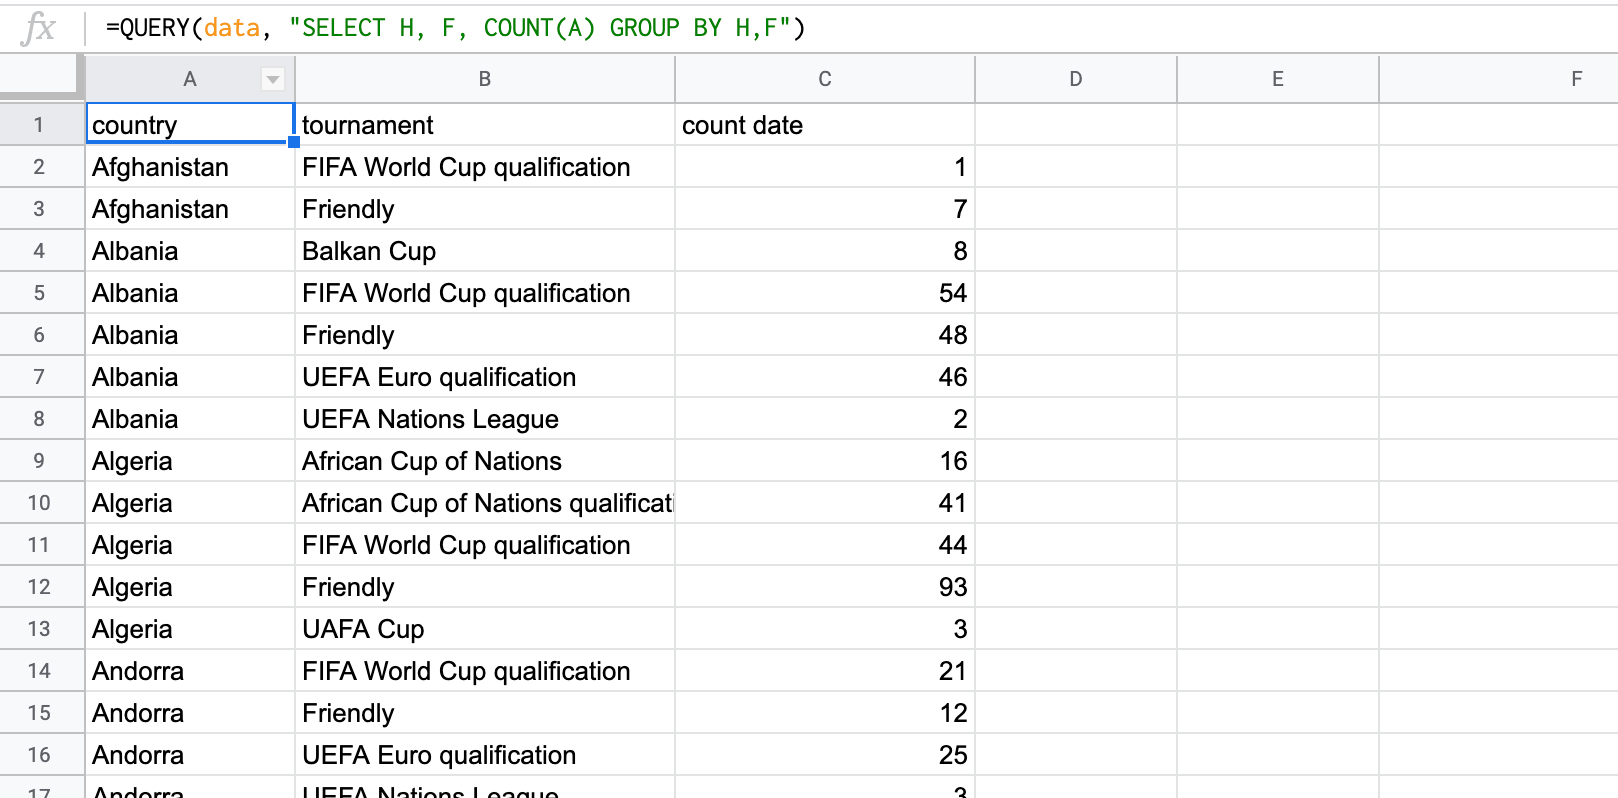
Let's try some more advanced filtering.
Get all England vs Germany matches
You can specify more complex filter logic using the AND and OR keywords. For readability, it can help to use brackets around each part of the filter.
For example, to find all the matches between England and Germany:
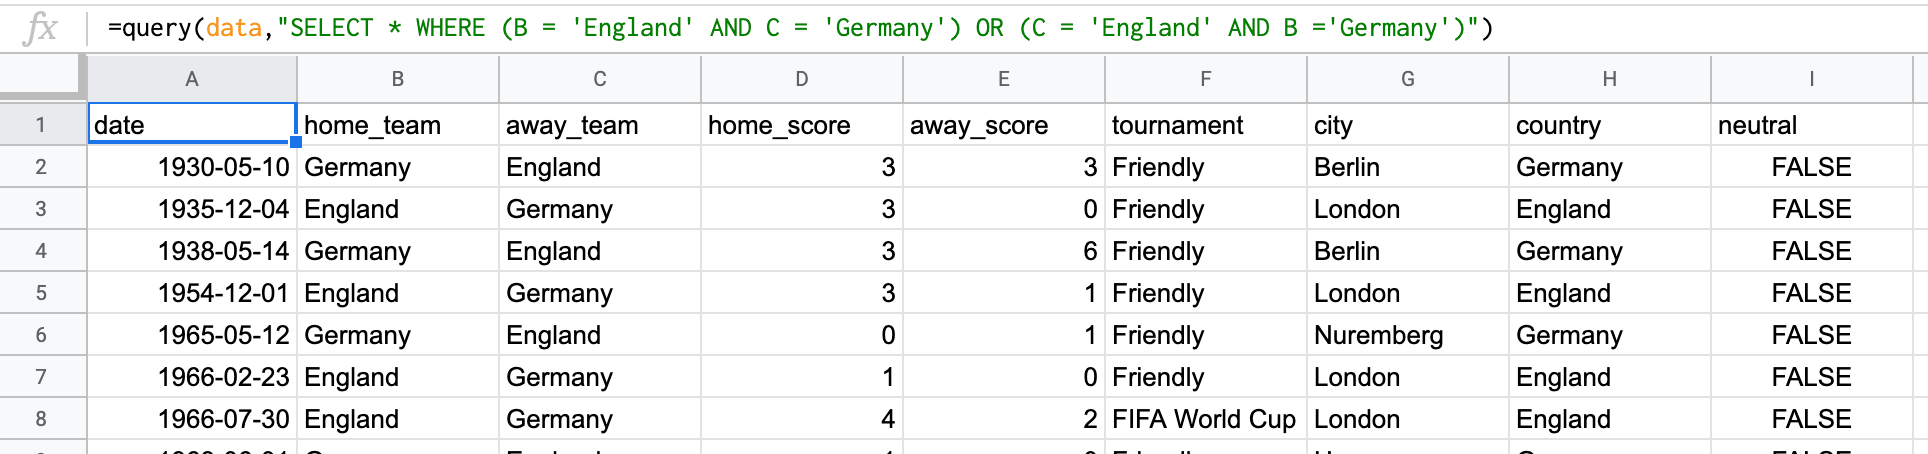
=QUERY(data, "SELECT * WHERE (B = 'England' AND C = 'Germany') OR (C = 'England' AND B ='Germany')")This filter has two criteria - one where England are the home team and Germany are away, and the other vice versa.
Using data validation makes it easy to pick any two teams in the data set.
Then, you can write a query that uses the values of different cells in its filter. Remember to use single-quotes for identifying strings within the query, and double-quotes to open and close different pieces of the query.
=QUERY(data, "SELECT * WHERE (B = '"&B1&"' AND C = '"&B2&"') OR (C = '"&B1&"' AND B ='"&B2&"')")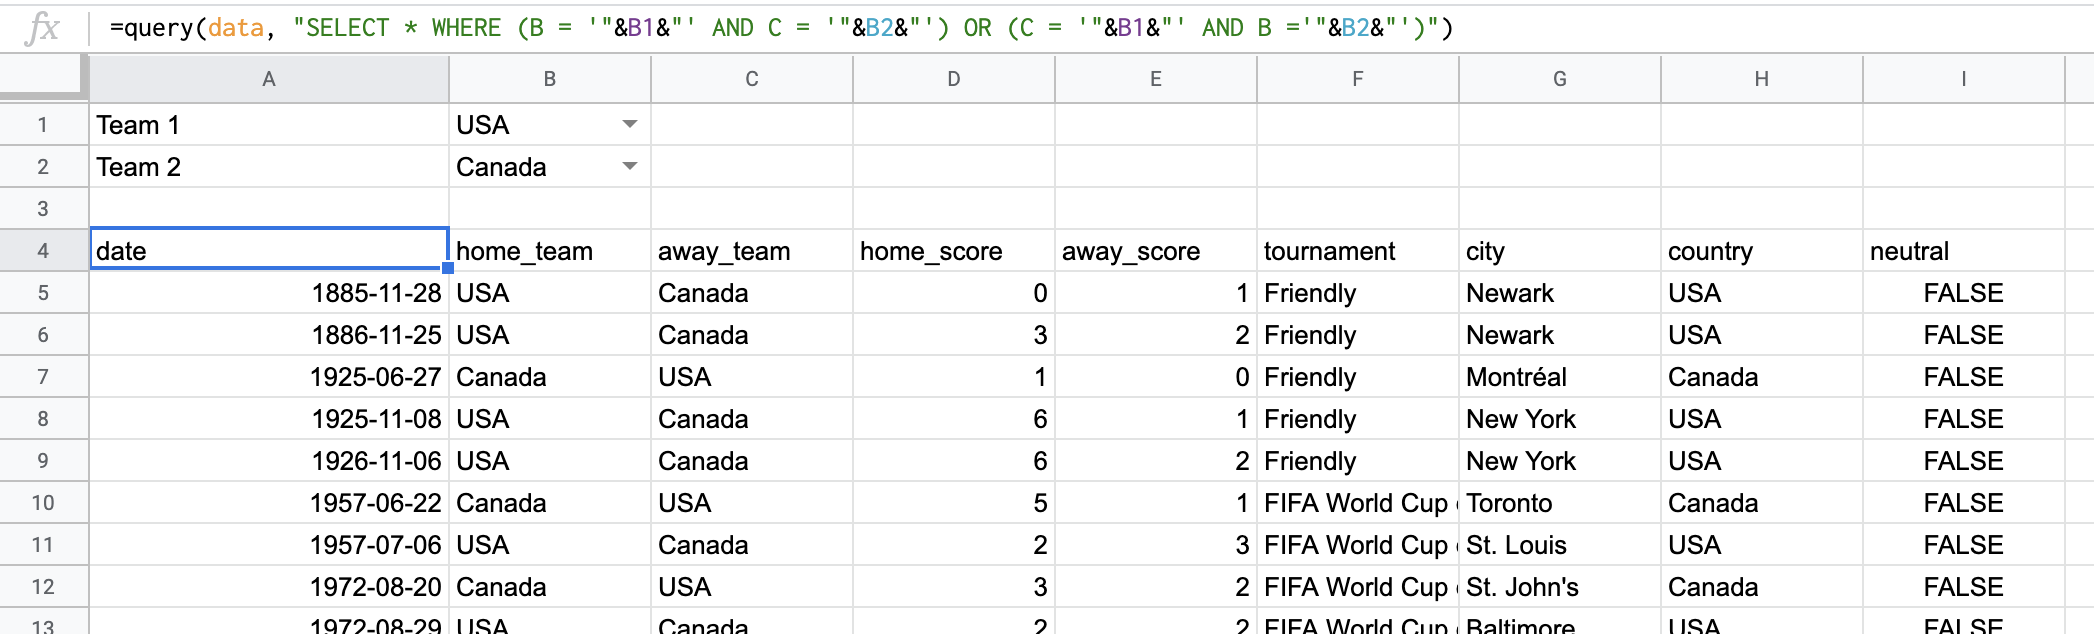
Looking for trends
Aggregate functions and filters make powerful tools when used in combination. Once you are comfortable with how they work, you can start searching for all kinds of interesting trends in your data set.
For example, the query below finds the average goals per game, by each year since 1900.
=QUERY(data, "SELECT YEAR(A), AVG(D) + AVG(E) WHERE YEAR(A) >= 1900 GROUP BY YEAR(A)")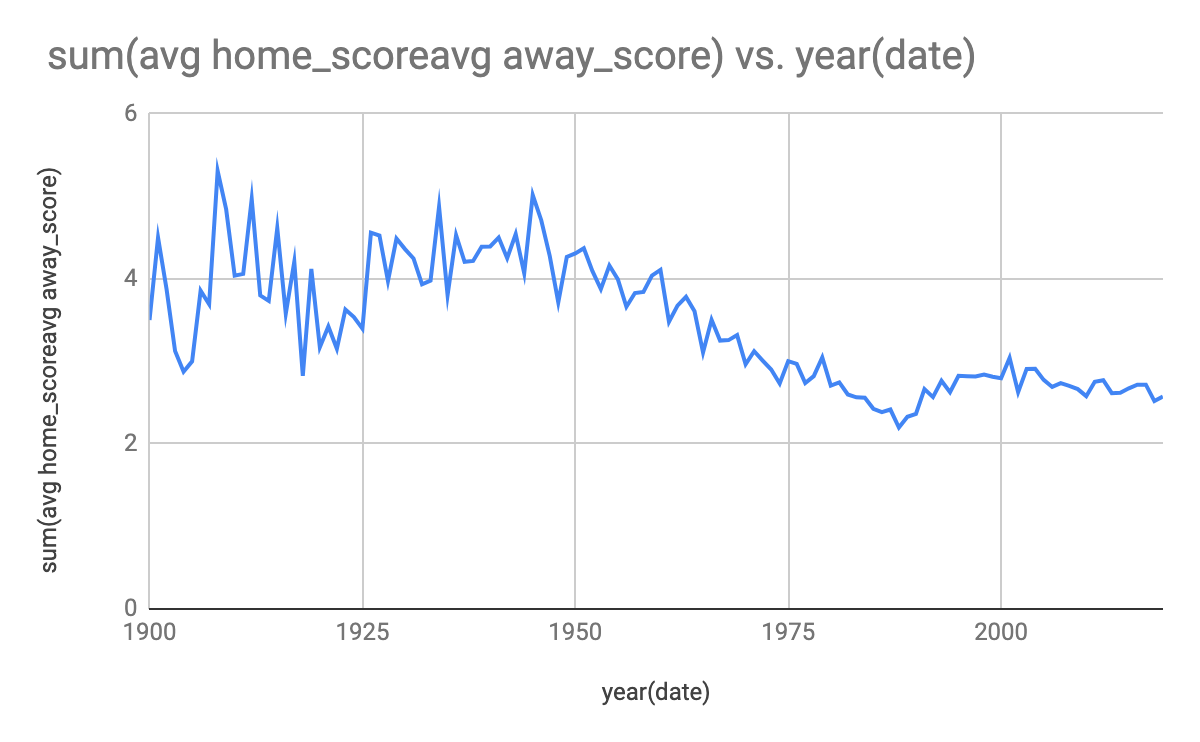
If you plot the query result as a line graph, you can immediately start seeing trends over time.
Ordering the results
Sometimes, you are not interested in finding all the matching rows in a data set. Often, you will want to sort them according to some criteria. Perhaps you only wish to find the top ten records.
This query finds the top ten highest scoring matches in the data set.
=QUERY(data, "SELECT * ORDER BY (D+E) DESC LIMIT 10")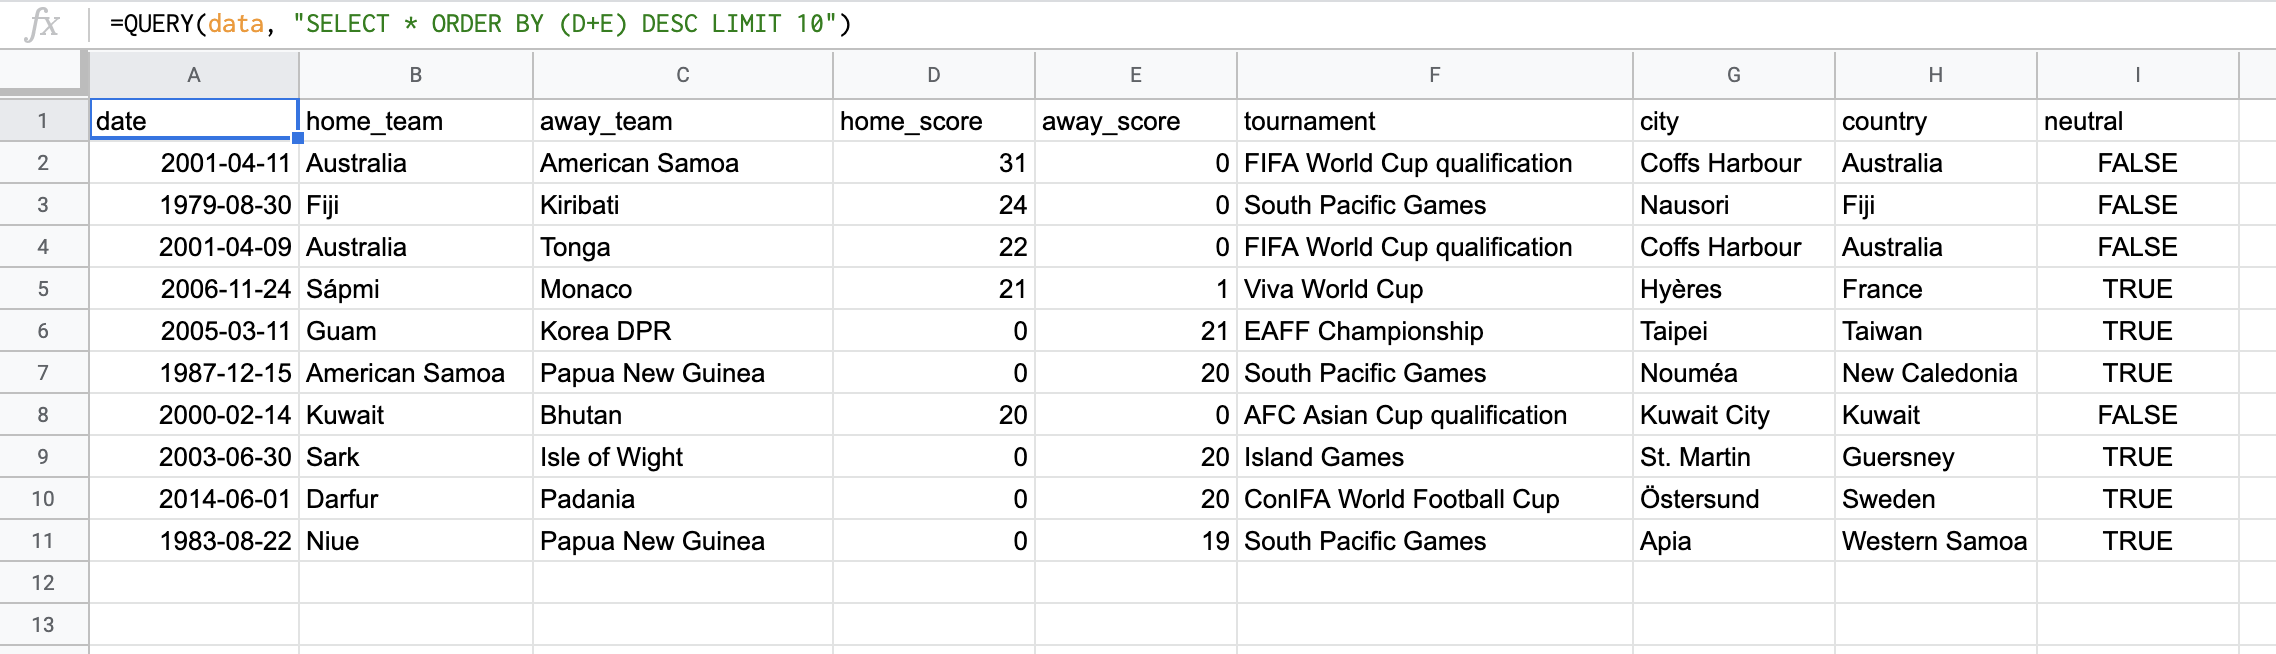
Notice the ORDER BY statement. This sorts the rows according to the columns specified. Here, the query sorts the output by the number of goals scored in the game.
The DESC keyword indicates to sort in descending order (the ASC keyword would have sorted them in ascending order).
Finally, the LIMIT keyword restricts the output to a given number of rows (in this case, ten).
Looks like there have been some pretty one-sided games in Oceania!
Which cities have hosted the most World Cup matches?
And now for one final example to bring everything together and get your imagination going.
This query finds the top ten cities that have hosted the most FIFA World Cup matches.
=QUERY(data, "SELECT G, COUNT(A) WHERE F = 'FIFA World Cup' GROUP BY G ORDER BY COUNT(A) DESC LIMIT 10")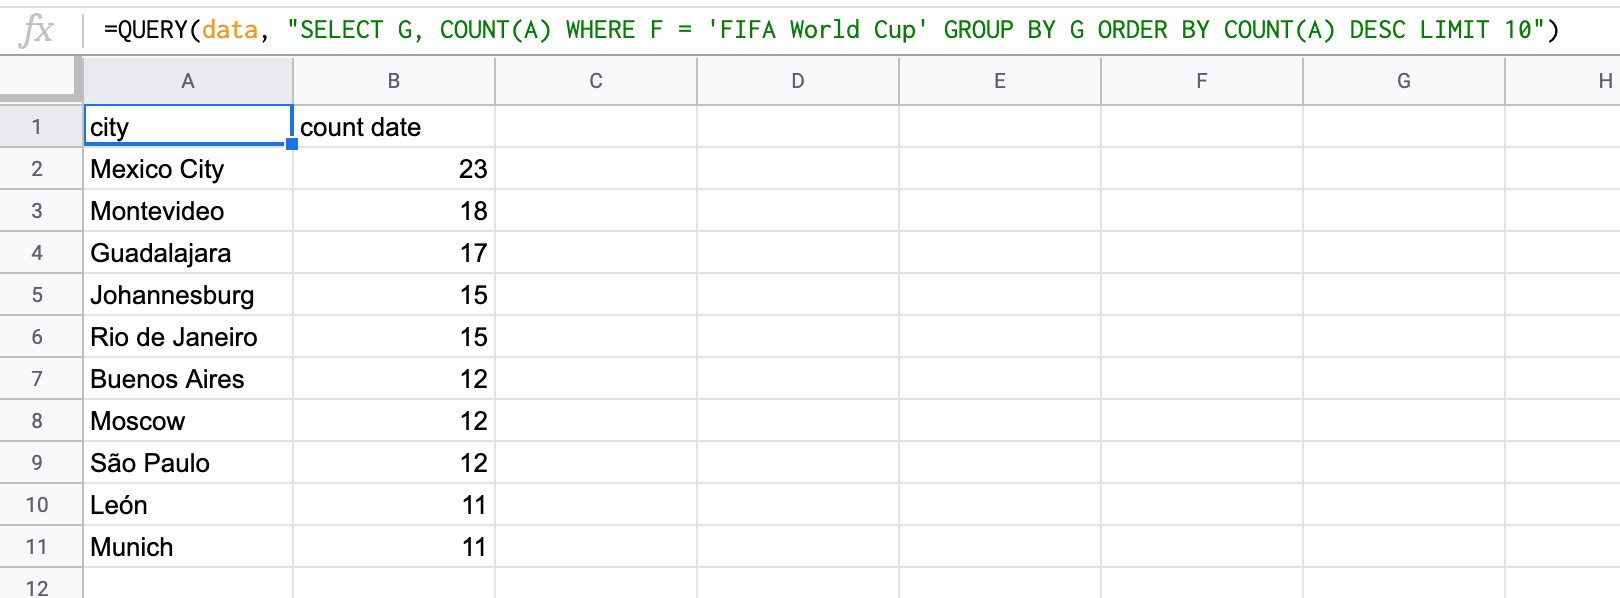
Now it's your turn
Hopefully you have found this article useful. If you are comfortable with the logic in each example, then you are ready to try out real SQL.
This will introduce concepts such as JOINS, nested queries and WINDOW functions. When you master these, your power to manipulate data will go through the roof.
There are a number of places to start with learning SQL. Try out the interactive examples at w3schools!