

什么时候需要监控
- 当你的应用频繁报错找不到原因的时候。
- 需要分析用户兴趣爱好、购买习惯。
- 需要优化程序的时候,可以做监控收集数据,做针对性的优化。
- 需要保证服务可靠性稳定性。
如果你的应用符合以上任意一条,就可以对应用实行监控了。监控的作用有两个:事前预警和事后分析。
事前预警:提前设置一个阈值,当监控的数据达到阈值时,通过短信或者邮件通知管理员。例如 API 请求数量突然间暴涨,就得进行报警,否则可能会造成服务器宕机。
事后分析:通过监控日志文件,分析故障原因和故障发生点。从而做出修改,防止这种情况再次发生。
本章内容分为前端监控原理分析和如何对项目实行监控两个部分。第一部分有三个小节:数据采集、数据上报、扩展;第二部分只有一个小节:如何使用 sentry 实现项目监控。
好了,下面让我们开始进入正文吧。
数据采集
性能数据采集
性能数据采集需要使用 window.performance API。
Performance 接口可以获取到当前页面中与性能相关的信息,它是 High Resolution Time API 的一部分,同时也融合了 Performance Timeline API、Navigation Timing API、 User Timing API 和 Resource Timing API。
从 MDN 的文档可以看出,window.performance.timing 包含了页面加载各个阶段的起始及结束时间。
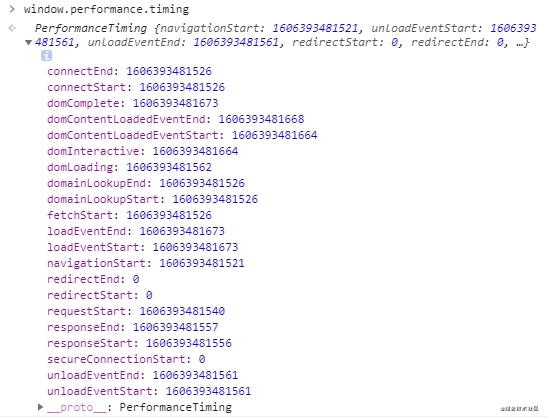
这些属性需要结合下图一起看,更好理解:
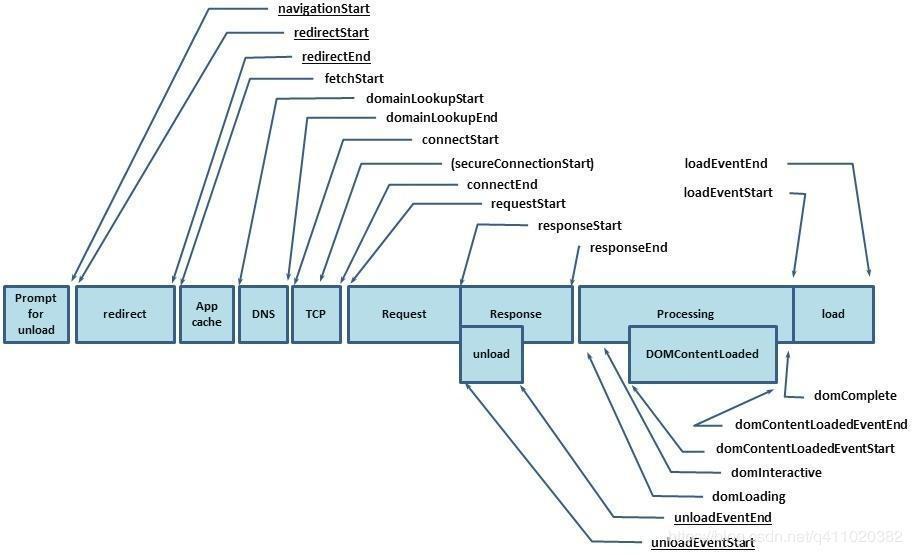
为了方便大家理解 timing 各个属性的意义,我在知乎找到一位网友对于 timing 写的简介,在此转载一下。
timing: {
        // 同一个浏览器上一个页面卸载(unload)结束时的时间戳。如果没有上一个页面,这个值会和fetchStart相同。
	navigationStart: 1543806782096,

	// 上一个页面unload事件抛出时的时间戳。如果没有上一个页面,这个值会返回0。
	unloadEventStart: 1543806782523,

	// 和 unloadEventStart 相对应,unload事件处理完成时的时间戳。如果没有上一个页面,这个值会返回0。
	unloadEventEnd: 1543806782523,

	// 第一个HTTP重定向开始时的时间戳。如果没有重定向,或者重定向中的一个不同源,这个值会返回0。
	redirectStart: 0,

	// 最后一个HTTP重定向完成时(也就是说是HTTP响应的最后一个比特直接被收到的时间)的时间戳。
	// 如果没有重定向,或者重定向中的一个不同源,这个值会返回0.
	redirectEnd: 0,

	// 浏览器准备好使用HTTP请求来获取(fetch)文档的时间戳。这个时间点会在检查任何应用缓存之前。
	fetchStart: 1543806782096,

	// DNS 域名查询开始的UNIX时间戳。
        //如果使用了持续连接(persistent connection),或者这个信息存储到了缓存或者本地资源上,这个值将和fetchStart一致。
	domainLookupStart: 1543806782096,

	// DNS 域名查询完成的时间.
	//如果使用了本地缓存(即无 DNS 查询)或持久连接,则与 fetchStart 值相等
	domainLookupEnd: 1543806782096,

	// HTTP(TCP) 域名查询结束的时间戳。
        //如果使用了持续连接(persistent connection),或者这个信息存储到了缓存或者本地资源上,这个值将和 fetchStart一致。
	connectStart: 1543806782099,

	// HTTP(TCP) 返回浏览器与服务器之间的连接建立时的时间戳。
        // 如果建立的是持久连接,则返回值等同于fetchStart属性的值。连接建立指的是所有握手和认证过程全部结束。
	connectEnd: 1543806782227,

	// HTTPS 返回浏览器与服务器开始安全链接的握手时的时间戳。如果当前网页不要求安全连接,则返回0。
	secureConnectionStart: 1543806782162,

	// 返回浏览器向服务器发出HTTP请求时(或开始读取本地缓存时)的时间戳。
	requestStart: 1543806782241,

	// 返回浏览器从服务器收到(或从本地缓存读取)第一个字节时的时间戳。
        //如果传输层在开始请求之后失败并且连接被重开,该属性将会被数制成新的请求的相对应的发起时间。
	responseStart: 1543806782516,

	// 返回浏览器从服务器收到(或从本地缓存读取,或从本地资源读取)最后一个字节时
        //(如果在此之前HTTP连接已经关闭,则返回关闭时)的时间戳。
	responseEnd: 1543806782537,

	// 当前网页DOM结构开始解析时(即Document.readyState属性变为“loading”、相应的 readystatechange事件触发时)的时间戳。
	domLoading: 1543806782573,

	// 当前网页DOM结构结束解析、开始加载内嵌资源时(即Document.readyState属性变为“interactive”、相应的readystatechange事件触发时)的时间戳。
	domInteractive: 1543806783203,

	// 当解析器发送DOMContentLoaded 事件,即所有需要被执行的脚本已经被解析时的时间戳。
	domContentLoadedEventStart: 1543806783203,

	// 当所有需要立即执行的脚本已经被执行(不论执行顺序)时的时间戳。
	domContentLoadedEventEnd: 1543806783216,

	// 当前文档解析完成,即Document.readyState 变为 'complete'且相对应的readystatechange 被触发时的时间戳
	domComplete: 1543806783796,

	// load事件被发送时的时间戳。如果这个事件还未被发送,它的值将会是0。
	loadEventStart: 1543806783796,

	// 当load事件结束,即加载事件完成时的时间戳。如果这个事件还未被发送,或者尚未完成,它的值将会是0.
	loadEventEnd: 1543806783802
}
通过以上数据,我们可以得到几个有用的时间:
// 重定向耗时
redirect: timing.redirectEnd - timing.redirectStart,
// DOM 渲染耗时
dom: timing.domComplete - timing.domLoading,
// 页面加载耗时
load: timing.loadEventEnd - timing.navigationStart,
// 页面卸载耗时
unload: timing.unloadEventEnd - timing.unloadEventStart,
// 请求耗时
request: timing.responseEnd - timing.requestStart,
// 获取性能信息时当前时间
time: new Date().getTime(),
还有一个比较重要的时间就是白屏时间,它指从输入网址,到页面开始显示内容的时间。
将以下脚本放在 </head> 前面就能获取白屏时间。
<script>
    whiteScreen = new Date() - performance.timing.navigationStart
    // 通过 domLoading 和 navigationStart 也可以
    whiteScreen = performance.timing.domLoading - performance.timing.navigationStart
</script>
通过这几个时间,就可以得知页面首屏加载性能如何了。
另外,通过 window.performance.getEntriesByType('resource') 这个方法,我们还可以获取相关资源(js、css、img...)的加载时间,它会返回页面当前所加载的所有资源。
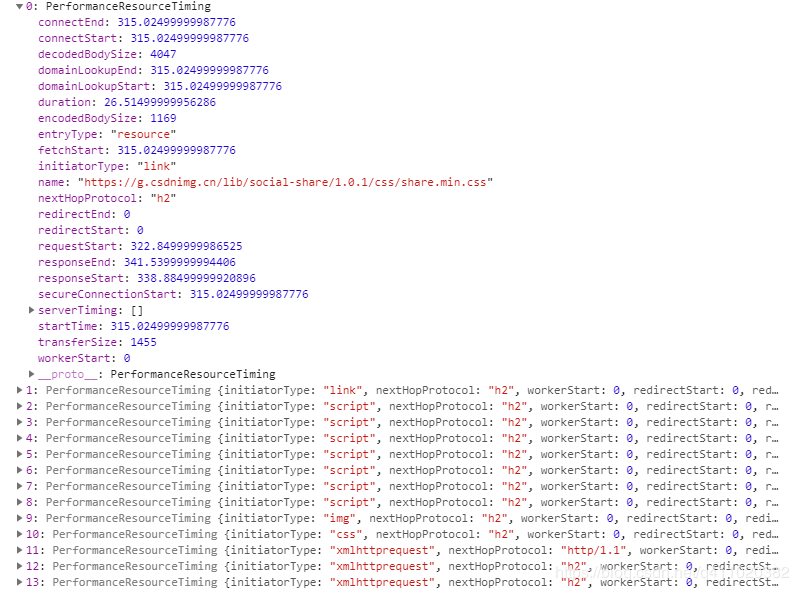
它一般包括以下几个类型:
- sciprt
- link
- img
- css
- fetch
- other
- xmlhttprequest
我们只需用到以下几个信息:
// 资源的名称
name: item.name,
// 资源加载耗时
duration: item.duration.toFixed(2),
// 资源大小
size: item.transferSize,
// 资源所用协议
protocol: item.nextHopProtocol,
现在,写几行代码来收集这些数据。
// 收集性能信息
const getPerformance = () => {
    if (!window.performance) return
    const timing = window.performance.timing
    const performance = {
        // 重定向耗时
        redirect: timing.redirectEnd - timing.redirectStart,
        // 白屏时间
        whiteScreen: whiteScreen,
        // DOM 渲染耗时
        dom: timing.domComplete - timing.domLoading,
        // 页面加载耗时
        load: timing.loadEventEnd - timing.navigationStart,
        // 页面卸载耗时
        unload: timing.unloadEventEnd - timing.unloadEventStart,
        // 请求耗时
        request: timing.responseEnd - timing.requestStart,
        // 获取性能信息时当前时间
        time: new Date().getTime(),
    }

    return performance
}

// 获取资源信息
const getResources = () => {
    if (!window.performance) return
    const data = window.performance.getEntriesByType('resource')
    const resource = {
        xmlhttprequest: [],
        css: [],
        other: [],
        script: [],
        img: [],
        link: [],
        fetch: [],
        // 获取资源信息时当前时间
        time: new Date().getTime(),
    }

    data.forEach(item => {
        const arry = resource[item.initiatorType]
        arry && arry.push({
            // 资源的名称
            name: item.name,
            // 资源加载耗时
            duration: item.duration.toFixed(2),
            // 资源大小
            size: item.transferSize,
            // 资源所用协议
            protocol: item.nextHopProtocol,
        })
    })

    return resource
}
小结
通过对性能及资源信息的解读,我们可以判断出页面加载慢有以下几个原因:
- 资源过多、过大
- 网速过慢
- DOM 元素过多
除了用户网速过慢,我们没办法之外,其他两个原因都是有办法解决的,关于如何做性能优化我们将在下一章学习。
PS:其实页面加载慢还有其他原因,例如没有使用按需加载、没有使用 CDN 等等。不过在这里我们强调的是仅通过对性能和资源信息的解读来得知原因。
错误数据采集
目前所能捕捉的错误有三种:
- 资源加载错误,通过
addEventListener('error', callback, true)在捕获阶段捕捉资源加载失败错误。 - js 执行错误,通过
window.onerror捕捉 js 错误。 - promise 错误,通过
addEventListener('unhandledrejection', callback)捕捉 promise 错误,但是没有发生错误的行数,列数等信息,只能手动抛出相关错误信息。
我们可以建一个错误数组变量 errors 在错误发生时,将错误的相关信息添加到数组,然后在某个阶段统一上报,具体如何操作请看下面的代码:
// 捕获资源加载失败错误 js css img...
addEventListener('error', e => {
    const target = e.target
    if (target != window) {
        monitor.errors.push({
            type: target.localName,
            url: target.src || target.href,
            msg: (target.src || target.href) + ' is load error',
            // 错误发生的时间
            time: new Date().getTime(),
        })
    }
}, true)

// 监听 js 错误
window.onerror = function(msg, url, row, col, error) {
    monitor.errors.push({
        type: 'javascript',
        row: row,
        col: col,
        msg: error && error.stack? error.stack : msg,
        url: url,
        // 错误发生的时间
        time: new Date().getTime(),
    })
}

// 监听 promise 错误 缺点是获取不到行数数据
addEventListener('unhandledrejection', e => {
    monitor.errors.push({
        type: 'promise',
        msg: (e.reason && e.reason.msg) || e.reason || '',
        // 错误发生的时间
        time: new Date().getTime(),
    })
})
小结
通过错误收集,可以了解到网站发生错误的类型及数量,从而做出相应的调整,以减少错误发生。
数据上报
性能数据上报
性能数据可以在页面加载完之后上报,尽量不要对页面性能造成影响。
window.onload = () => {
    // 在浏览器空闲时间获取性能及资源信息
    // https://developer.mozilla.org/zh-CN/docs/Web/API/Window/requestIdleCallback
    if (window.requestIdleCallback) {
        window.requestIdleCallback(() => {
            monitor.performance = getPerformance()
            monitor.resources = getResources()
        })
    } else {
        setTimeout(() => {
            monitor.performance = getPerformance()
            monitor.resources = getResources()
        }, 0)
    }
}
当然,你也可以设一个定时器,循环上报。不过每次上报最好做一下对比去重再上报,避免同样的数据重复上报。
错误数据上报
我在 DEMO(在小节末尾) 里提供的代码,是用一个 errors 数组收集所有的错误,再在某一阶段统一上报(延时上报)。
其实,也可以改成在错误发生时上报(即时上报)。这样可以避免“收集完错误,但延时上报还没触发,用户却已经关掉网页导致错误数据丢失”的问题。
// 监听 js 错误
window.onerror = function(msg, url, row, col, error) {
    const data = {
        type: 'javascript',
        row: row,
        col: col,
        msg: error && error.stack? error.stack : msg,
        url: url,
        // 错误发生的时间
        time: new Date().getTime(),
    }

    // 即时上报
    axios.post({ url: 'xxx', data, })
}
另外,还可以使用 navigator.sendBeacon() 来进行上报。
window.addEventListener('unload', logData, false);

function logData() {
    navigator.sendBeacon("/log", analyticsData);
}
它的技术特点是:
使用 sendBeacon() 方法会使用户代理(浏览器)在有机会时异步地向服务器发送数据,同时不会延迟页面的卸载或影响下一导航的载入性能。这就解决了提交分析数据时的所有的问题:数据可靠,传输异步并且不会影响下一页面的加载。
DEMO 代码
<!DOCTYPE html>
<html>
<head>
    <meta charset="UTF-8">
    <meta name="viewport" content="width=device-width, initial-scale=1.0">
    <meta http-equiv="X-UA-Compatible" content="ie=edge">
    <script>
        function monitorInit() {
            const monitor = {
                // 数据上传地址
                url: '',
                // 性能信息
                performance: {},
                // 资源信息
                resources: {},
                // 错误信息
                errors: [],
                // 用户信息
                user: {
                    // 屏幕宽度
                    screen: screen.width,
                    // 屏幕高度
                    height: screen.height,
                    // 浏览器平台
                    platform: navigator.platform,
                    // 浏览器的用户代理信息
                    userAgent: navigator.userAgent,
                    // 浏览器用户界面的语言
                    language: navigator.language,
                },
                // 手动添加错误
                addError(error) {
                    const obj = {}
                    const { type, msg, url, row, col } = error
                    if (type) obj.type = type
                    if (msg) obj.msg = msg
                    if (url) obj.url = url
                    if (row) obj.row = row
                    if (col) obj.col = col
                    obj.time = new Date().getTime()
                    monitor.errors.push(obj)
                },
                // 重置 monitor 对象
                reset() {
                    window.performance && window.performance.clearResourceTimings()
                    monitor.performance = getPerformance()
                    monitor.resources = getResources()
                    monitor.errors = []
                },
                // 清空 error 信息
                clearError() {
                    monitor.errors = []
                },
                // 上传监控数据
                upload() {
                    // 自定义上传
                    // axios.post({
                    //     url: monitor.url,
                    //     data: {
                    //         performance,
                    //         resources,
                    //         errors,
                    //         user,
                    //     }
                    // })
                },
                // 设置数据上传地址
                setURL(url) {
                    monitor.url = url
                },
            }

            // 获取性能信息
            const getPerformance = () => {
                if (!window.performance) return
                const timing = window.performance.timing
                const performance = {
                    // 重定向耗时
                    redirect: timing.redirectEnd - timing.redirectStart,
                    // 白屏时间
                    whiteScreen: whiteScreen,
                    // DOM 渲染耗时
                    dom: timing.domComplete - timing.domLoading,
                    // 页面加载耗时
                    load: timing.loadEventEnd - timing.navigationStart,
                    // 页面卸载耗时
                    unload: timing.unloadEventEnd - timing.unloadEventStart,
                    // 请求耗时
                    request: timing.responseEnd - timing.requestStart,
                    // 获取性能信息时当前时间
                    time: new Date().getTime(),
                }

                return performance
            }

            // 获取资源信息
            const getResources = () => {
                if (!window.performance) return
                const data = window.performance.getEntriesByType('resource')
                const resource = {
                    xmlhttprequest: [],
                    css: [],
                    other: [],
                    script: [],
                    img: [],
                    link: [],
                    fetch: [],
                    // 获取资源信息时当前时间
                    time: new Date().getTime(),
                }

                data.forEach(item => {
                    const arry = resource[item.initiatorType]
                    arry && arry.push({
                        // 资源的名称
                        name: item.name,
                        // 资源加载耗时
                        duration: item.duration.toFixed(2),
                        // 资源大小
                        size: item.transferSize,
                        // 资源所用协议
                        protocol: item.nextHopProtocol,
                    })
                })

                return resource
            }

            window.onload = () => {
                // 在浏览器空闲时间获取性能及资源信息 https://developer.mozilla.org/zh-CN/docs/Web/API/Window/requestIdleCallback
                if (window.requestIdleCallback) {
                    window.requestIdleCallback(() => {
                        monitor.performance = getPerformance()
                        monitor.resources = getResources()
                        console.log('页面性能信息')
                        console.log(monitor.performance)
                        console.log('页面资源信息')
                        console.log(monitor.resources)
                    })
                } else {
                    setTimeout(() => {
                        monitor.performance = getPerformance()
                        monitor.resources = getResources()
                        console.log('页面性能信息')
                        console.log(monitor.performance)
                        console.log('页面资源信息')
                        console.log(monitor.resources)
                    }, 0)
                }
            }

            // 捕获资源加载失败错误 js css img...
            addEventListener('error', e => {
                const target = e.target
                if (target != window) {
                    monitor.errors.push({
                        type: target.localName,
                        url: target.src || target.href,
                        msg: (target.src || target.href) + ' is load error',
                        // 错误发生的时间
                        time: new Date().getTime(),
                    })

                    console.log('所有的错误信息')
                    console.log(monitor.errors)
                }
            }, true)

            // 监听 js 错误
            window.onerror = function(msg, url, row, col, error) {
                monitor.errors.push({
                    type: 'javascript', // 错误类型
                    row: row, // 发生错误时的代码行数
                    col: col, // 发生错误时的代码列数
                    msg: error && error.stack? error.stack : msg, // 错误信息
                    url: url, // 错误文件
                    time: new Date().getTime(), // 错误发生的时间
                })

                console.log('所有的错误信息')
                console.log(monitor.errors)
            }

            // 监听 promise 错误 缺点是获取不到行数数据
            addEventListener('unhandledrejection', e => {
                monitor.errors.push({
                    type: 'promise',
                    msg: (e.reason && e.reason.msg) || e.reason || '',
                    // 错误发生的时间
                    time: new Date().getTime(),
                })

                console.log('所有的错误信息')
                console.log(monitor.errors)
            })

            return monitor
        }

        const monitor = monitorInit()
    </script>
    <link rel="stylesheet" href="test.css">
    <title>Document</title>
</head>
<body>
    <button class="btn1">错误测试按钮1</button>
    <button class="btn2">错误测试按钮2</button>
    <button class="btn3">错误测试按钮3</button>
    <img src="https://avatars3.githubusercontent.com/u/22117876?s=460&v=4" alt="">
    <img src="test.png" alt="">
<script src="192.168.10.15/test.js"></script>
<script>
document.querySelector('.btn1').onclick = () => {
    setTimeout(() => {
        console.log(button)
    }, 0)
}

document.querySelector('.btn2').onclick = () => {
    new Promise((resolve, reject) => {
        reject({
            msg: 'test.js promise is error'
        })
    })
}

document.querySelector('.btn3').onclick = () => {
    throw ('这是一个手动扔出的错误')
}
</script>
</body>
</html>
扩展
SPA
window.performance API 是有缺点的,在 SPA 切换路由时,window.performance.timing 的数据不会更新。 所以我们需要另想办法来统计切换路由到加载完成的时间。 拿 Vue 举例,一个可行的办法就是切换路由时,在路由的全局前置守卫 beforeEach 里获取开始时间,在组件的 mounted 钩子里执行 vm.$nextTick 函数来获取组件的渲染完毕时间。
router.beforeEach((to, from, next) => {
	store.commit('setPageLoadedStartTime', new Date())
})
mounted() {
	this.$nextTick(() => {
		this.$store.commit('setPageLoadedTime', new Date() - this.$store.state.pageLoadedStartTime)
	})
}
除了性能和错误监控,其实我们还可以收集更多的信息。
用户信息收集
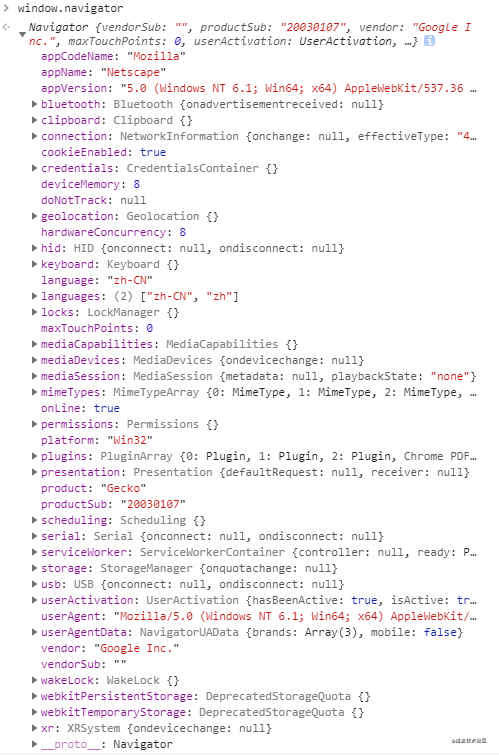
navigator
使用 window.navigator 可以收集到用户的设备信息,操作系统,浏览器信息...
UV(Unique visitor)
是指通过互联网浏览这个网页的访客,00:00-24:00 内相同的设备访问只被计算一次。一天内同个访客多次访问仅计算一个 UV。
在用户访问网站时,可以生成一个随机字符串+时间日期,保存在本地。在网页发生请求时(如果超过当天24小时,则重新生成),把这些参数传到后端,后端利用这些信息生成 UV 统计报告。
PV(Page View)
即页面浏览量或点击量,用户每 1 次对网站中的每个网页访问均被记录 1 个PV。用户对同一页面的多次访问,访问量累计,用以衡量网站用户访问的网页数量。
页面停留时间
传统网站
用户在进入 A 页面时,通过后台请求把用户进入页面的时间捎上。过了 10 分钟,用户进入 B 页面,这时后台可以通过接口捎带的参数可以判断出用户在 A 页面停留了 10 分钟。
SPA
可以利用 router 来获取用户停留时间,拿 Vue 举例,通过 router.beforeEach、destroyed 这两个钩子函数来获取用户停留该路由组件的时间。
浏览深度
通过 document.documentElement.scrollTop 属性以及屏幕高度,可以判断用户是否浏览完网站内容。
页面跳转来源
通过 document.referrer 属性,可以知道用户是从哪个网站跳转而来。
小结
通过分析用户数据,我们可以了解到用户的浏览习惯、爱好等等信息,想想真是恐怖,毫无隐私可言。
前端监控部署
前面说的都是监控原理,但要实现还是得自己动手写代码。为了避免麻烦,我们可以用现有的工具 sentry 去做这件事。
sentry 是一个用 python 写的性能和错误监控工具,你可以使用 sentry 提供的服务(免费功能少),也可以自己部署服务。现在来看一下如何使用 sentry 提供的服务实现监控。
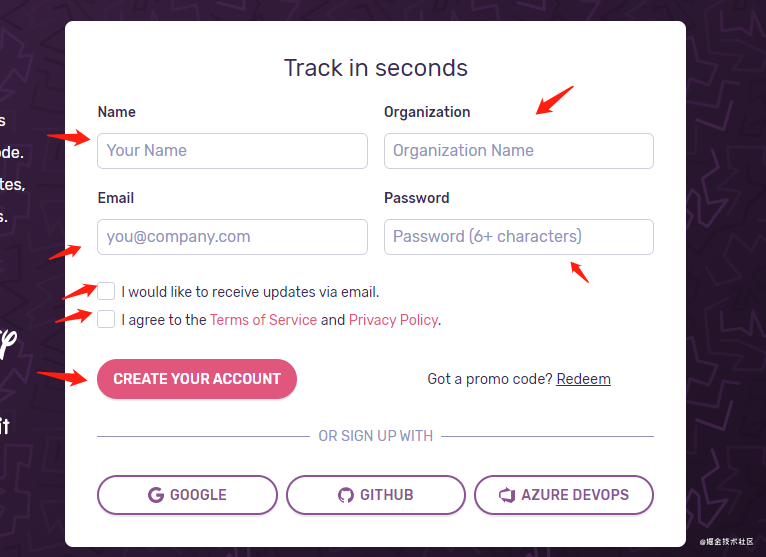
注册账号
打开 https://sentry.io/signup/ 网站,进行注册。
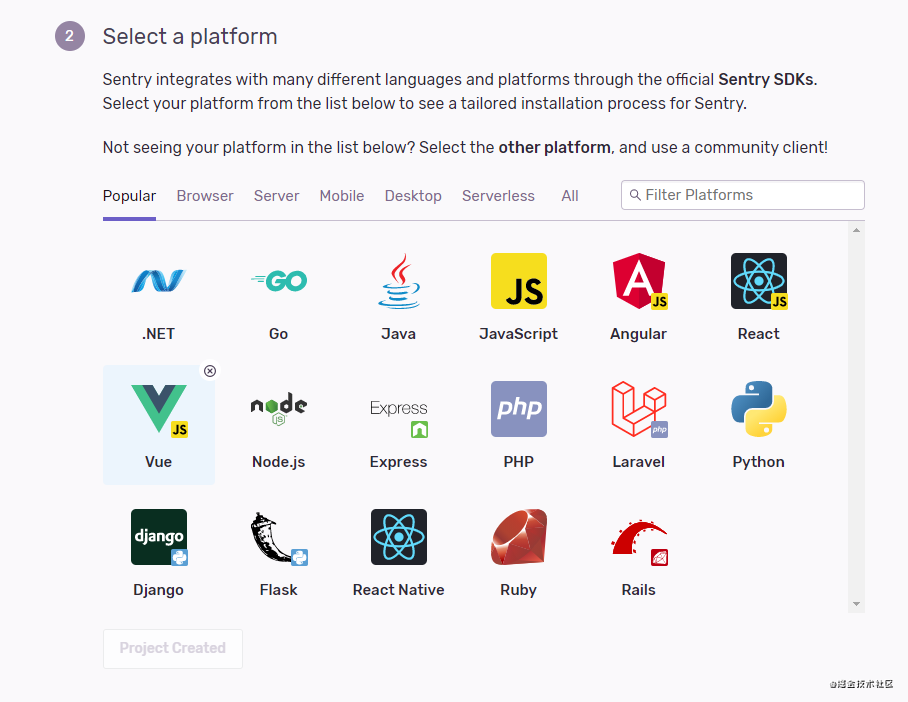
选择项目,这里用 Vue 做示例。
安装 sentry 依赖
选完项目,下面会有具体的 sentry 依赖安装指南。
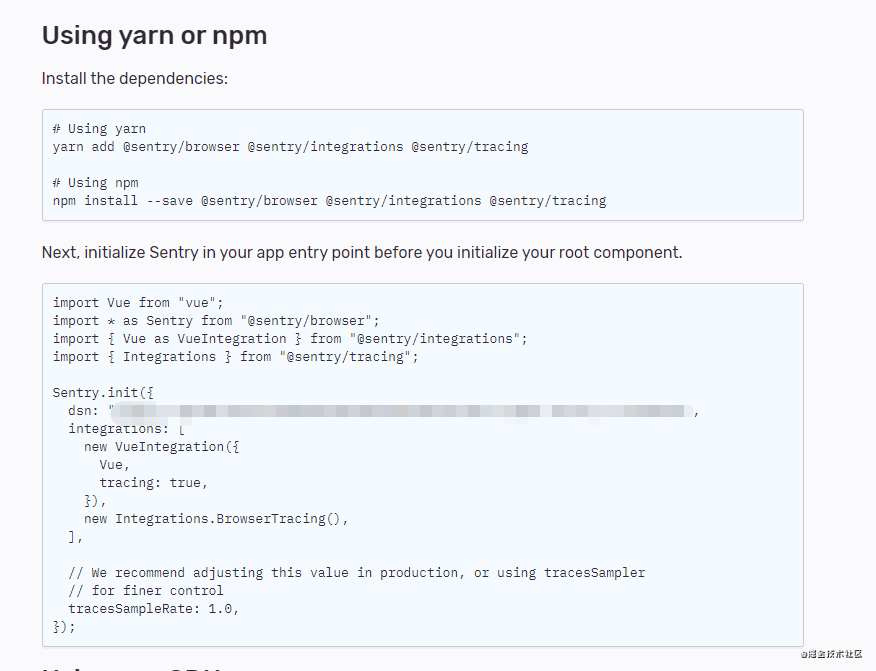
根据提示,在你的 Vue 项目执行这段代码 npm install --save @sentry/browser @sentry/integrations @sentry/tracing,安装 sentry 所需的依赖。
再将下面的代码拷到你的 main.js,放在 new Vue() 之前。
import * as Sentry from "@sentry/browser";
import { Vue as VueIntegration } from "@sentry/integrations";
import { Integrations } from "@sentry/tracing";

Sentry.init({
  dsn: "xxxxx", // 这里是你的 dsn 地址,注册完就有
  integrations: [
    new VueIntegration({
      Vue,
      tracing: true,
    }),
    new Integrations.BrowserTracing(),
  ],

  // We recommend adjusting this value in production, or using tracesSampler
  // for finer control
  tracesSampleRate: 1.0,
});
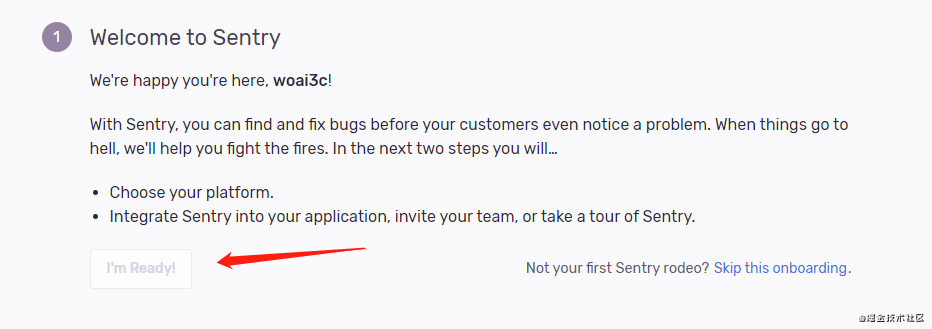
然后点击第一步中的 skip this onboarding,进入控制台页面。
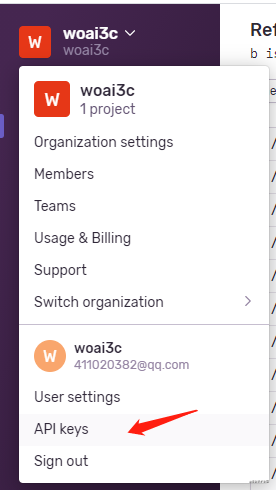
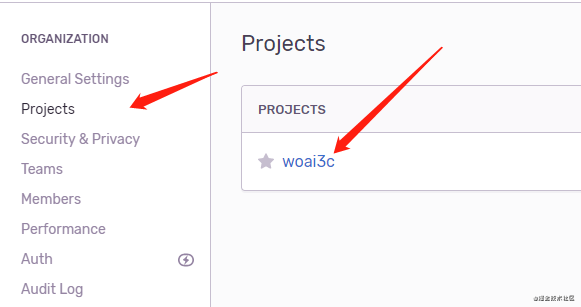
如果忘了自己的 DSN,请点击左边的菜单栏选择 Settings -> Projects -> 点击自己的项目 -> Client Keys(DSN)。
创建第一个错误
在你的 Vue 项目执行一个打印语句 console.log(b)。
这时点开 sentry 主页的 issues 一项,可以发现有一个报错信息 b is not defined:
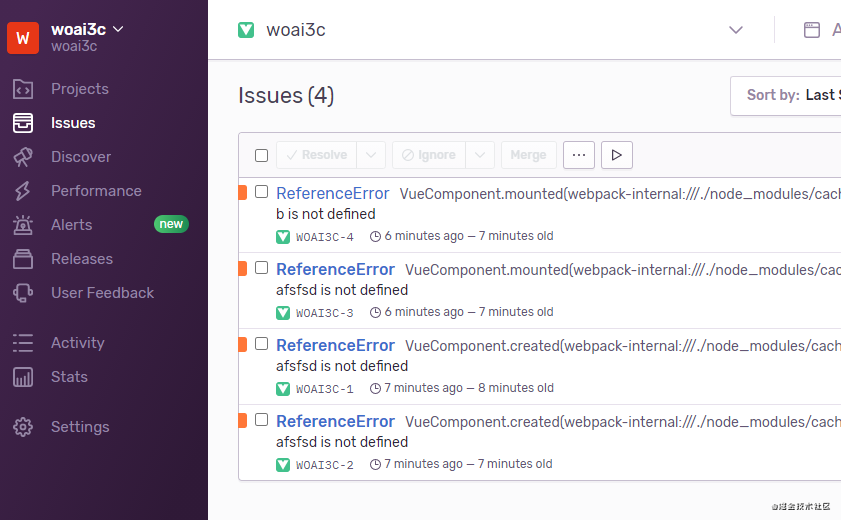
这个报错信息包含了错误的具体信息,还有你的 IP、浏览器信息等等。
但奇怪的是,我们的浏览器控制台并没有输出报错信息。
这是因为被 sentry 屏蔽了,所以我们需要加上一个选项 logErrors: true。
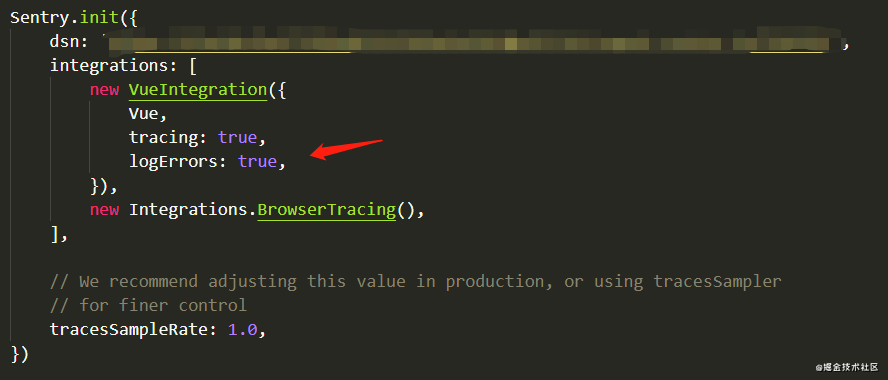
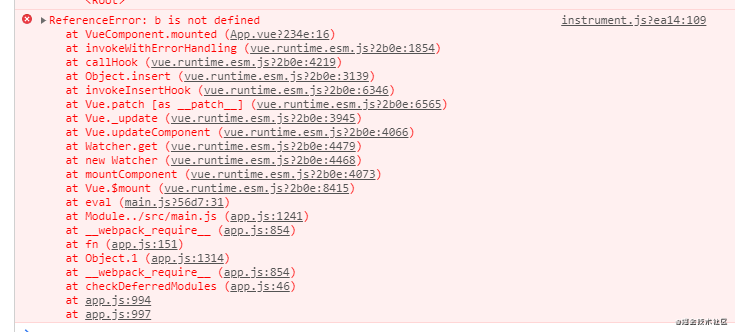
然后再查看页面,发现控制台也有报错信息了:
上传 sourcemap
一般打包后的代码都是经过压缩的,如果没有 sourcemap,即使有报错信息,你也很难根据提示找到对应的源码在哪。
下面来看一下如何上传 sourcemap。
首先创建 auth token。
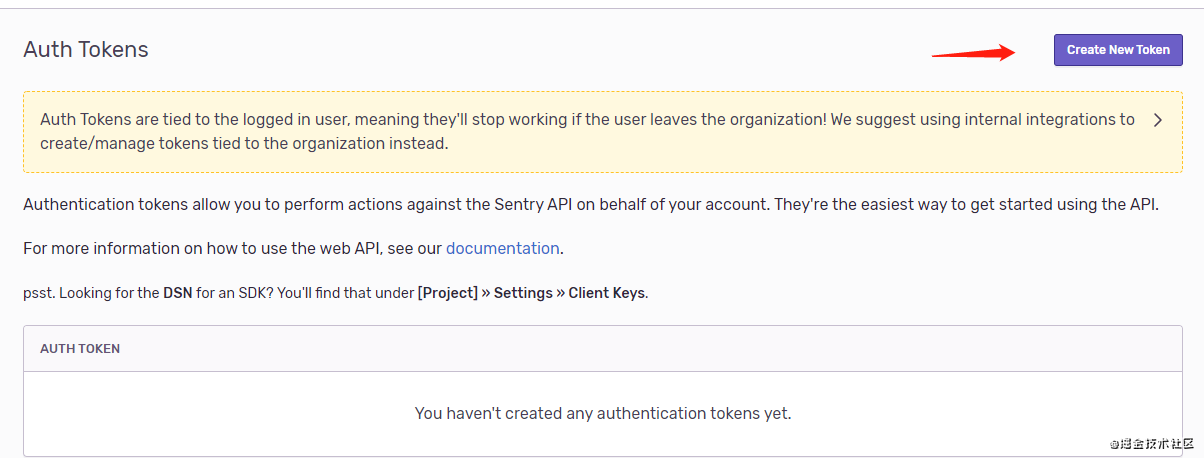
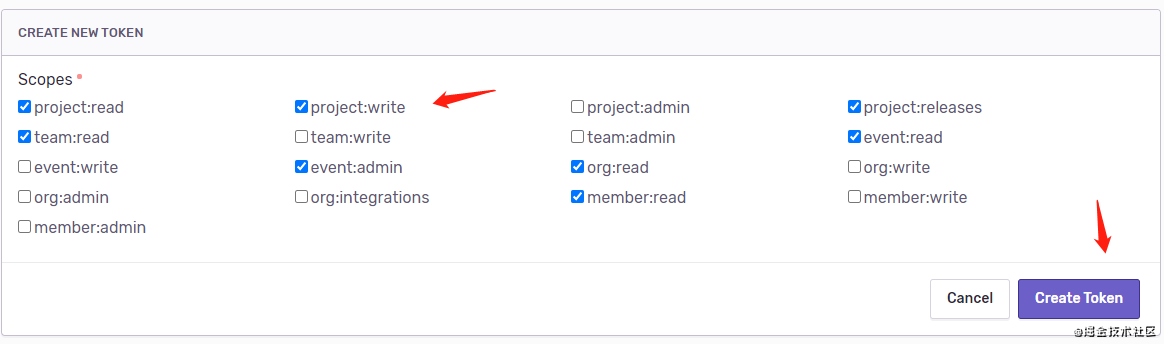
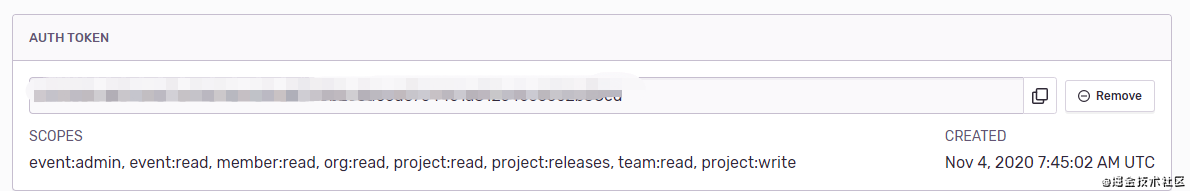
这个生成的 token 一会要用到。
安装 sentry-cli 和 @sentry/webpack-plugin:
npm install sentry-cli-binary -g
npm install --save-dev @sentry/webpack-plugin
安装完上面两个插件后,在项目根目录创建一个 .sentryclirc 文件(不要忘了在 .gitignore 把这个文件添加上,以免暴露 token),内容如下:
[auth]
token=xxx

[defaults]
url=https://sentry.io/
org=woai3c
project=woai3c
把 xxx 替换成刚才生成的 token。
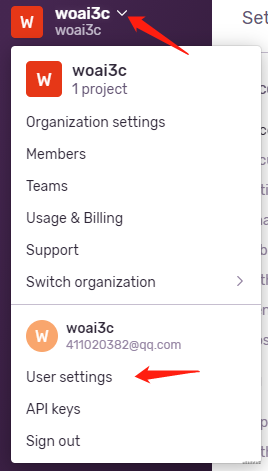
org 是你的组织名称。
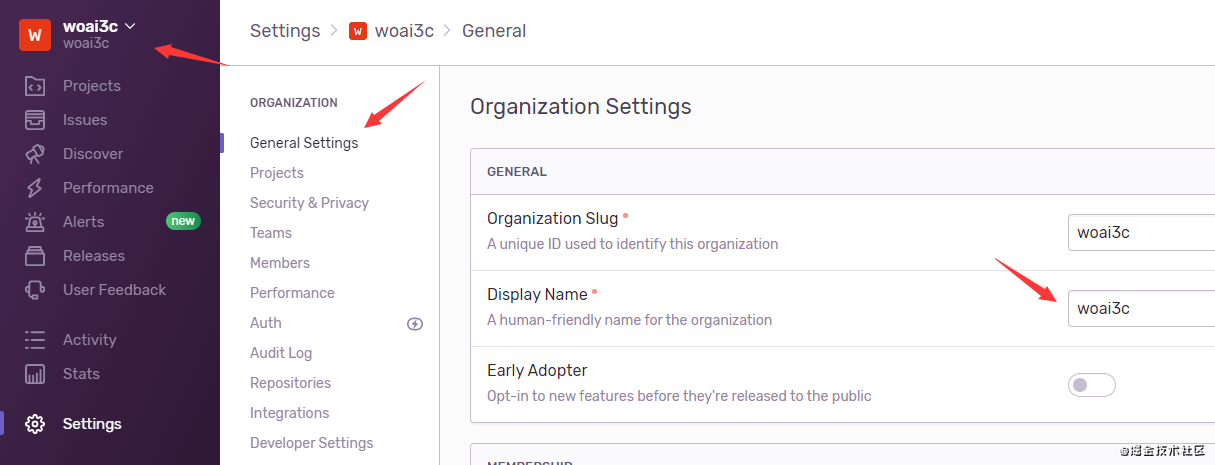
project 是你的项目名称,根据下面的提示可以找到。
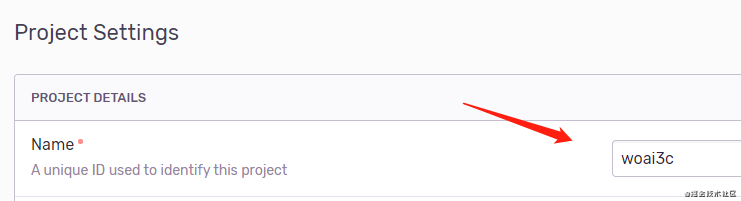
在项目下新建 vue.config.js 文件,把下面的内容填进去:
const SentryWebpackPlugin = require('@sentry/webpack-plugin')

const config = {
    configureWebpack: {
        plugins: [
            new SentryWebpackPlugin({
                include: './dist', // 打包后的目录
                ignore: ['node_modules', 'vue.config.js', 'babel.config.js'],
            }),
        ],
    },
}

// 只在生产环境下上传 sourcemap
module.exports = process.env.NODE_ENV == 'production'? config : {}
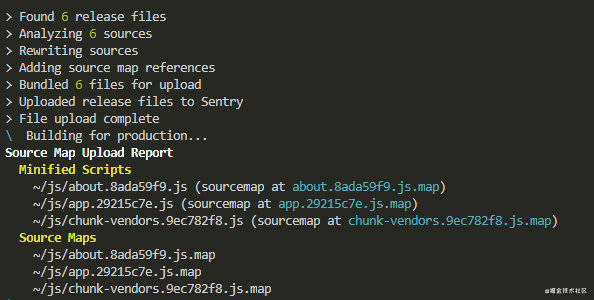
填完以后,执行 npm run build,就可以看到 sourcemap 的上传结果了。
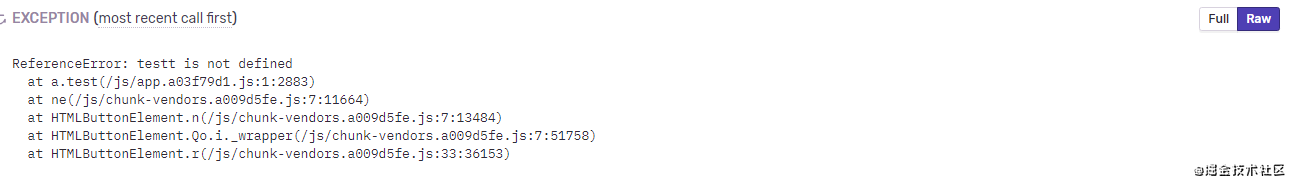
我们再来看一下没上传 sourcemap 和上传之后的报错信息对比。
未上传 sourcemap
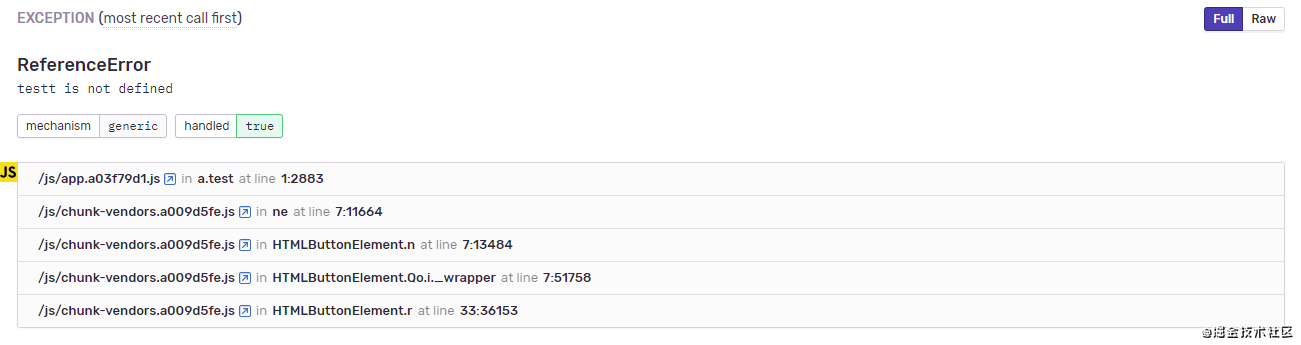
已上传 sourcemap
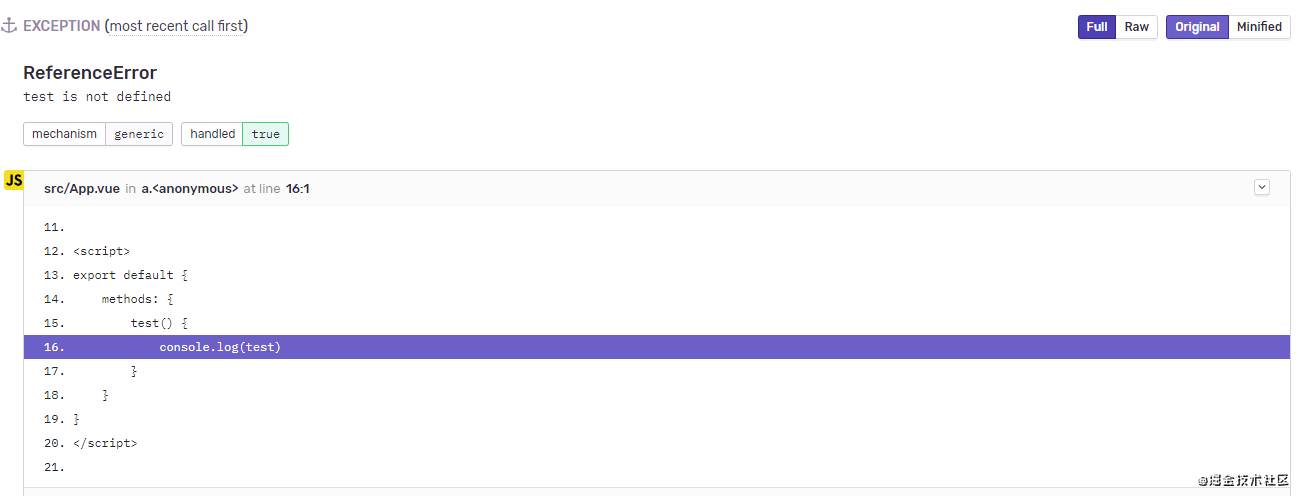
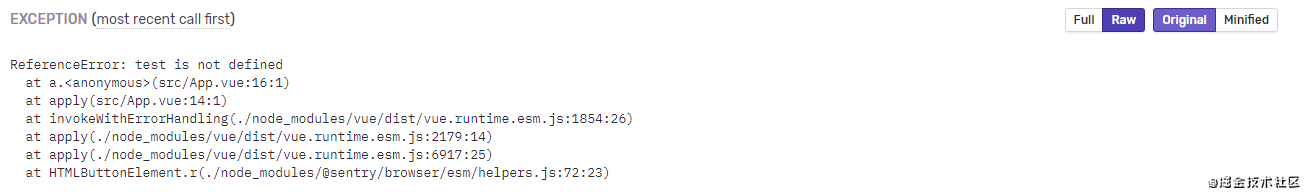
可以看到,上传 sourcemap 后的报错信息更加准确。
切换中文环境和时区
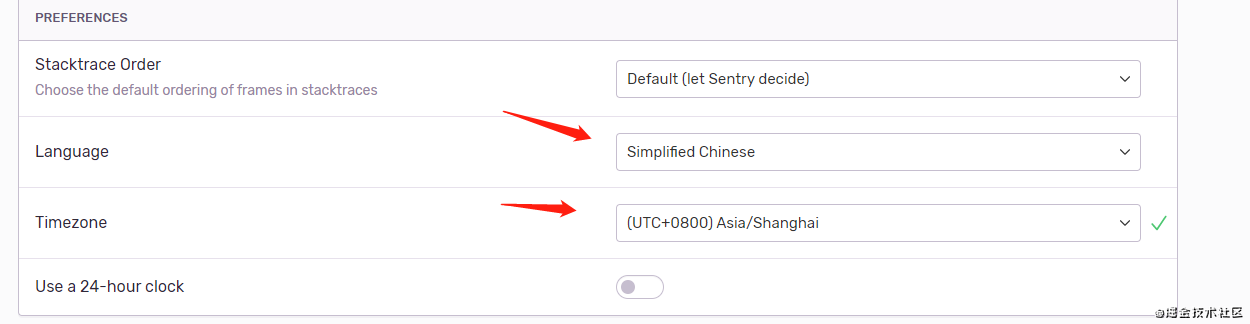
选完刷新即可。
性能监控
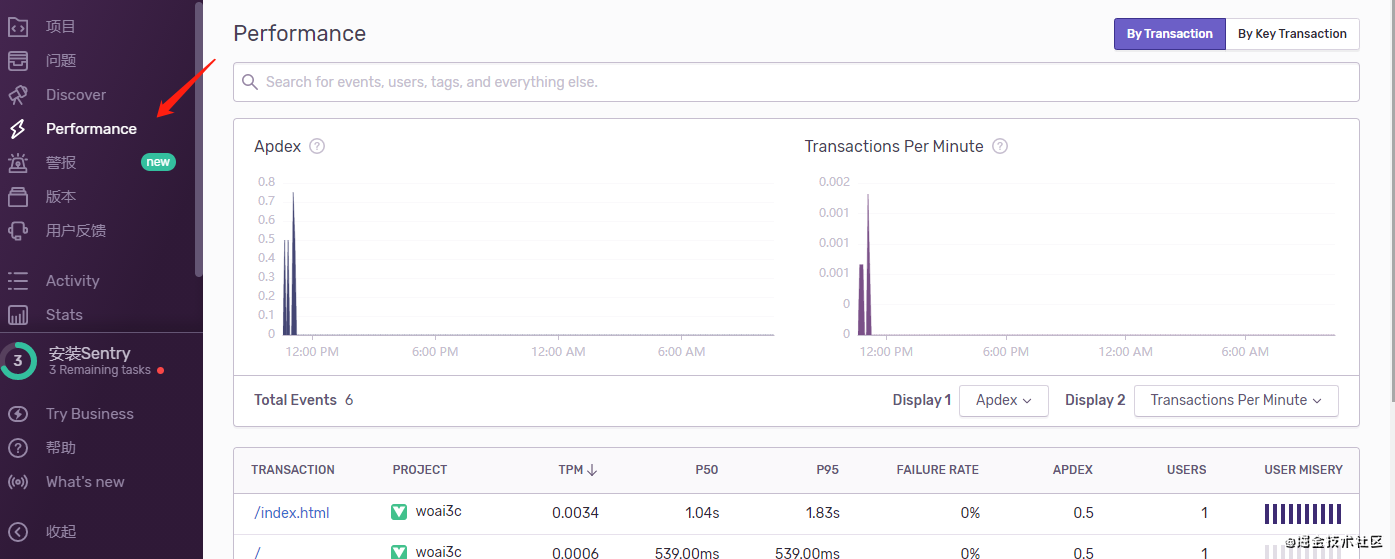
打开 performance 选项,就能看到你每个项目的运行情况。具体的参数解释请看文档 Performance Monitoring。
小结
随着 web 技术的发展,现在前端项目的规模也越来越大。在监控系统的帮助下,我们可以更加清楚的了解项目的运行情况,根据采集到的错误数据和性能数据对项目做针对性的优化。
下一章我们将讲解如何做性能优化。