
By Ingrid Arreola
We are a few months into a global pandemic which has forced many of us to adjust almost every aspect of our lives.
Our daily routines have been turned upside-down and many of us continue to spend more time at home.
This increased time at home offers an opportunity for growth and learning. When the pandemic began, I started to review how I was spending my extra time at home. I tracked this data, established a learning routine, and finally visualized the results.
This article is an overview of how I used the Pomodoro technique to track my learning. In it, we'll break down how to quantify your learning progress, and visualize the results.
Learning how to learn
“Learning is creating a pattern in your brain. The more you practice, the stronger and the more available it will be for you in the future.” — Barbara Oakley
Our brains process information in several ways as we learn new subjects. There are two primary ways that we think: focused mode and diffused mode.
When we first begin to learn something new, we have to focus and concentrate. Diffused mode, on the other hand, allows us to make imaginative connections between ideas. This includes time when we are relaxed and our thoughts travel broadly.
The Pomodoro Technique is a tool that helps us enter focused mode.
 There are two primary ways that we think: via the focused mode and the diffused mode. When we first begin to learn something new we have to focus and concentrate.
What is the Pomodoro Technique?
The Pomodoro technique helps us do focused work by:
- Shutting off all distractions and finding a quiet place to do work.
- Setting a timer for 25 minutes. I have downloaded an app called "Be Focused Pro" which allows me to track this data.
- Focus on the task, or the learning activity.
- Take a break and repeat the process after the 25 minutes are up.
I learned to establish a learning routine with the Pomodoro technique. 25 minutes is tangible and short enough to focus on a desired learning activity.
Learning is an investment, and its value compounds over time. 25 minutes a day may seem short, but multiply that over a week, a month, a year and you will see results.
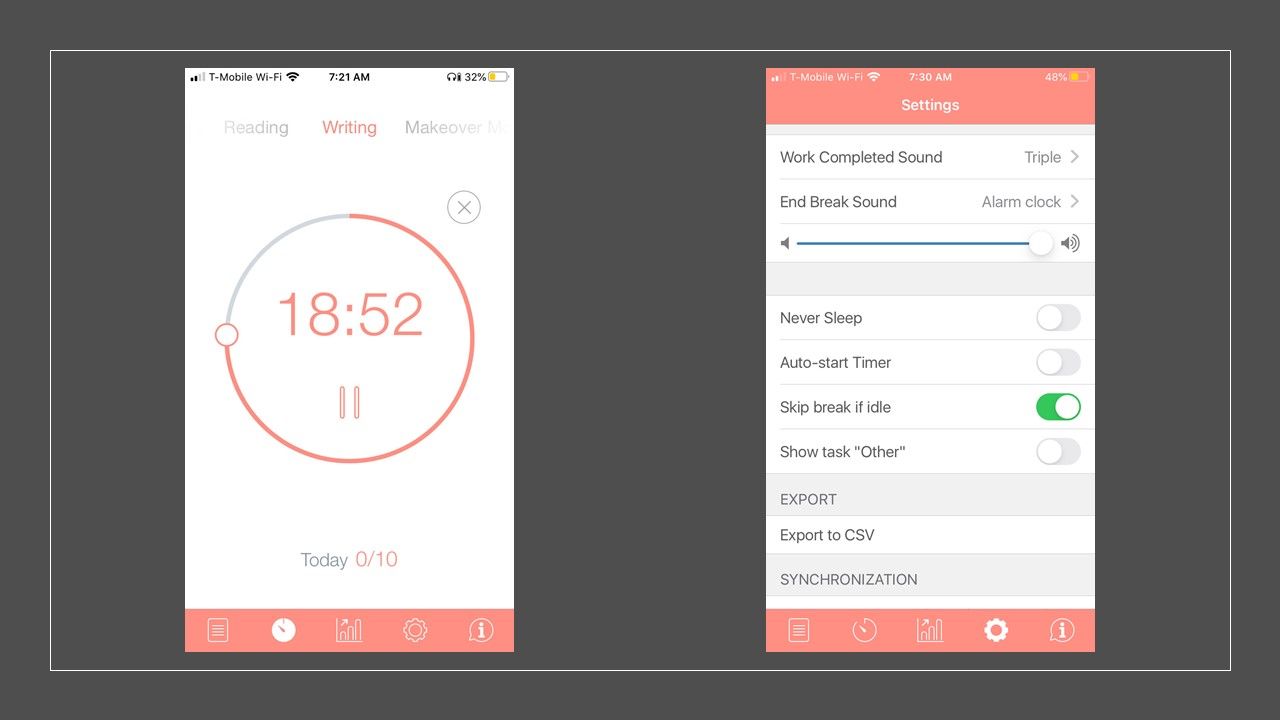 Be Focused Pro App. Start a Pomodoro. It has settings that allow you to export to csv.
Your Learning Goal
Think about what you'd like to learn – what is that topic or language that you're curious about?
After you've established your subject, think about the new skills that you need to acquire. It's important to break down the topic into pieces to achieve your learning goals.
Bringing in the Pomodoro technique
The Pomodoro technique helps you take a step-by-step approach towards new skill acquisition. And here's how.
Think about your learning goal and break it apart into smaller chunks. This exercise will help you space out your learning over several days, weeks, or months. Remember that we all learn at different speeds.
You build a solid foundation as you begin to put in time to learn and practice your new skills. This exercise is also helpful to develop milestones that you can quantify. The Pomodoro Technique helps you quantify that progress and analyze learning patterns.
 Think about your learning goal and break it apart into smaller chunks.
Tools to Track Data
Several apps exist that help you use the Pomodoro Technque. As I mentioned, I have downloaded the "Be Focused Pro" app. The greatest benefits are that you can enter a name for your task, create tags and notes, and add a "due date."
This data helps you understand the amount of time spent completing a project or goal. You can download a csv of your data, which includes a time stamp, the name of the activity, the duration of your pomodoro task, and metadata.
There is a new row of data created every time that you complete a Pomodoro. The app has analytics such as the amount of Pomodoro's completed in a day, a week, or a custom date field.
The ability to download a csv is a great feature because you can transform your own data. This allows you to create a data set that best suits your purposes. You can understand your learning patterns, track progress, and visualize the various components.
After you have completed a few Pomodoro's you can export the data as a csv. This file will serve as the foundation and includes:
- Start Date: timestamp of when you started
- Duration: amount of time for the Pomodoro, the default is 25 minutes
- Assigned Task: the name of the activity
- Task State: indicates whether the activity is completed or if it is ongoing
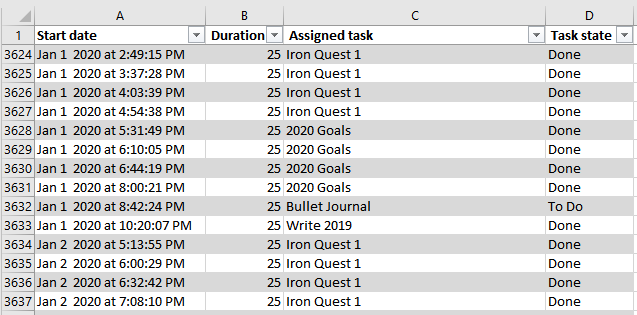 The data export from the app Be Focused Pro.
Introspection
Before you begin to clean up and transform this data, take a step back and ask yourself a few questions.
- What am I most interested in understanding about this data?
- Do I want to understand how long it takes me to complete a learning goal?
- Am I interested in the length of time required to complete the various phases of my goals?
- Am I more interested in seeing the progress of my various goals?
- Do I want to build something that serves more as motivation? Should I focus on what I've accomplished and the goals I am working towards?
- What time frame do I want to focus on and how much granularity do I need? Minutes, months, or days?
- Do I want to look at the time of day that I do the most Pomodoro activities? Will this knowledge help me organize my schedule so that I can focus during my productive hours?
 Before you begin to clean up and transform this data, take a step back and ask questions.
The answer to your questions will guide the data transformation and clean-up. These questions help identify gaps in your current data structure. I wanted to explore the following:
- How has the pandemic impacted my learning?
- What day(s) or hour(s) am I most productive in?
- What general activities consume most of my learning time?
- How can I track progress for my various courses on Pluralsight, Data Camp, and other learning platforms?
Data Transformation
Data Cleanup
After completing the exercise I spent time cleaning the data in the csv. I focused on the time stamp and created new columns of data, which included:
- Month
- Day
- Year
- Minutes
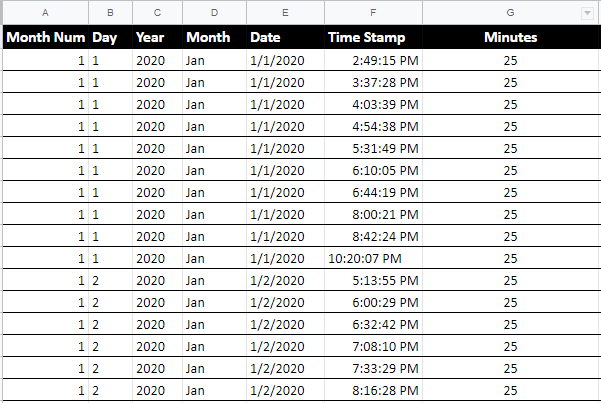 Date Cleanup
New Data Created
I created new columns of data that served as categories for my learning activities. I wanted to collect information such as the "Type" to separate the various "Assigned Tasks."
I also created a "Learning Platform" column to distinguish the course websites. I wanted granularity with these courses. The creation of the "Learning Skill" column specified the skill(s). "Course Title" referred to the name of the course, or the title of a project.
The new categories included:
- Type
- Learning Platform
- Learning Skill
- Course Title
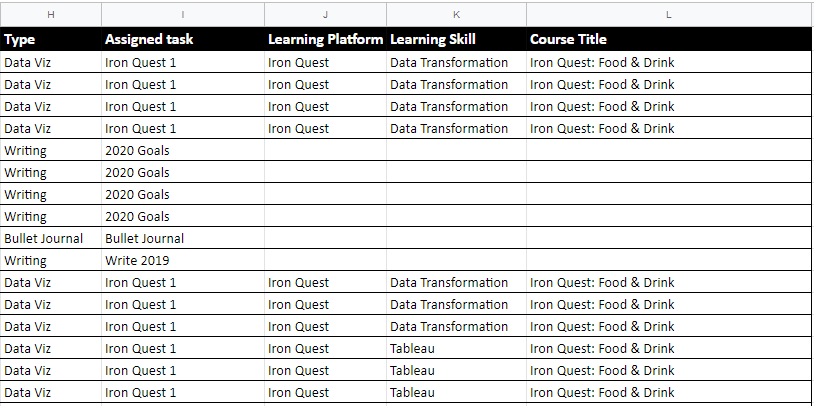 New columns created included: type, assigned task, learning platform, learning skill, and course title
Data for Waffle Chart Visualization
The final data piece is optional and I used it to create my desired visual component within Tableau.
The Tableau community shares tips and tools, and I downloaded the waffle chart spreadsheet from Andy Kriebel's website. I did add a column to Andy's sheet so that my data set would translate appropriately.
The "minutes" columns helps visualize the progress percentage. This final piece is a spreadsheet that has several data fields including:
- Row
- Column
- Progress
- Minutes
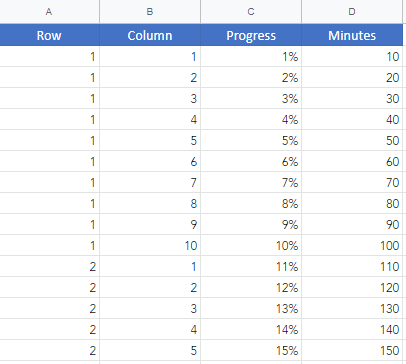 "Waffle Chart" spreadsheet that creates the visualization in Tableau
Data Import
You are ready to import the data once the various pieces are transformed. I created two Google spreadsheets so that I could continue adding data over time and easily refresh on Tableau.
The google spreadsheets include:
- 2020 Pomodoro: data from the initial csv as well as the columns created:
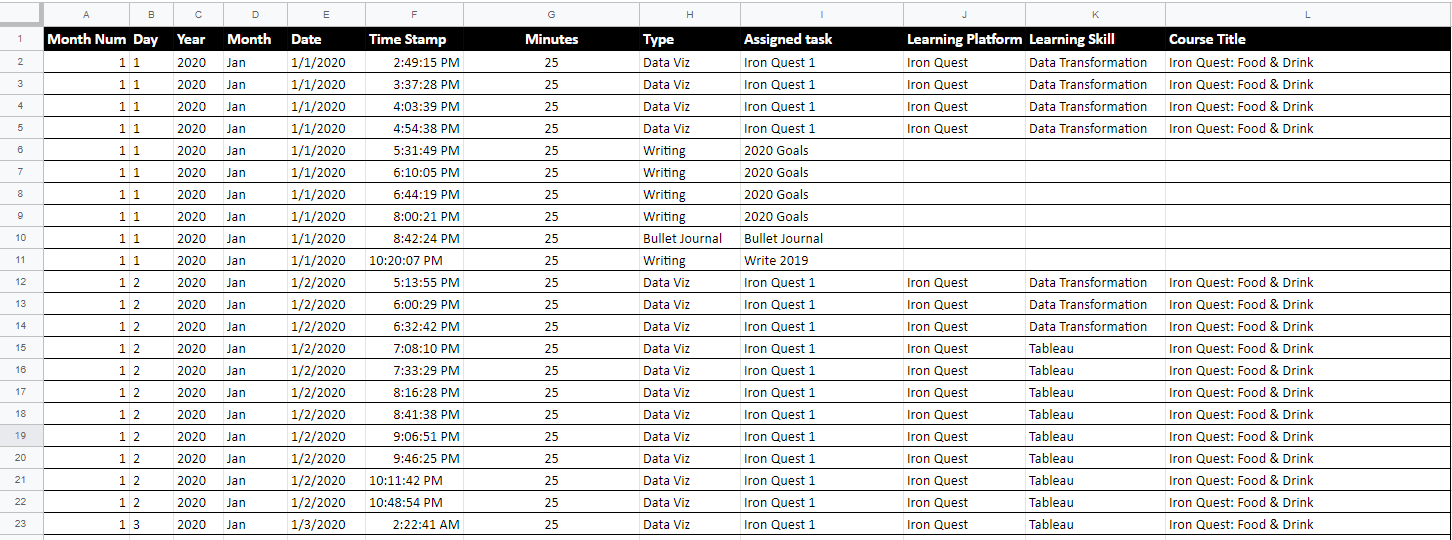 2020 Pomodoro - Google Spreadsheet
- 2020 Focused Mode Waffle Chart: data specific for the creation of a waffle chart in Tableau:
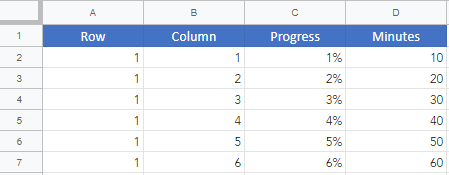 2020 Focused Mode Waffle Chart - Google Spreadsheet
Visualization
Take a step back and revisit your questions from the introspection exercise. The answer to your questions help the data transformation and clean-up.
These questions will also help guide your data exploration. The main themes of my questions included:
- How had my learning changed over time?
- At what time am I most productive and learning?
- What is the progress of my courses and projects?
As I began exploring data visualizations, I focused on these three themes:
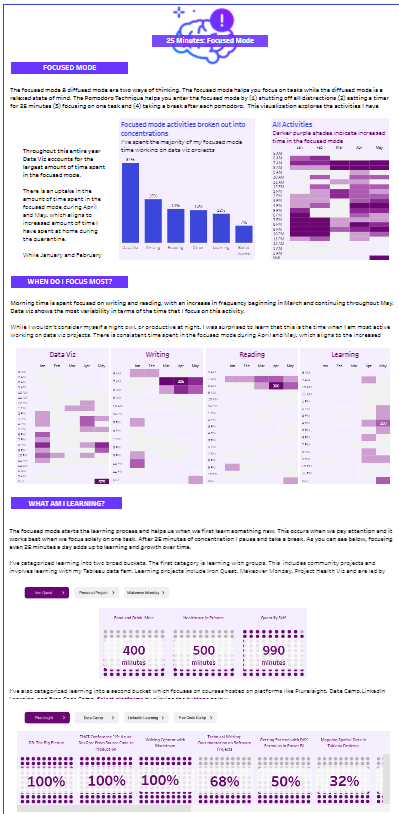
- Patterns Across Months
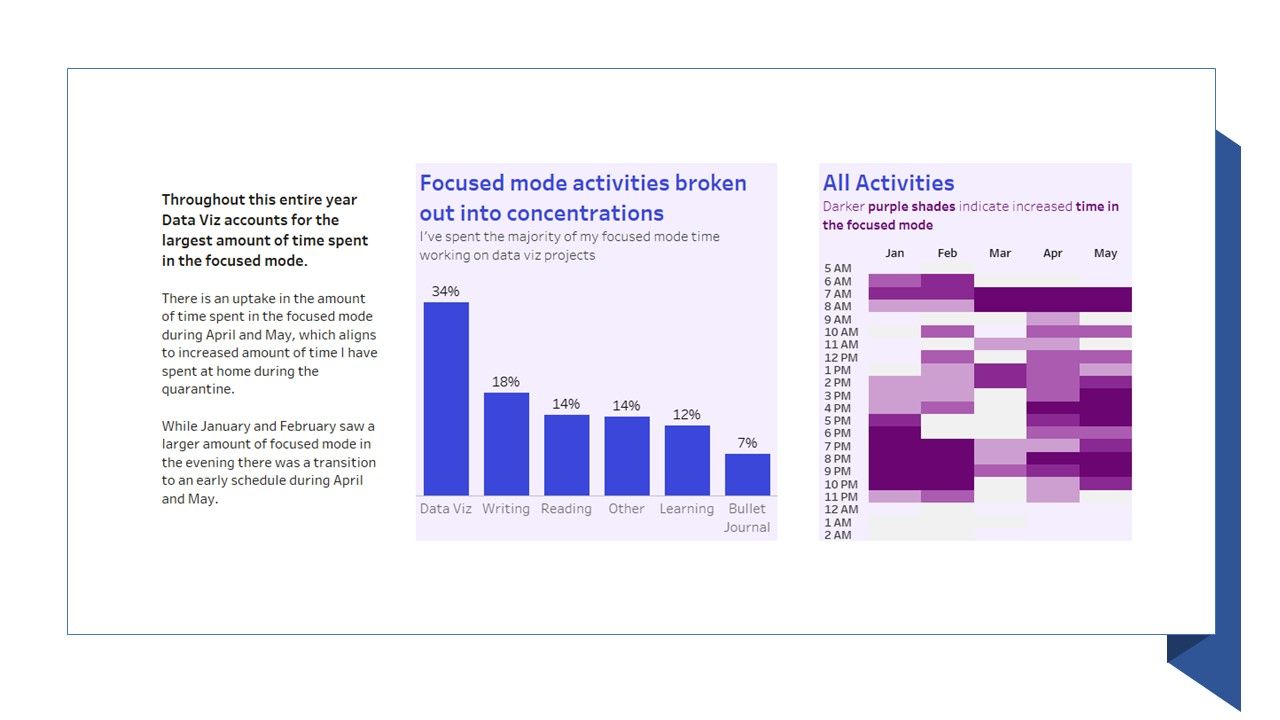 Visualization breaking down the pattern across months
- Patterns Across Days/Hours
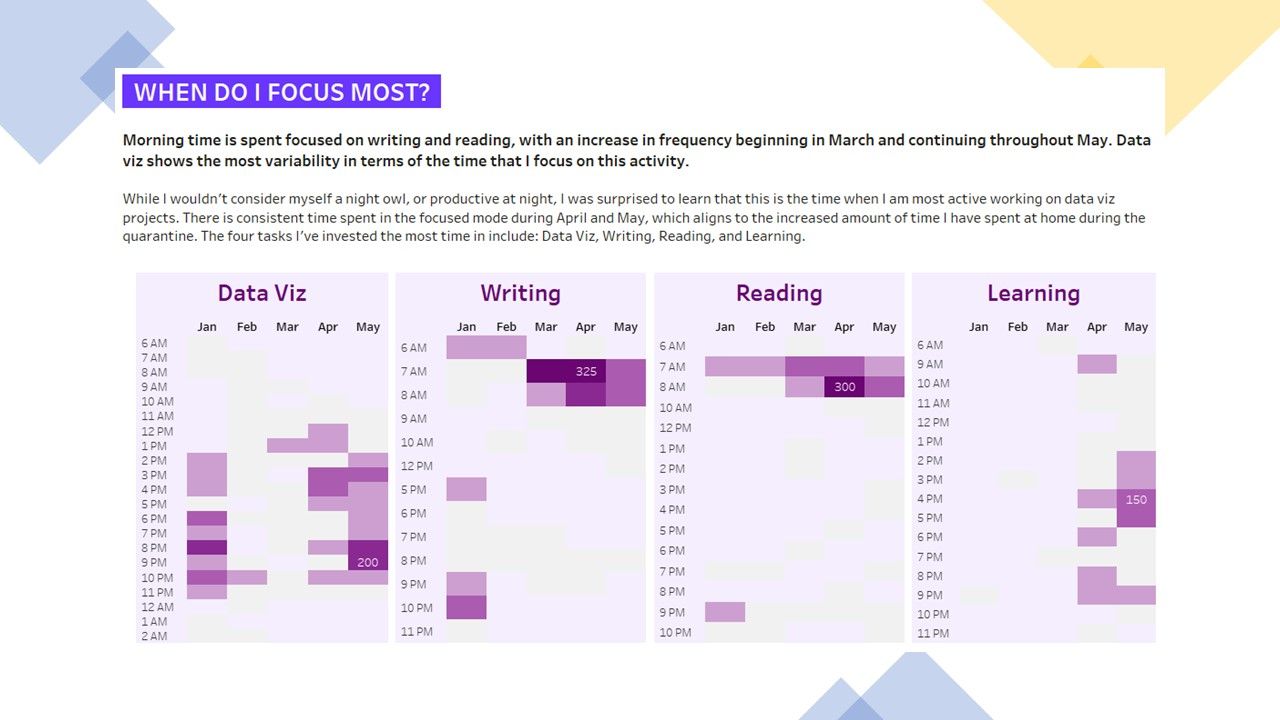
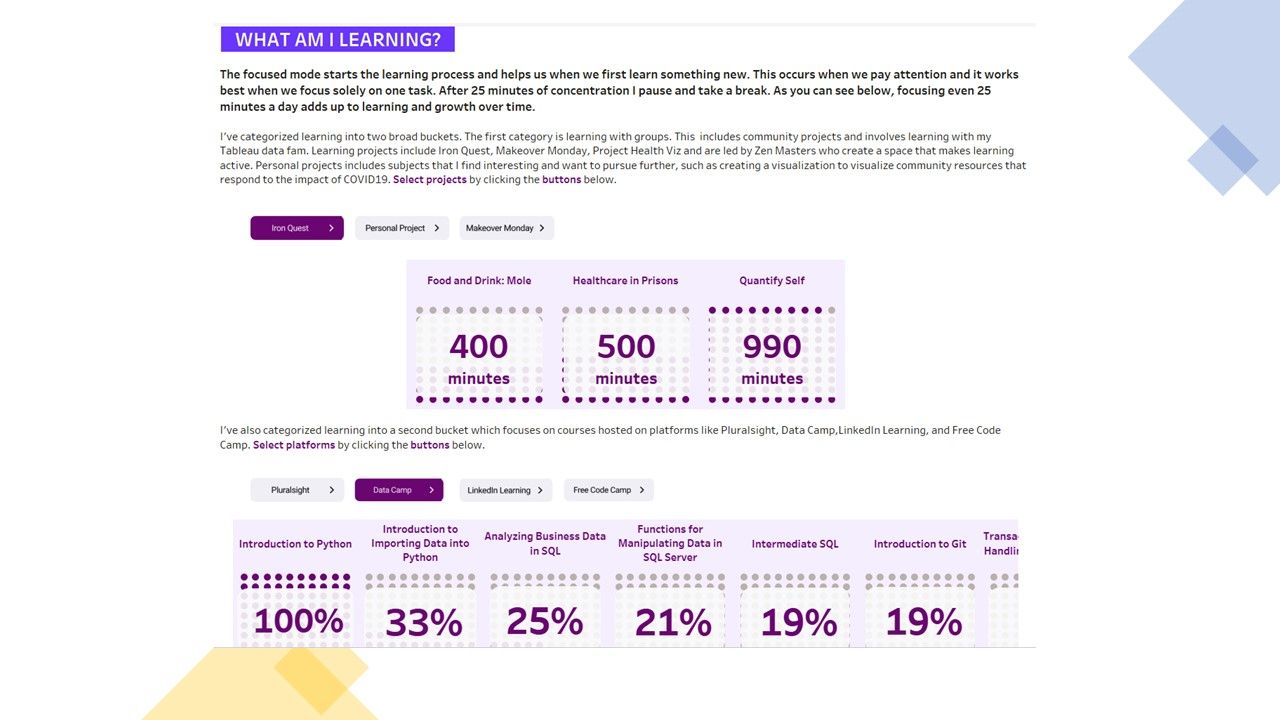
- Learning Progress
Play around with several chart and graph types until you find the form that best suits your purpose. The final step is to bring all the pieces together into one cohesive structure.
I finished by creating a dashboard in Tableau. First I took a broad look at the Pomodoro Activity Types. Next, I viewed how it has changed over time and examined these patterns across days/hours.
The bottom portion focuses on progress. I wanted an easy way to scroll through the status of the various courses/projects I am working on. You can explore the dashboard on Tableau Public here.
Just get it done
25 minutes a day of learning leads to positive change and growth over time. The effectiveness of the Pomodoro method compounds and helps build knowledge, experience, and new skills.
Each time that you focus and do a Pomodoro activity you are learning and can begin to build powerful habits.
Next monitor your growth and learn about the patterns, so that you become a better learner. What will you focus on and where will the learning lead you? What will you learn? What will you build?
Finally, share your work, along with any lessons learned.
"Make it a habit. Figure out when and where you're most comfortable doing deliberate practice. One you've made your selection, do deliberate practice then and there every day. Why? Because routines are a godsend when it comes to doing something hard. A mountain of research studies show that when you have a habit of practicing at the same time and in the same place every day, you hardly have to think abut getting started. You just do." - Angela Duckworth
If you're interested in getting started, these resources can help you:
- Ingrid's 2020 Pomodoro Google Sheet: this is a skeleton of the spreadsheet I used for this project.
- Be Focused Pro App: this is a link to the app I use on a daily basis. The instructions covered in this article are applicable to this particular app. There are many more apps out there as well.
- Learning To Learn by Barabra Oakley, Alistair McConville, and Terrence Sejnowski is a great book that teaches you the science behind learning. The Coursera course "Learning How to Learn" is available for free.