
Traditional browser developer tools are designed to inspect and debug web pages by interacting with your HTML, CSS, and JavaScript code. However, you can't use them to inspect and debug React applications efficiently due to the nature of React.
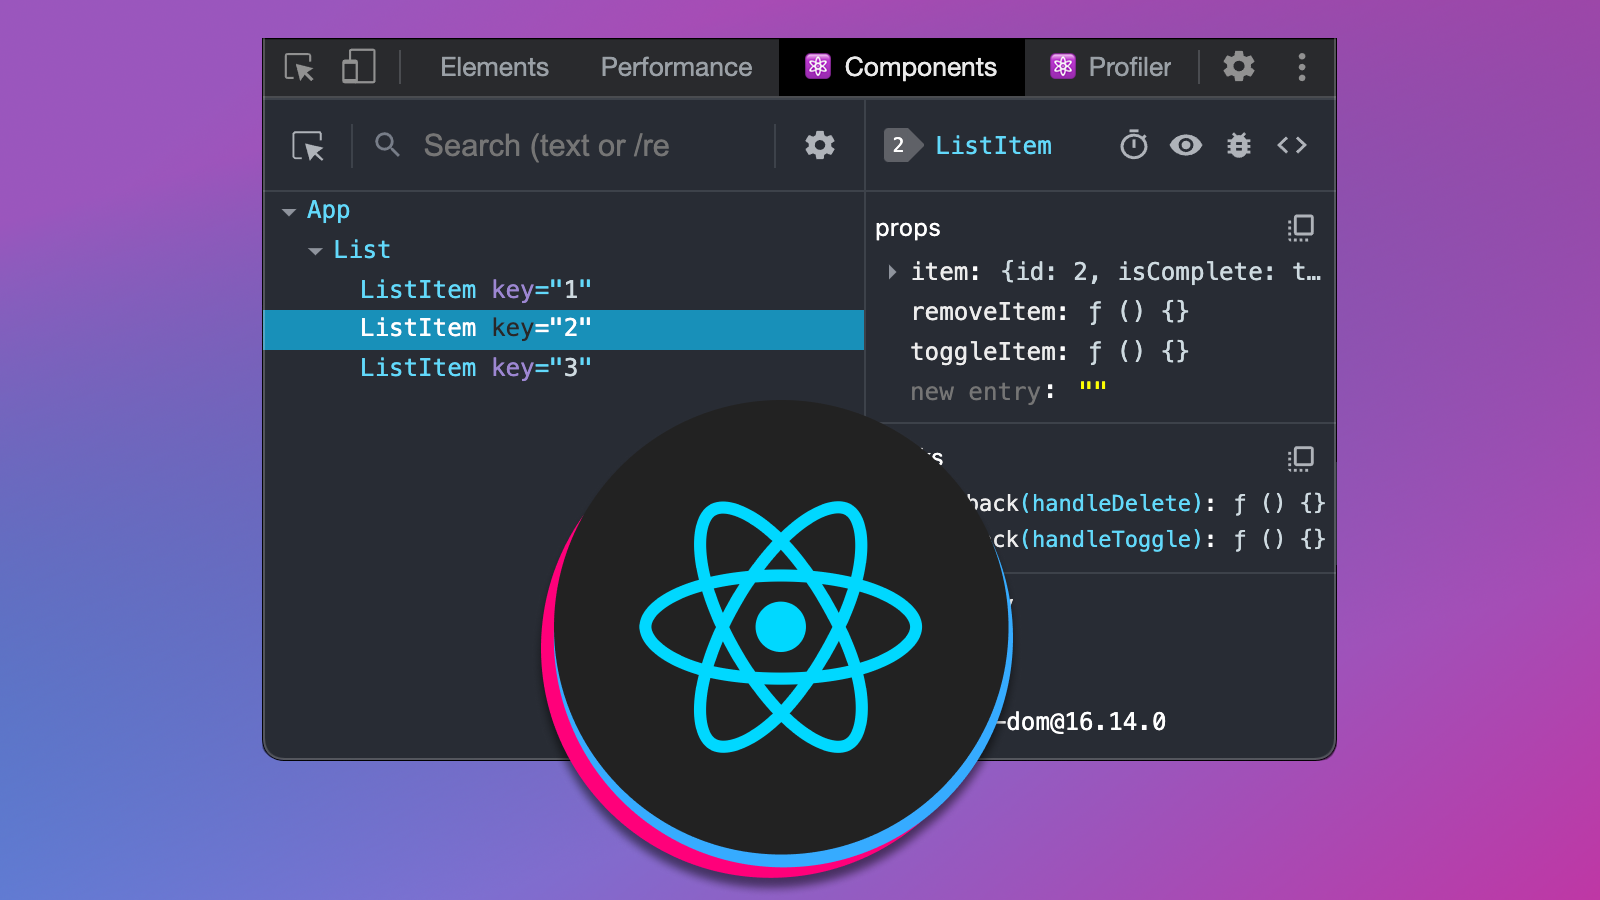
This is where the React Developer Tools, AKA React DevTools comes into play. It allows you to inspect and debug your React applications by providing access to the components, states, hooks, props, what renders what, and more.
This article will show you how to use React DevTools by focusing on components, props, and state inspection. We'll also examine how to use it to enhance application performance.
For demonstration, we'll use the 2048 game code. You can grab it in this GitHub repository.
How to Install React Developer Tools
Installing the React developer tools extension for your browser is the most common way to use it.
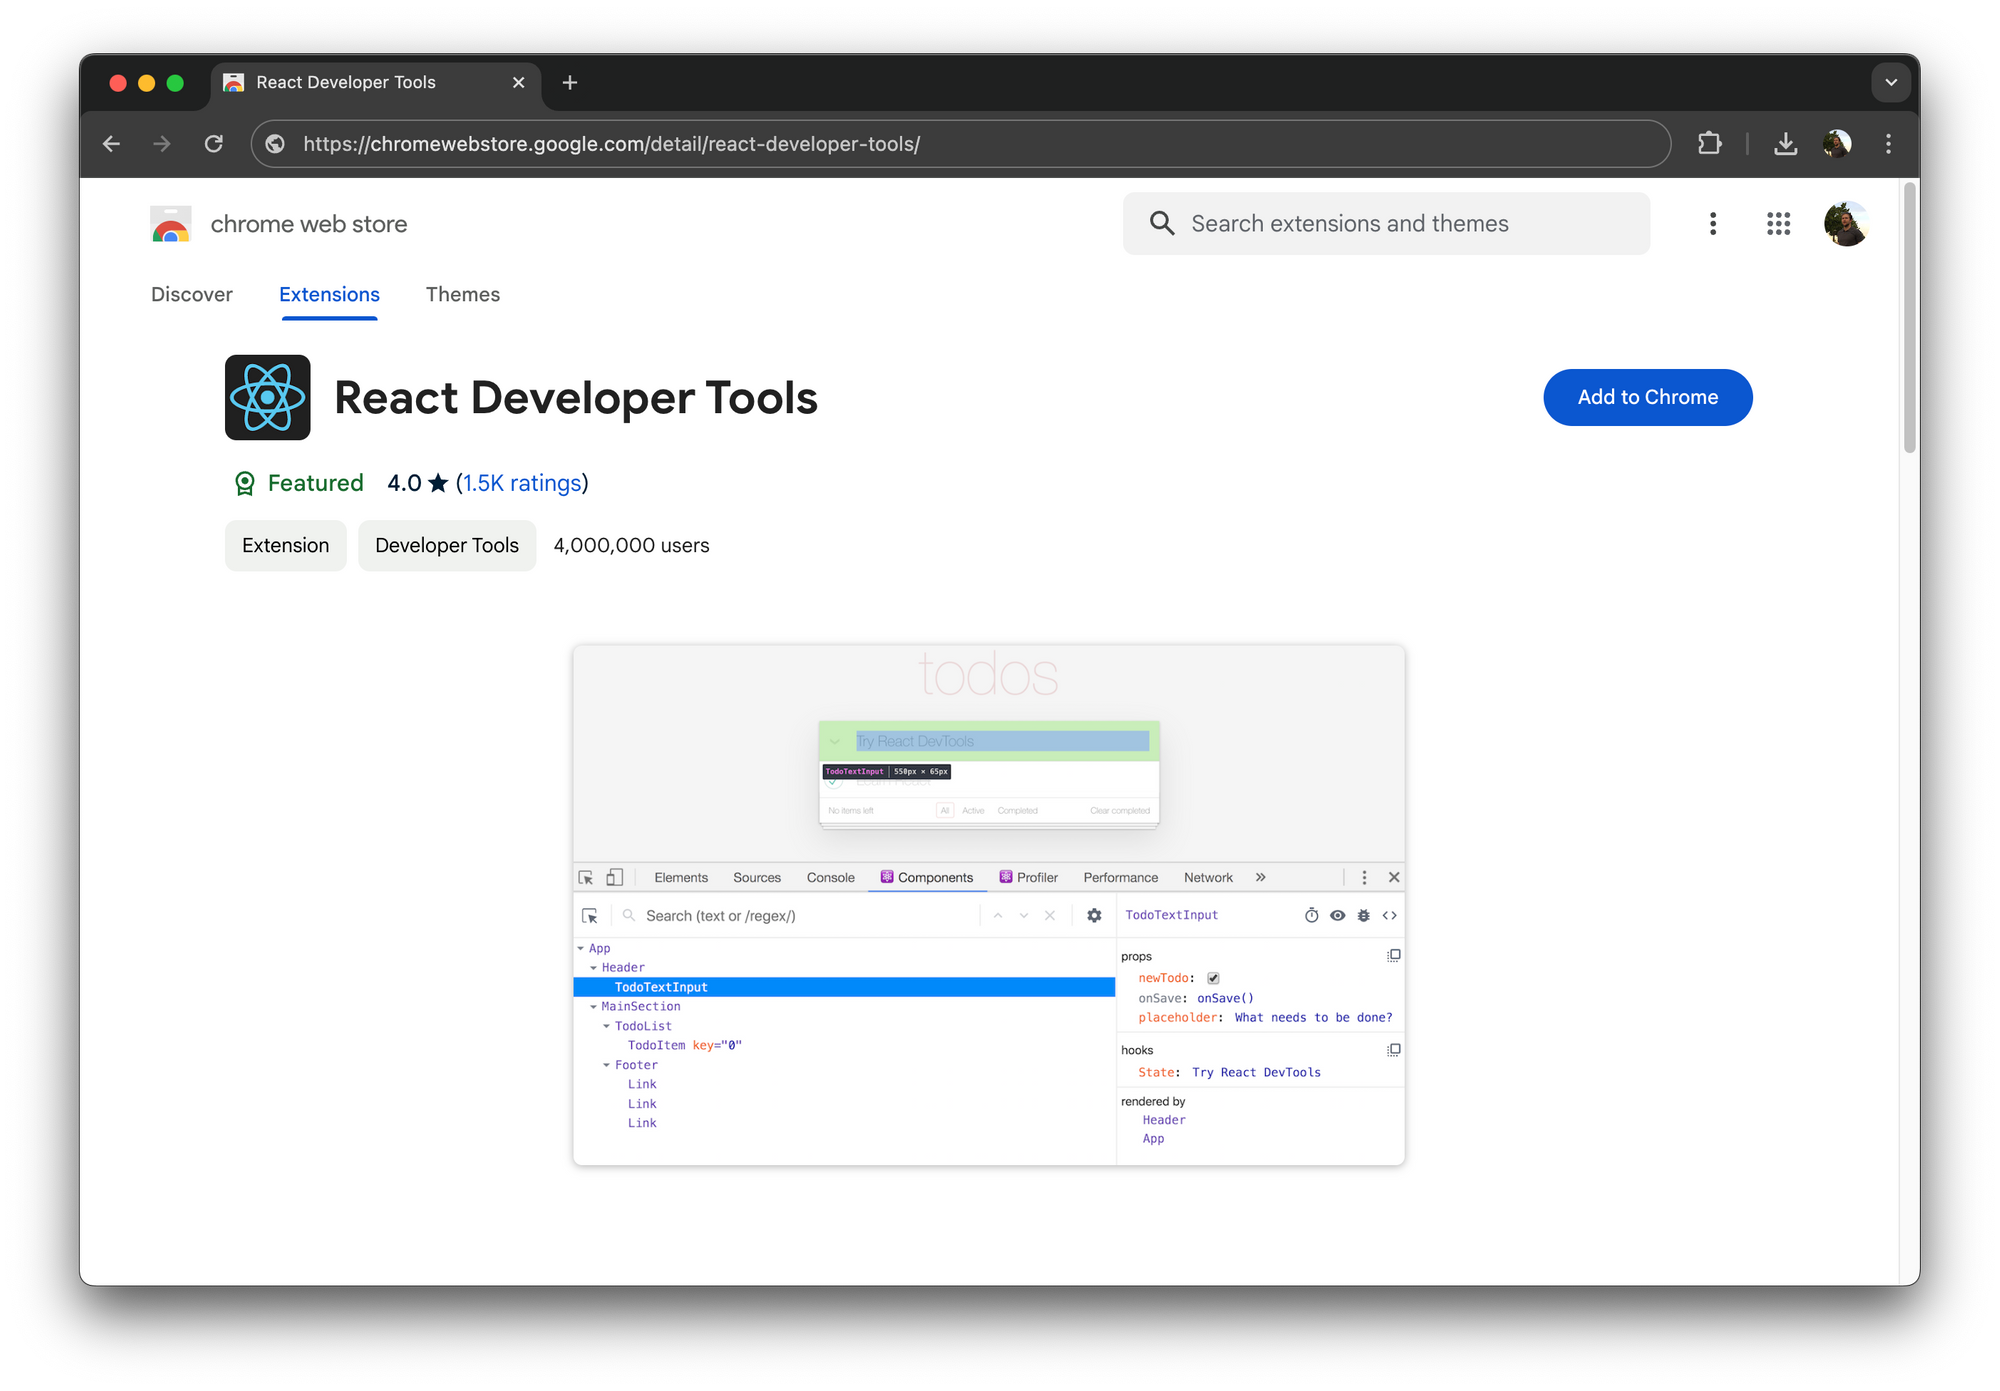
If you use Chrome, visit the Chrome Webstore and search for "React", then select "React Developer Tools" and click the "Add to Chrome" button to install it.
React DevTools is also available as a standalone electron app, an NPM package, and an add-on for both Edge and Firefox browsers. If you use the Safari browser, consider using the NPM package.
If you use the extension on Chrome but want to migrate your data to either Edge and Firefox, it will be automatically installed for you!
How to Navigate the React Developer Tools Interface
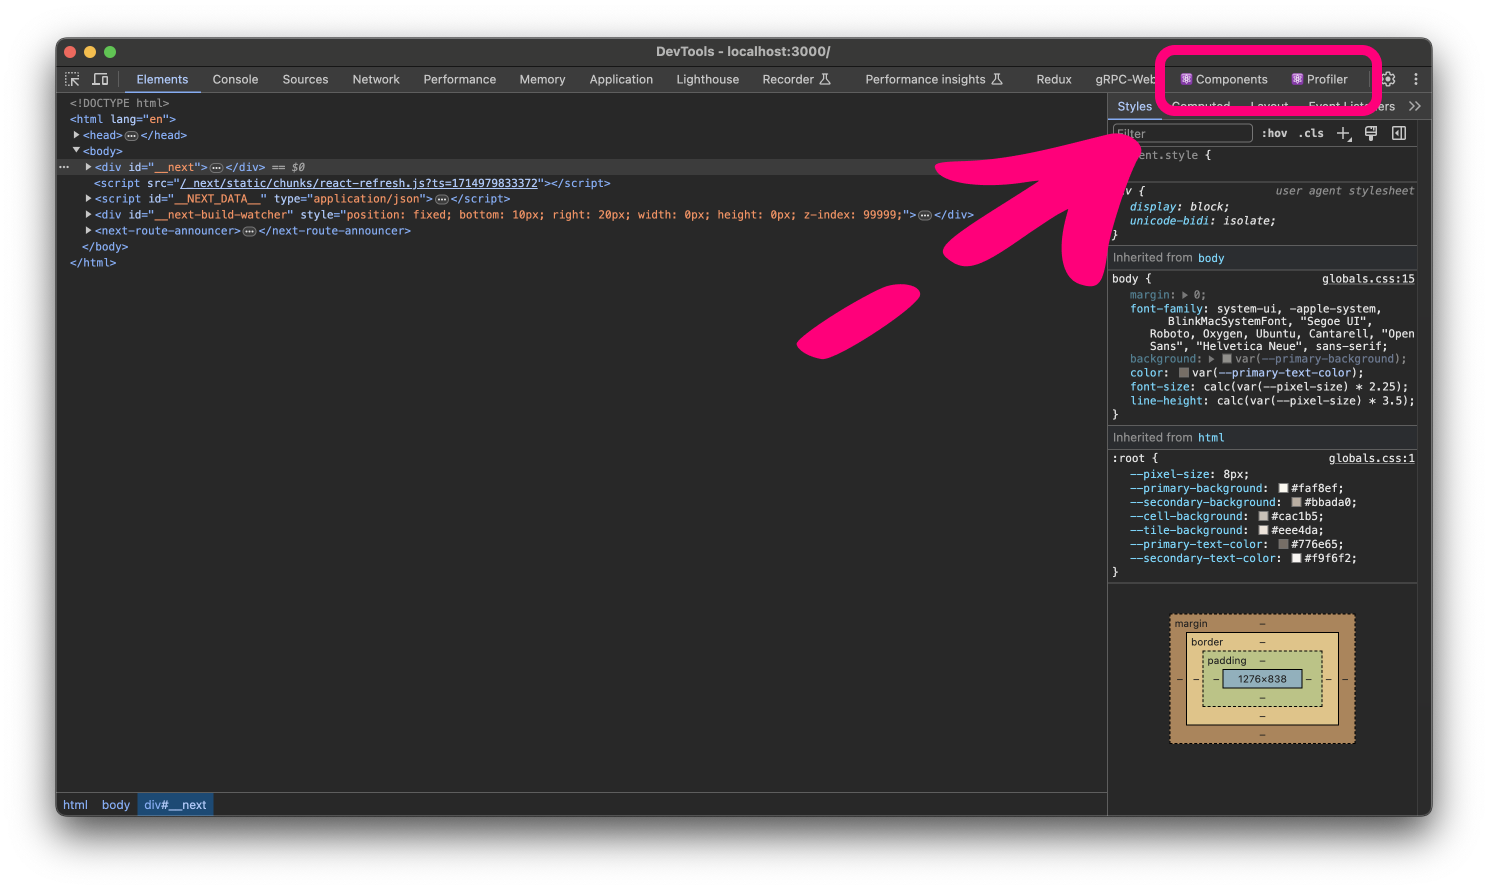
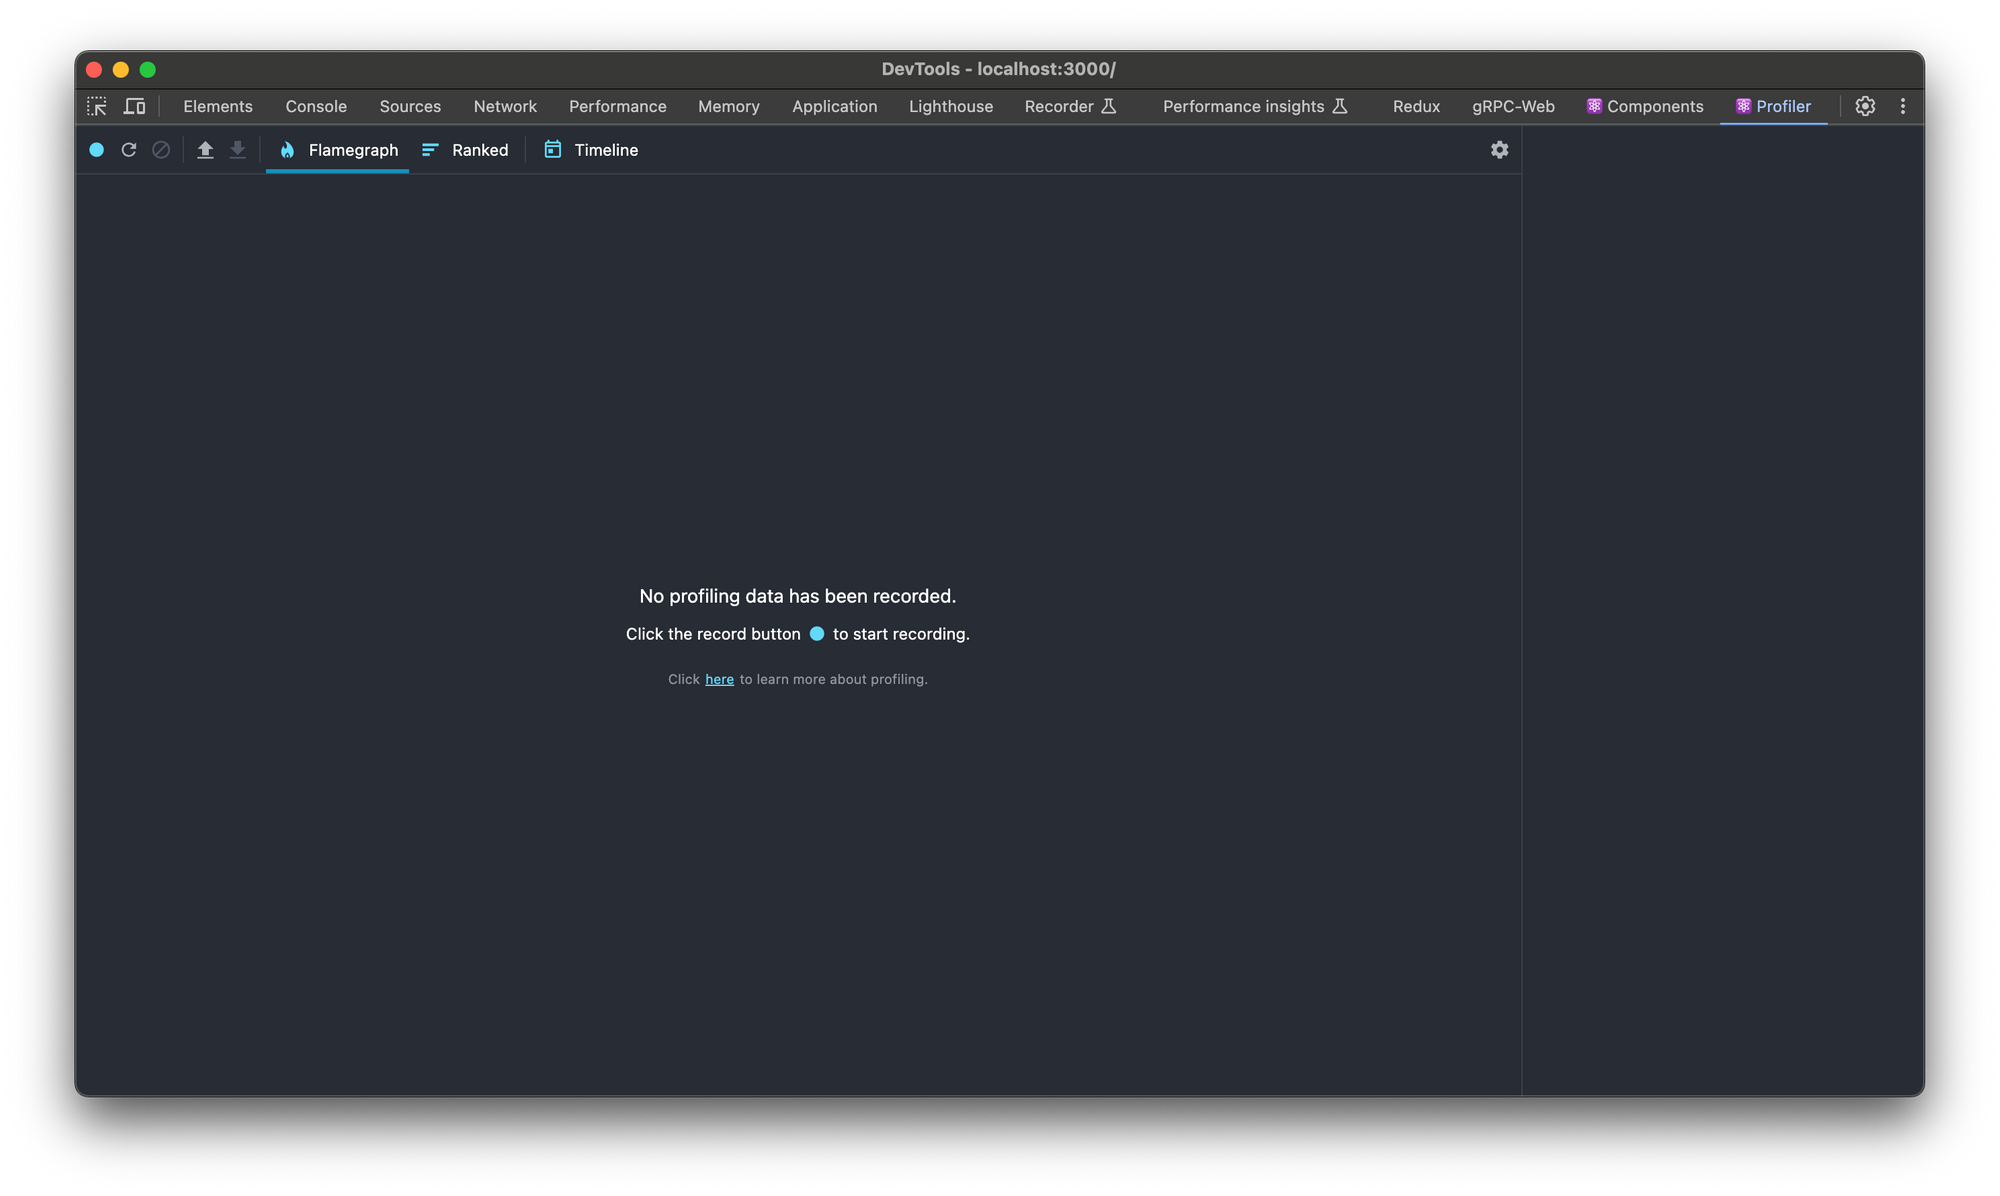
After installing the DevTools as an extension, open your browser console and you should see two additional tabs – Components and Profiler.
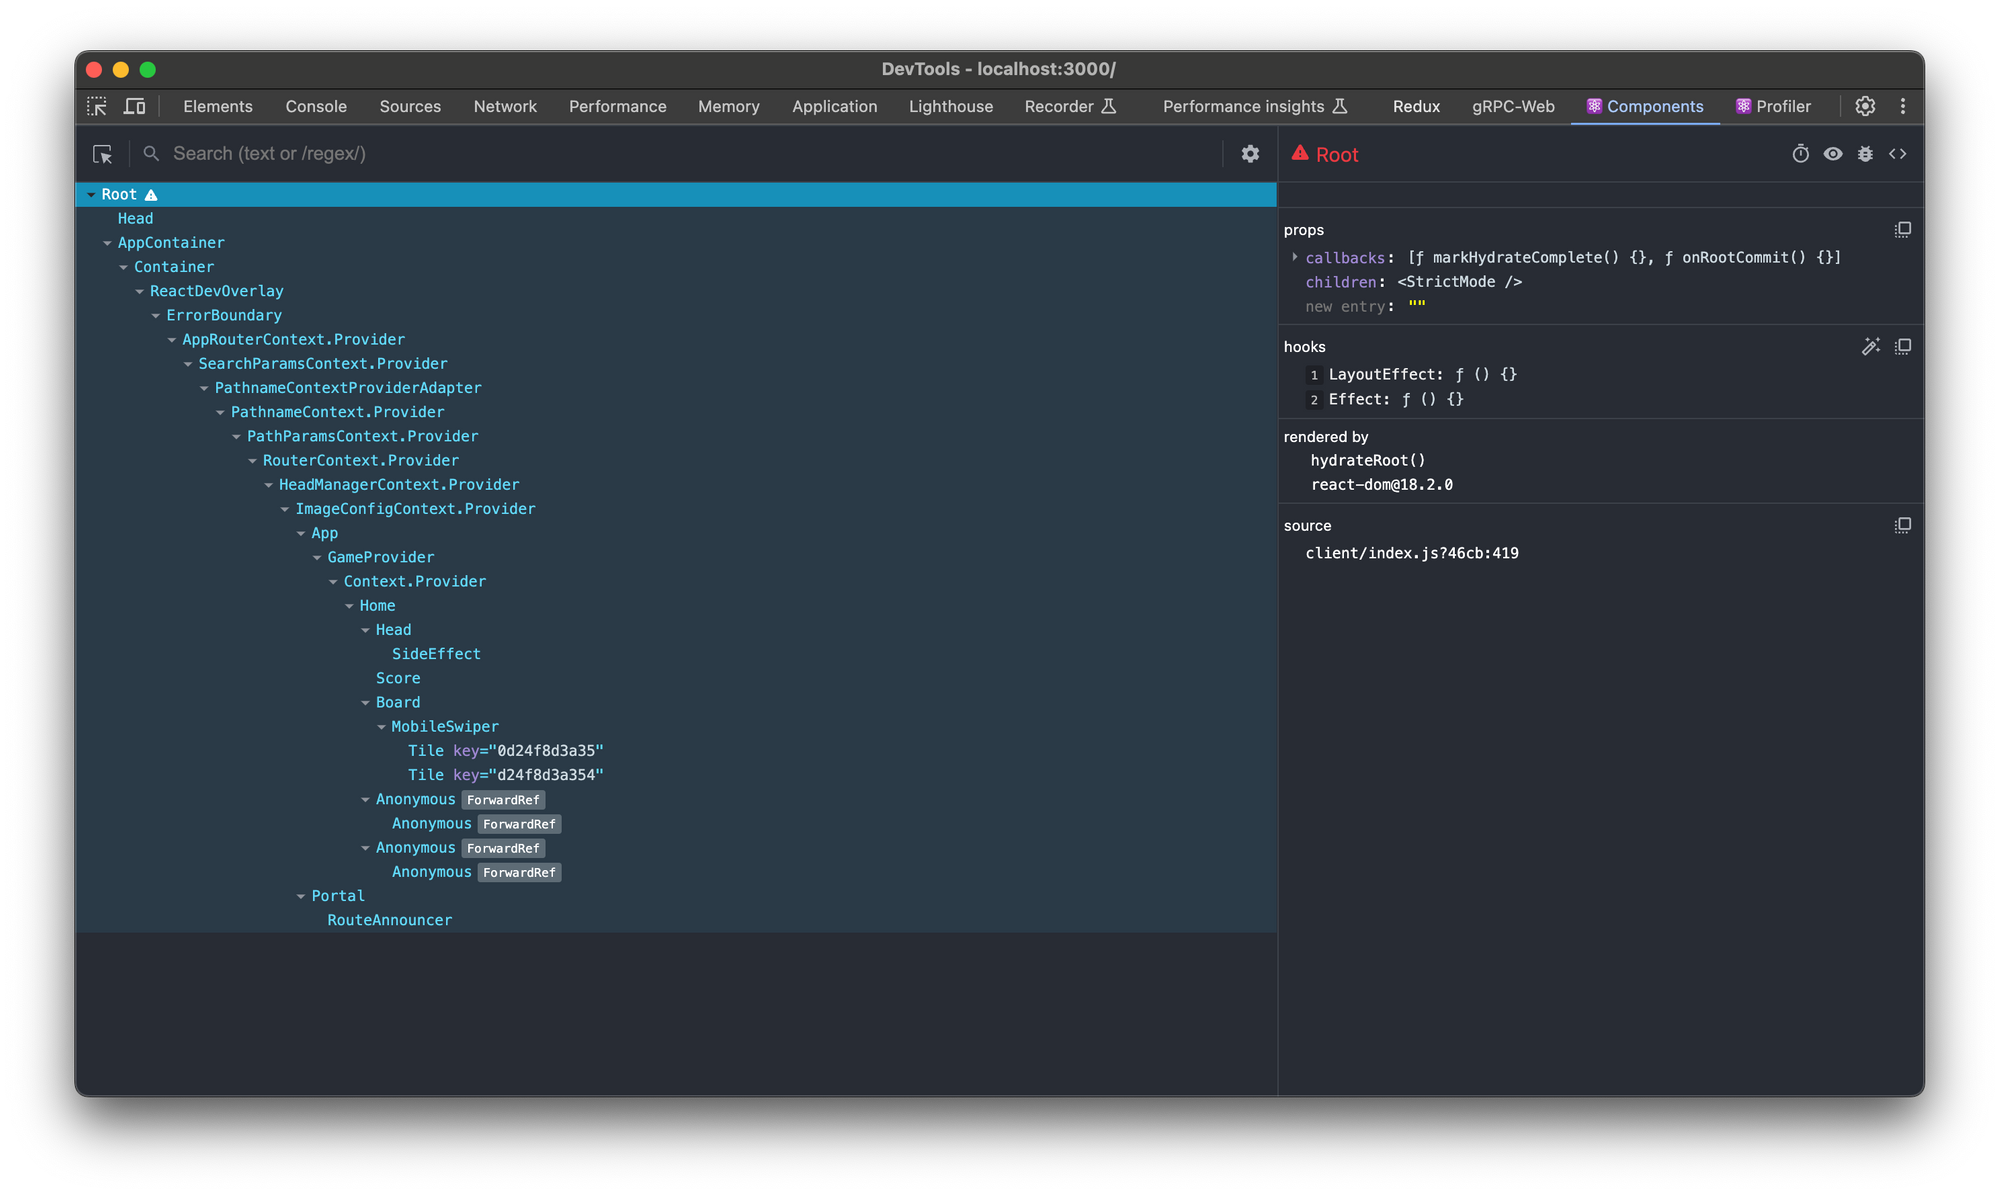
The Components tab displays a tree view of the components in your application. It also gives you access to the hooks and props in each component.
The Profiler tab allows you to analyze the runtime performance of your applications and identify costly re-renders or performance bottlenecks. From there, you can import and export recorded performance sections and see how long a component renders or why it re-renders.
If you click the gear icon on the right side in any of the tabs, you should see a pop-up with 4 tabs – General, Debugging, Components, and Profiler.
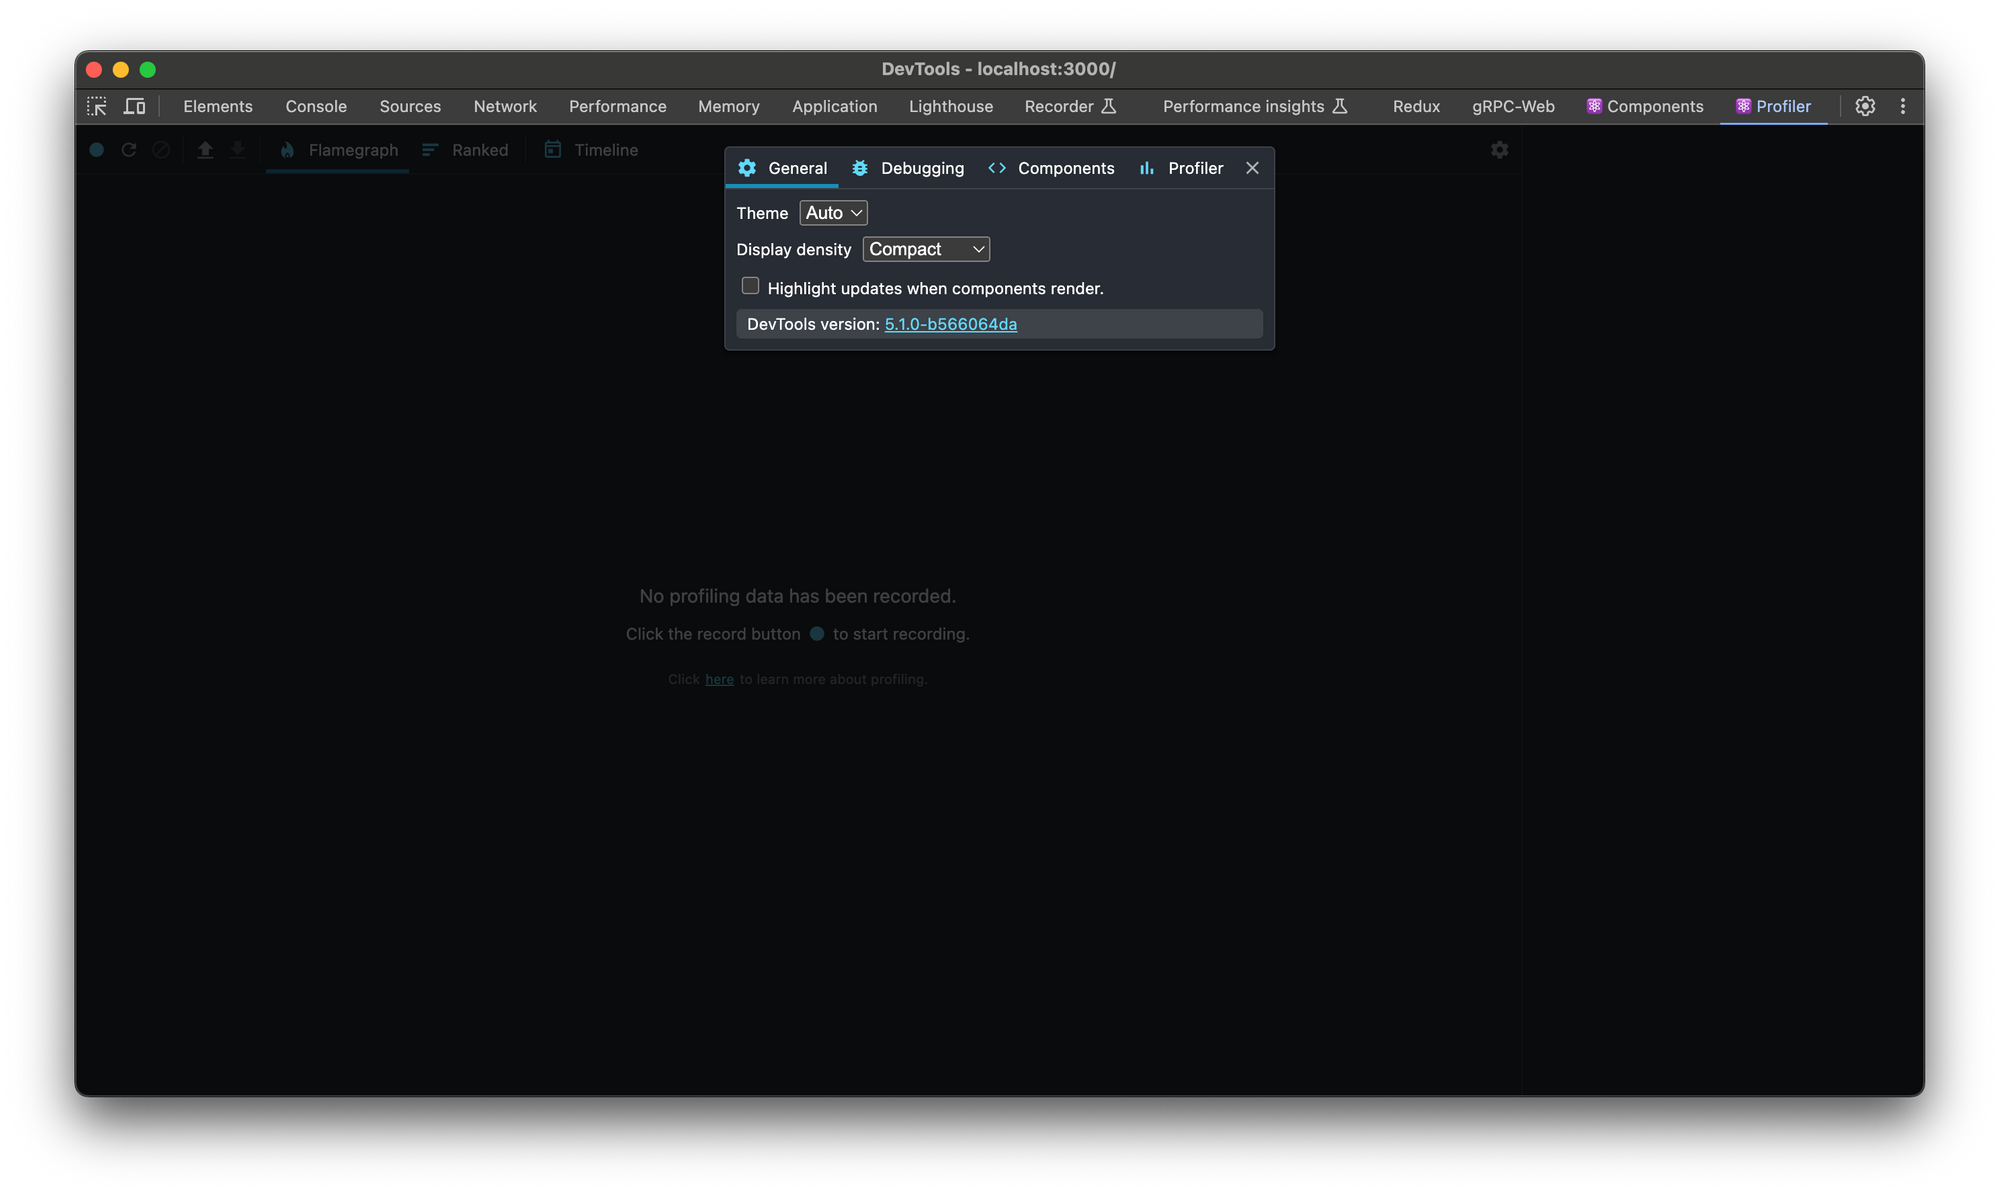
In the 4 tabs, you can adjust settings related to theme, display, debugging options, component filters, and recording settings for the profiler.
How to Inspect React Components with DevTools
In the Components tab, you can select a component and inspect it, just like you'd do with HTML elements in a traditional browser's dev tools.
To do that, click the select icon on the top-left corner, then select any part of the app to see the component that represents it:
As you make changes that involve adding something, new components will be added to the tree.
On the right-hand side in the Components tab are the props, hooks, renderer, and the source for any component you select in the tree.
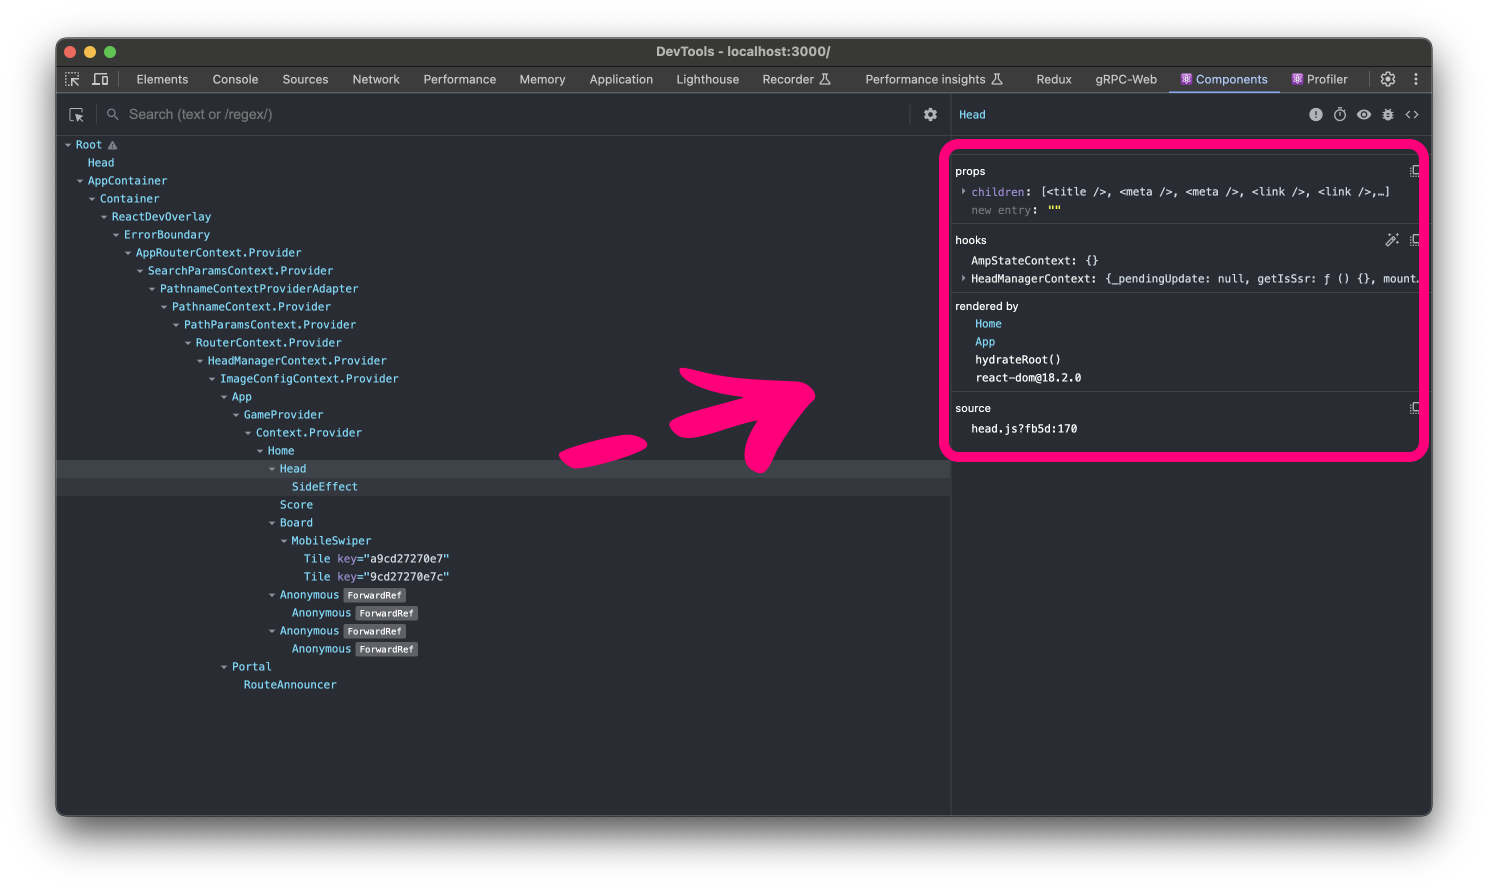
How to Explore Component State and Props
Remember that when you select a component in the tree, the state and props in that component are available on the right-hand side.
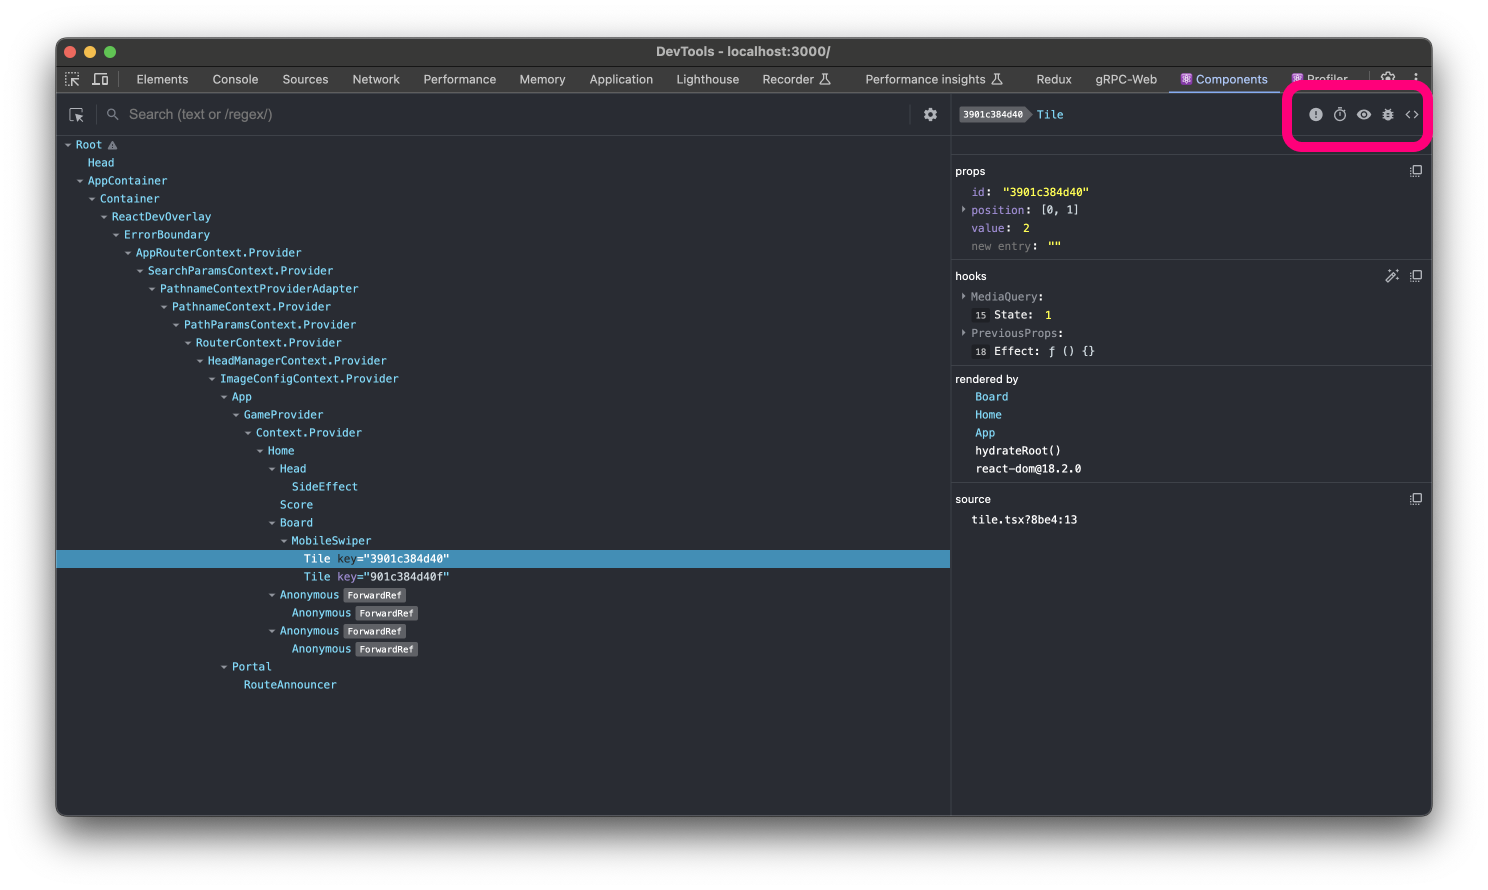
In the screenshot below, I have selected a Tile component for you to see the props:
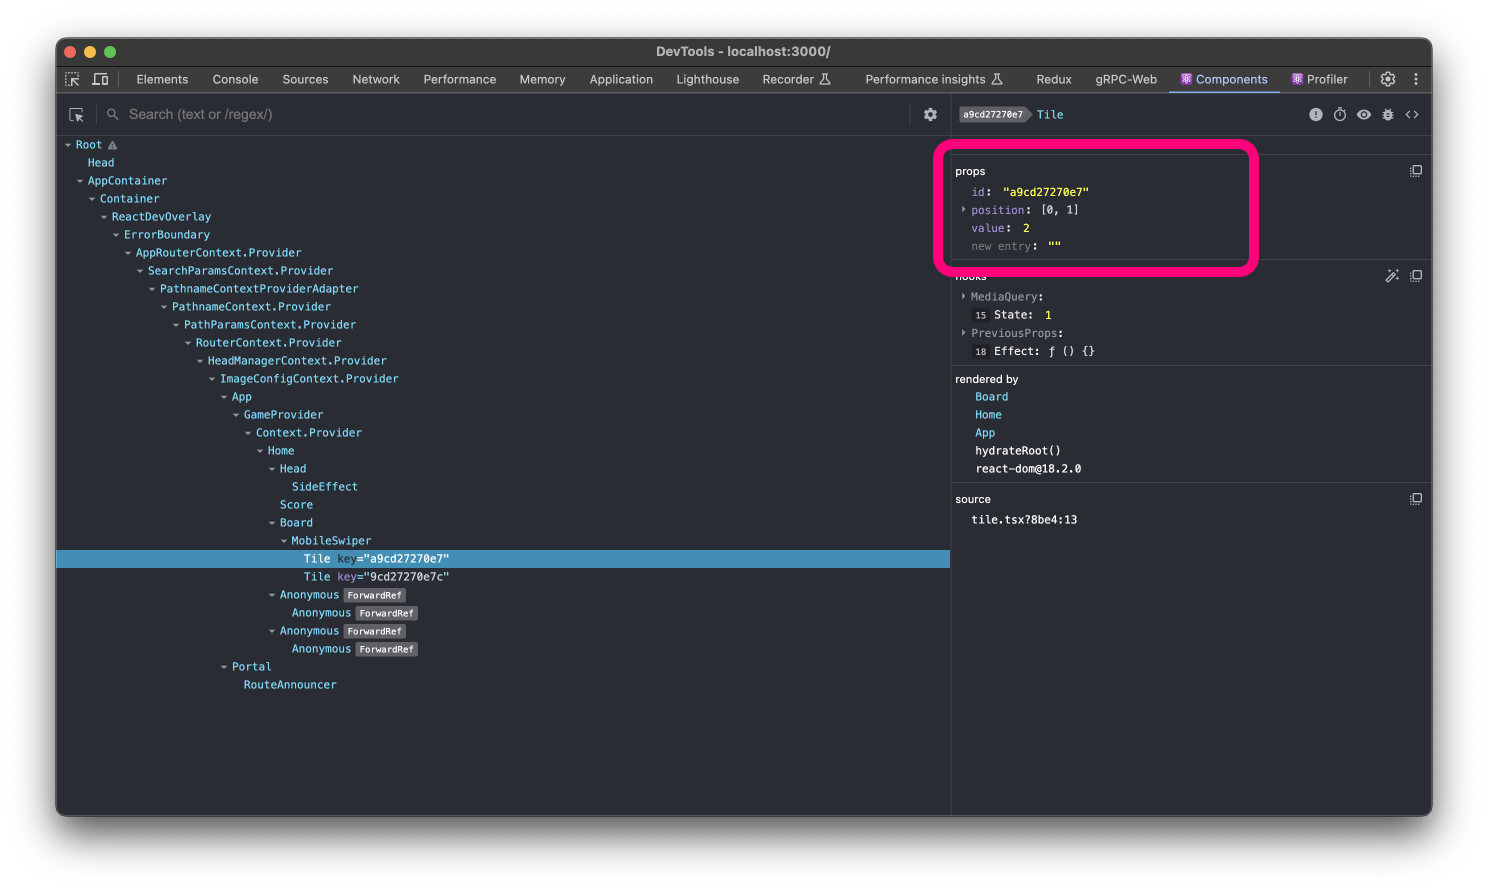
You can see that the Tile component has id, position, and value properties. From here, you can add a new prop and edit the existing props.
For example, I just changed a value prop from 2 to 4 and it reflected in the UI in real-time:
You can also make changes to a piece of state. For instance, the scorecard you can see in the UI is a piece of state in the GameProvider context. It updates your score as you play the game.
You can select the GameProvider context, look for the score state, and change it to something else:
How to Debug React Applications with React DevTools
The traditional browser developer tools is good for debugging your HTML, CSS, and JavaScript code, but it has limitations concerning debugging React applications.
This is the primary reason React DevTools was created in the first place, as it has the essential built-in features that can show you everything you need to debug your React apps.
One of the errors the browser can help you debug is a reference error. For instance, if there's an error in any of your components, the browser can show you the error message and the line affected.
For example, I've forced an error by changing cells to cell on line 62 in the board.tsx file of the app. This is what the error message looks like in the browser:
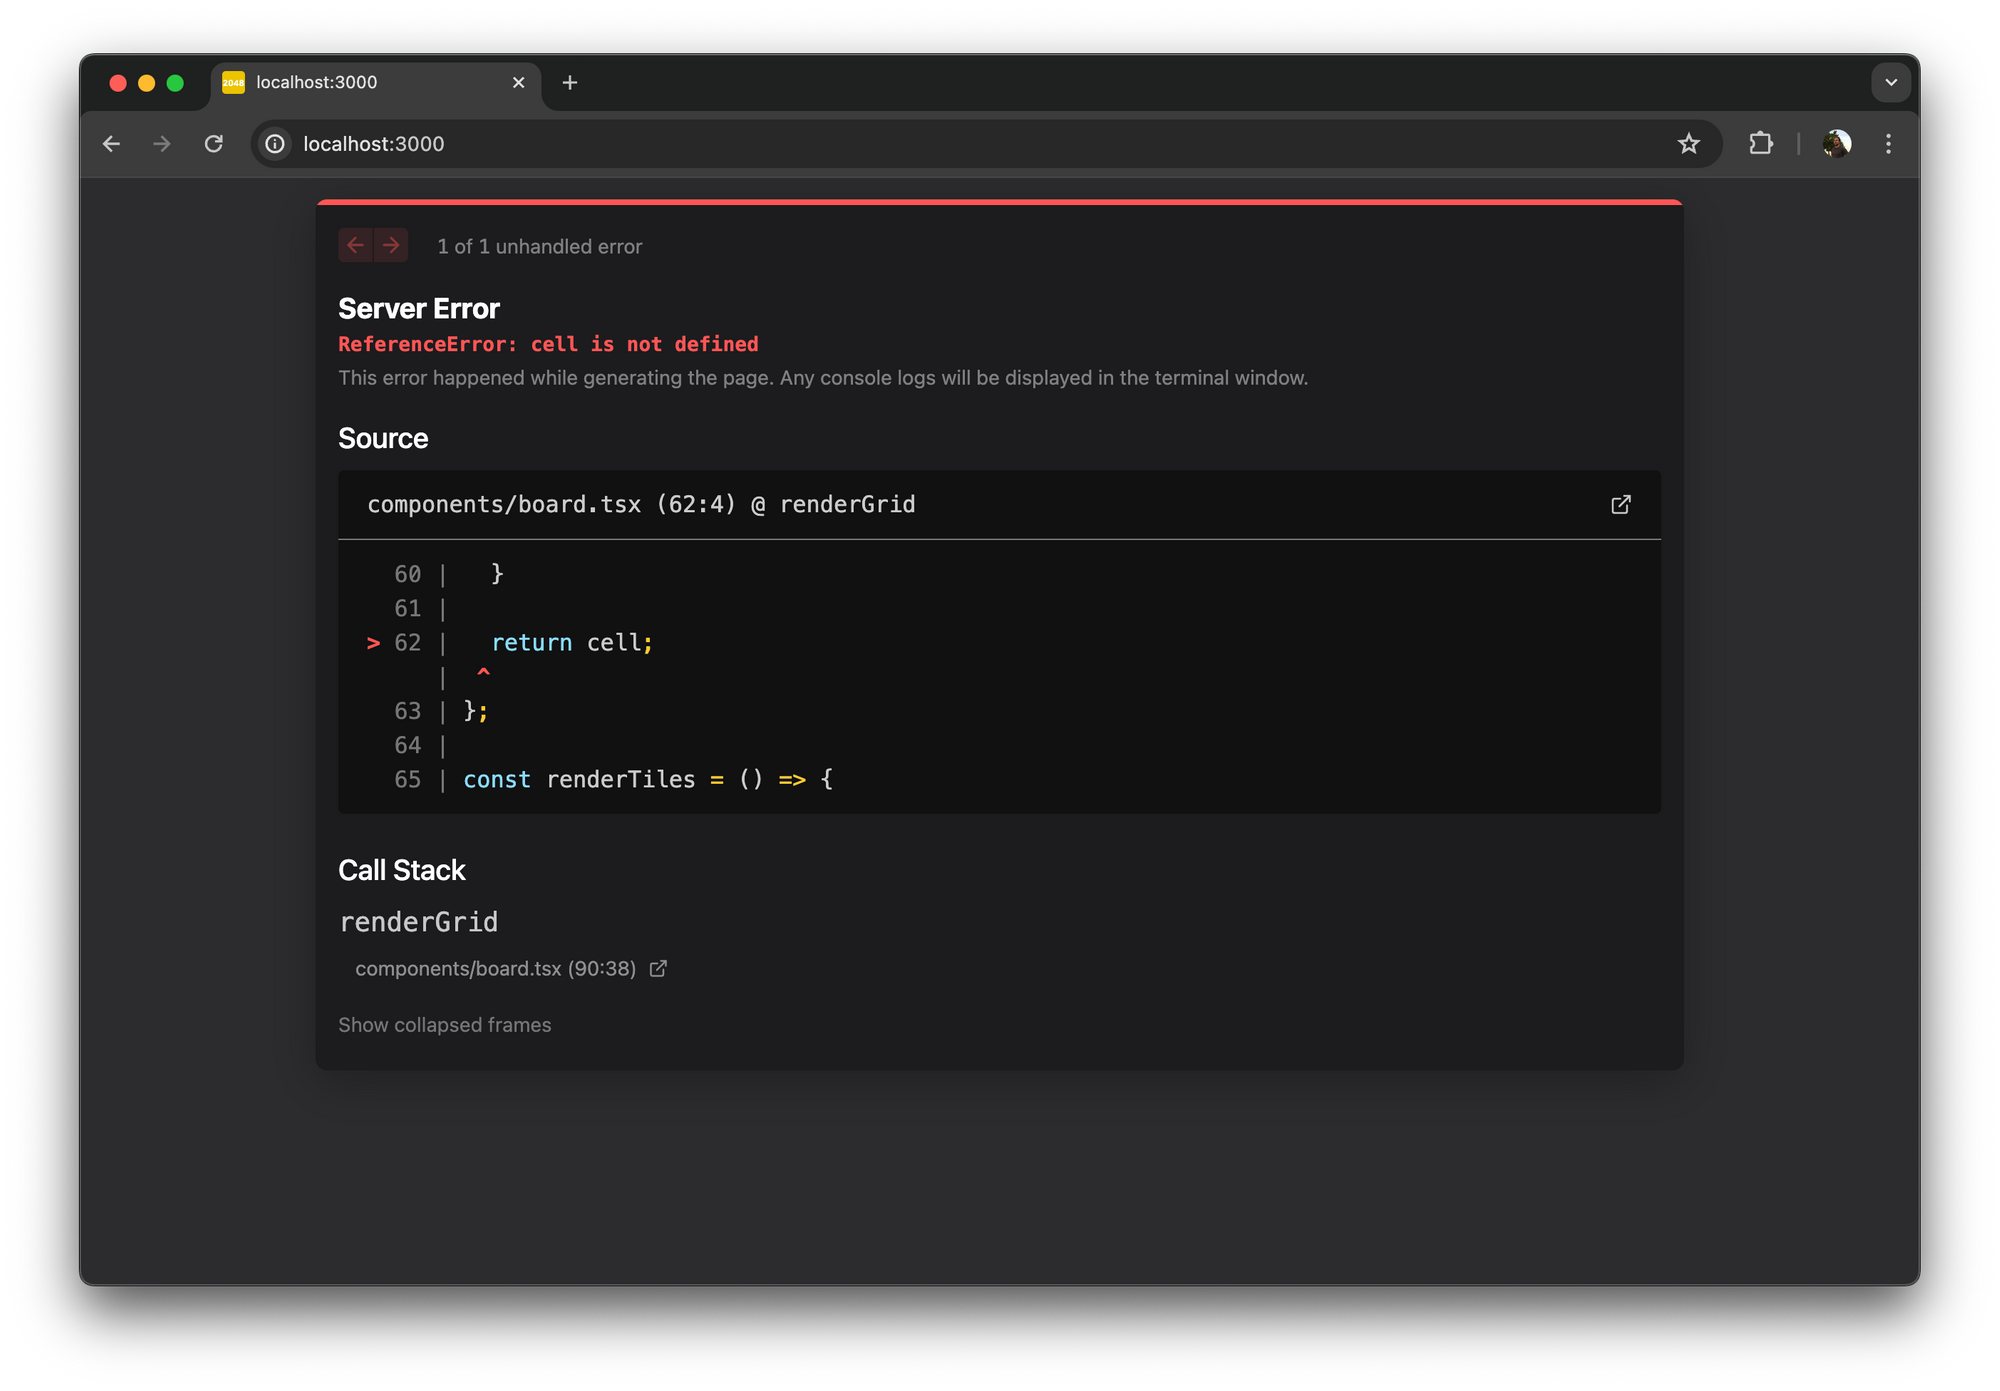
You can then go to the line of code where the error occurred and make the necessary adjustments so the app can run again.
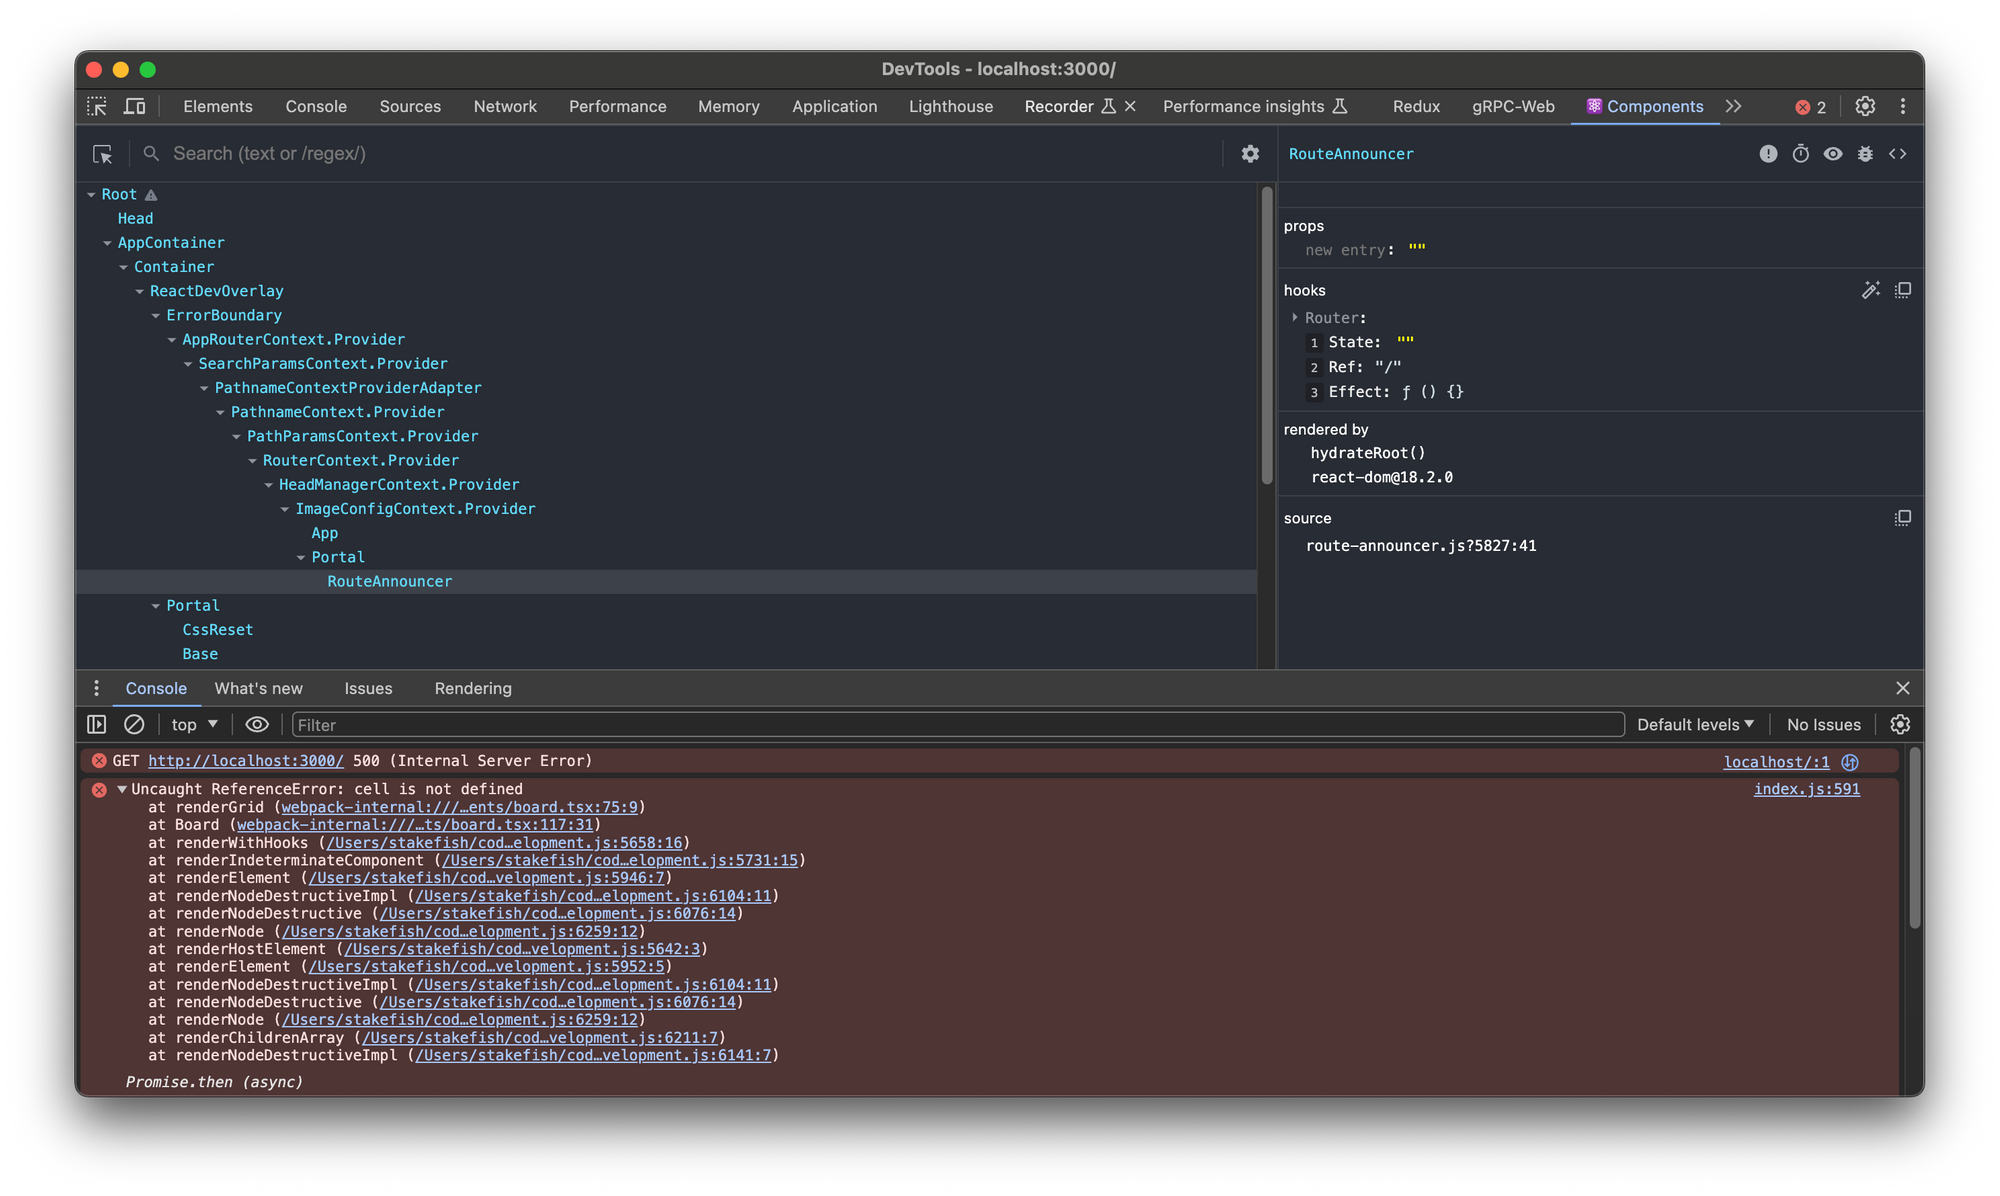
React DevTools also shows you a reference error and the component in which it occurs.
How React DevTools Takes Debugging to the Next Level
In the Components tab, above the items on the right-hand side, are iconized buttons you can use to:
- Force the selected component to an errored state
- Inspect the matching DOM element
- Suspend the selected component
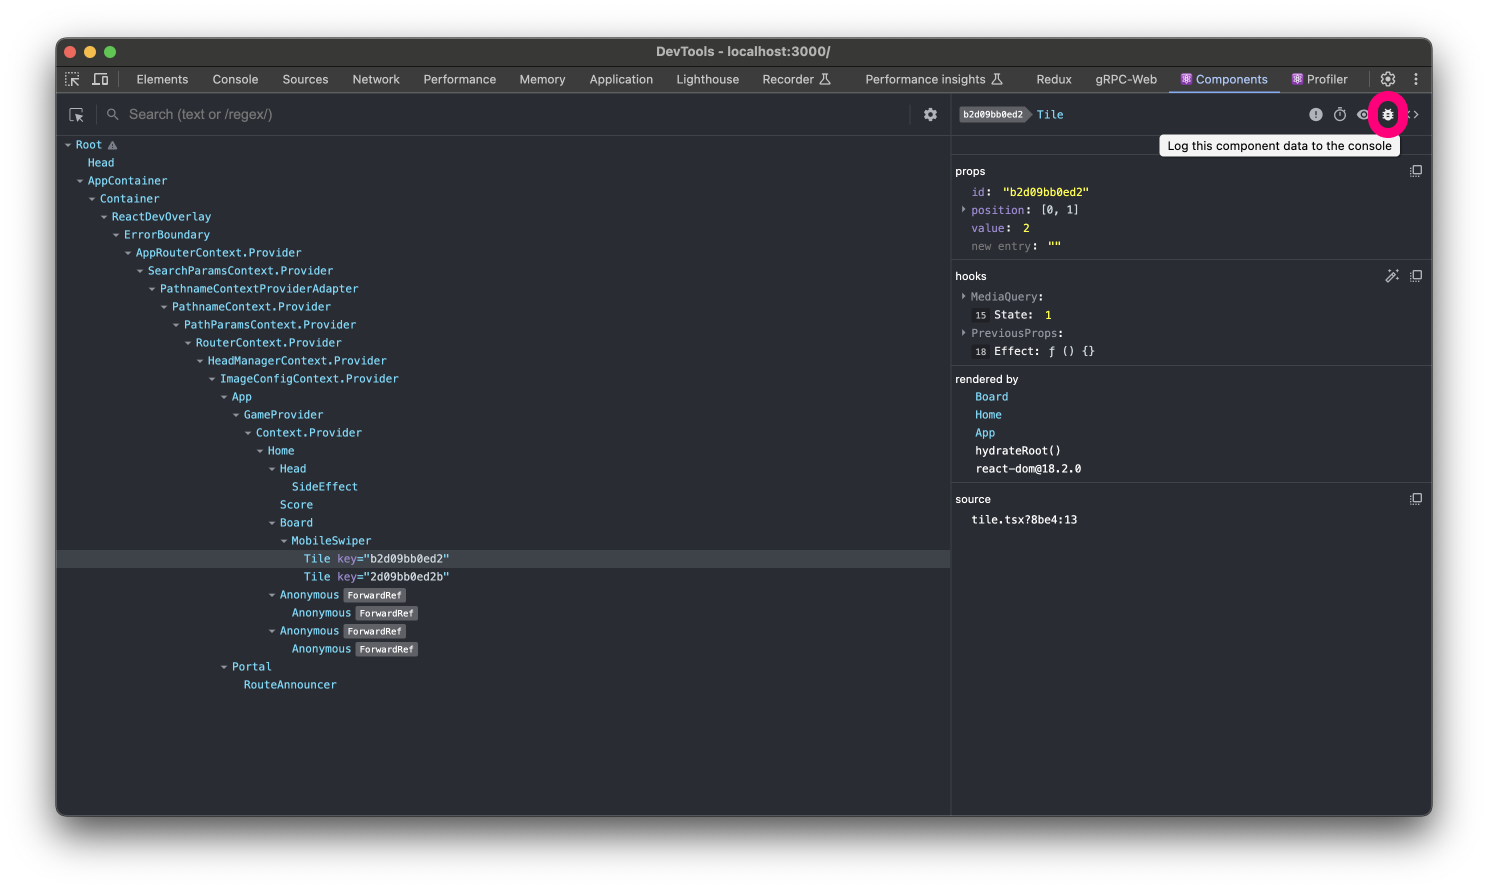
- Log the component data to the console
- View the source code for the elements in the selected component
For example, if the tiles in the game are not showing as they should, it's probably a styling issue.
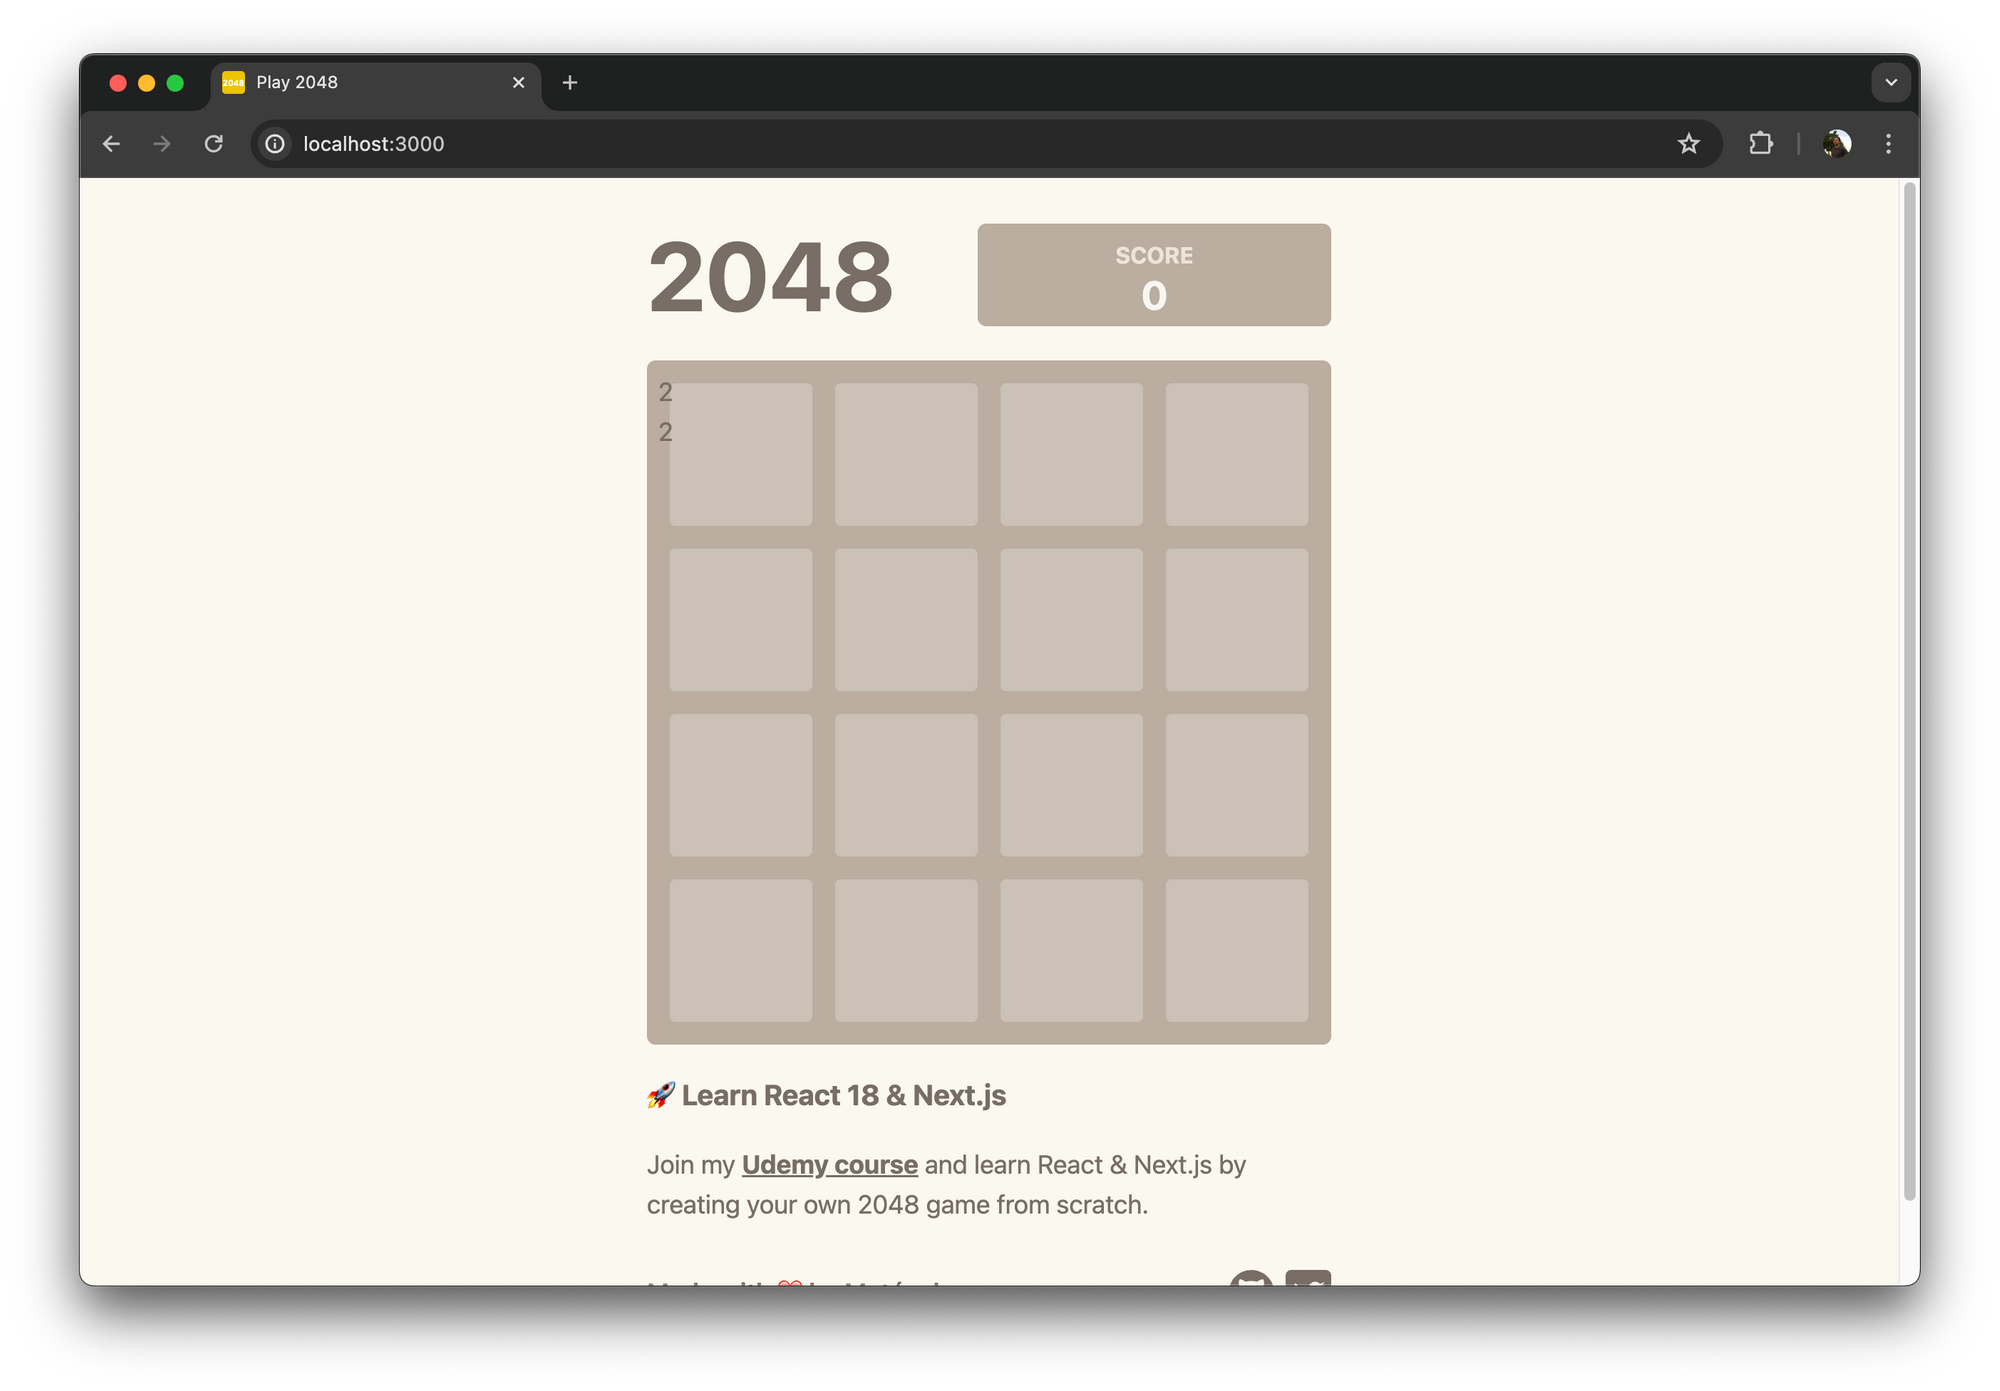
This particular error will not stop your app from running, so the best way to debug it is to use React DevTools instead of looking through your code, especially if it's large.
You can select the Tile component and log its data to the console. When you do this, the props, hooks, and nodes of that component will be logged for you.
To see the component's data, you have to switch to the console tab and inspect the nodes to see what might have gone wrong.
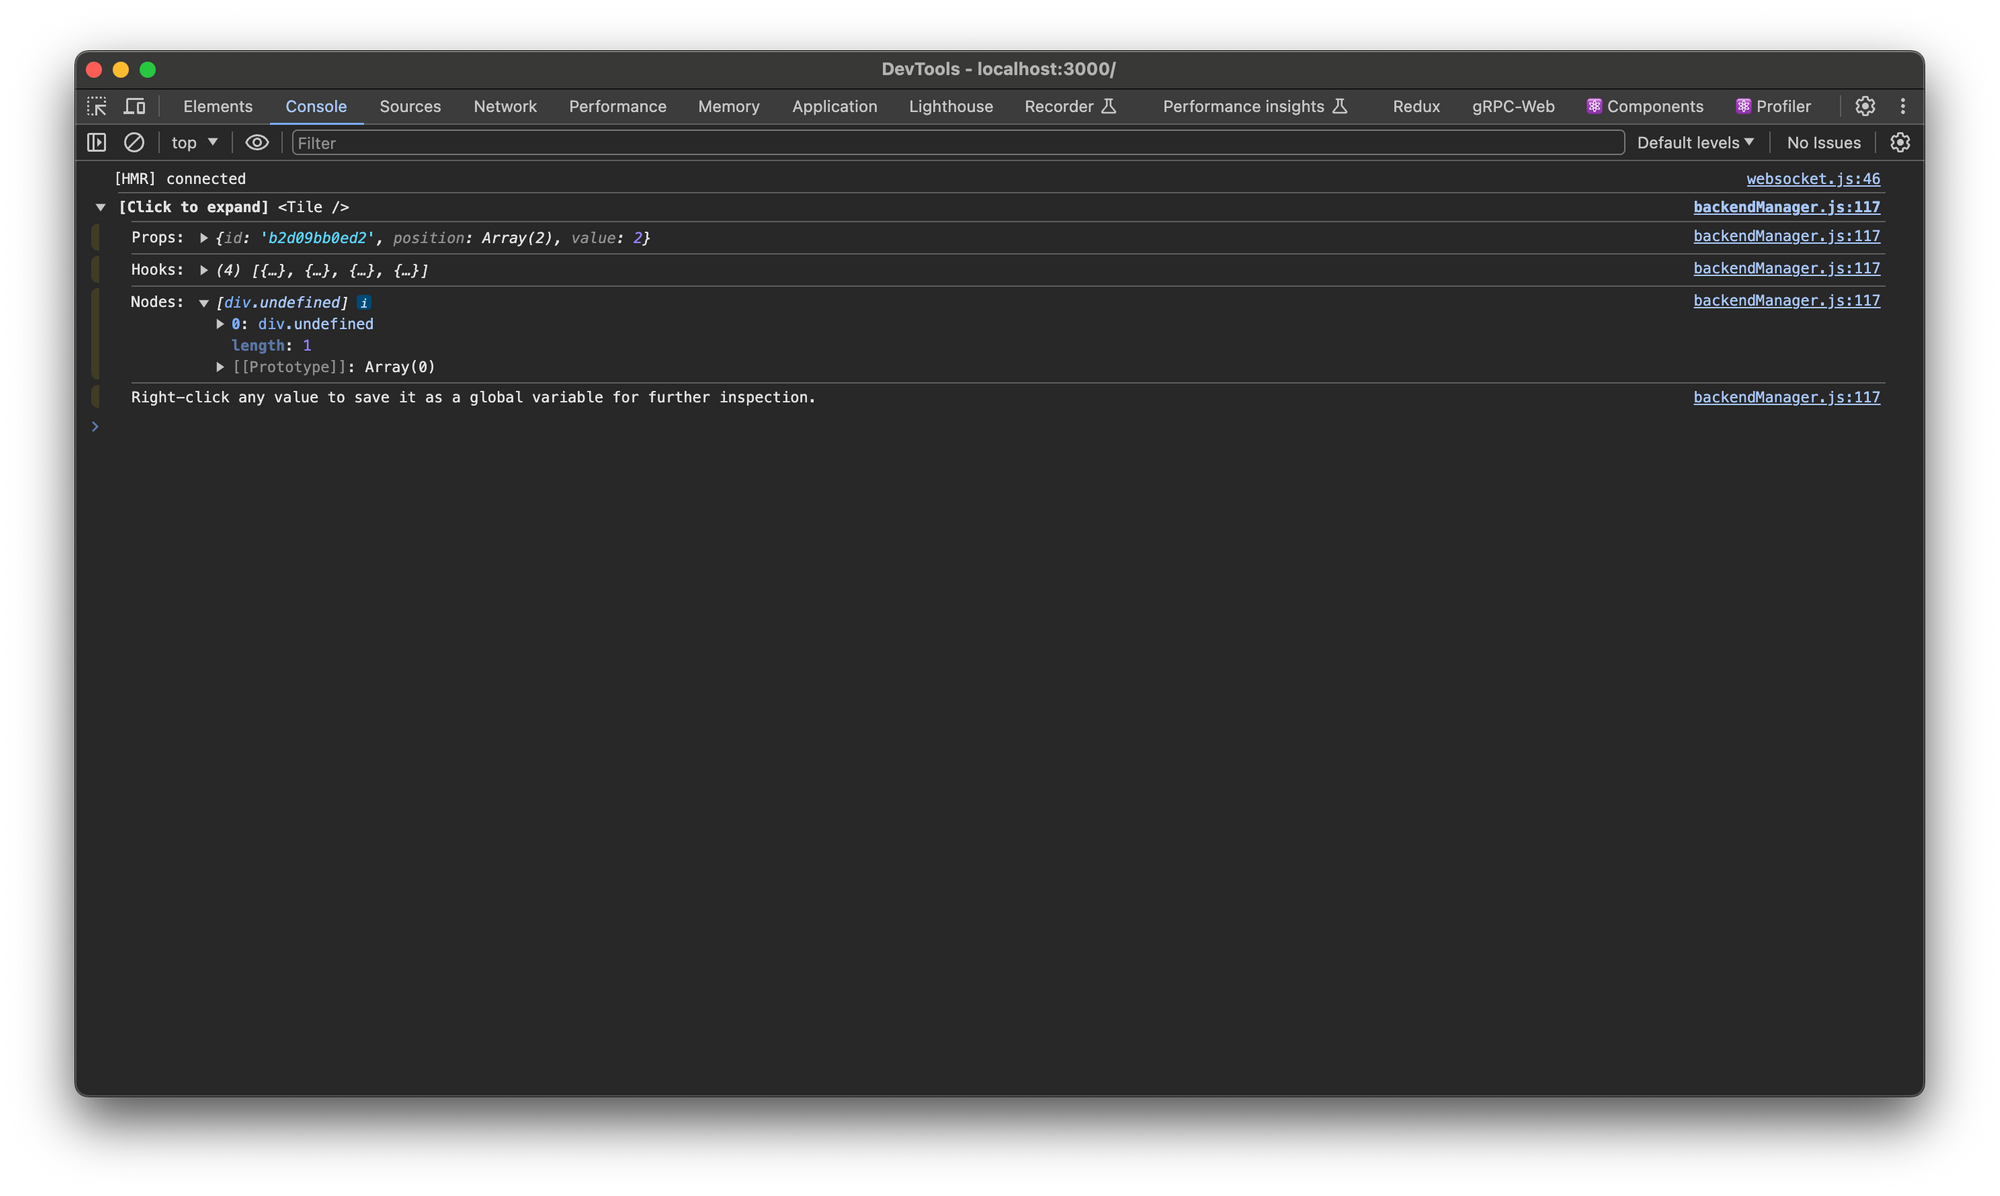
In the image above,it shows that there is a div element with an undefined className. This tells you that you've misspelt a className value, so you need to go back to your code and correct it.
If the error you're getting has to do with props or hooks, then you need to open up any of them to see what went wrong.
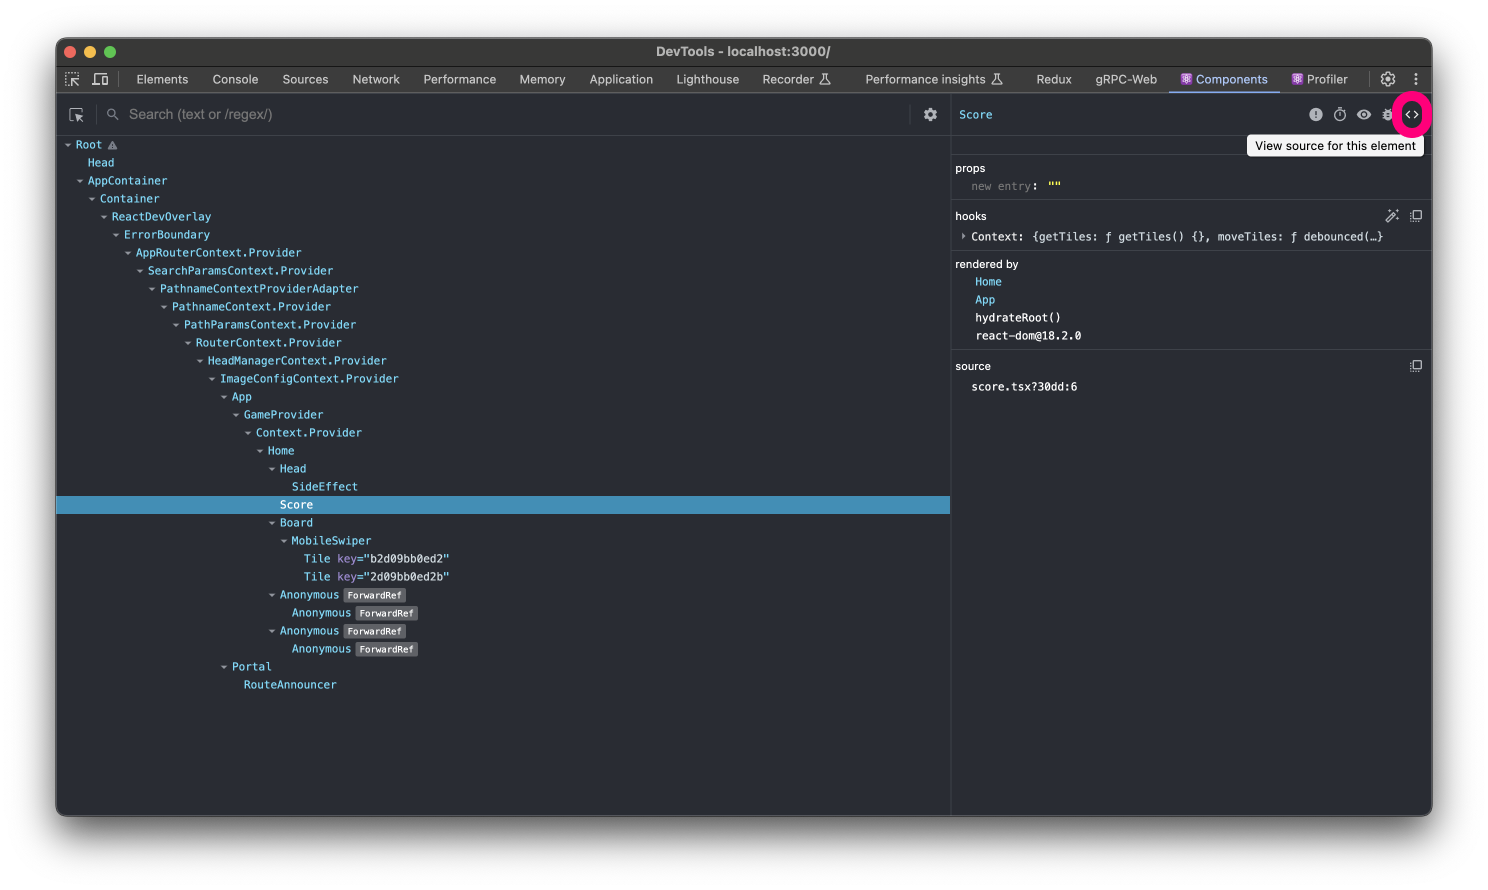
You can also look through the source code of any component causing an issue. For instance, if the scoreboard is not showing as it has to, select the component and click the "View source code for this element" icon.
After the source code is displayed, you can step through the end of each line. Any line end that is red when you do that is the one causing the error.
You can then go back to your editor and make the necessary changes on that line.
Performance Analysis with React DevTools
Doing performance analysis with React can help you understand the efficiency of your application and identify any performance bottlenecks. This is what the Profiler tab lets you do.
To do this, switch to the Profiler tab and click the "Start profiling" icon to start recording.
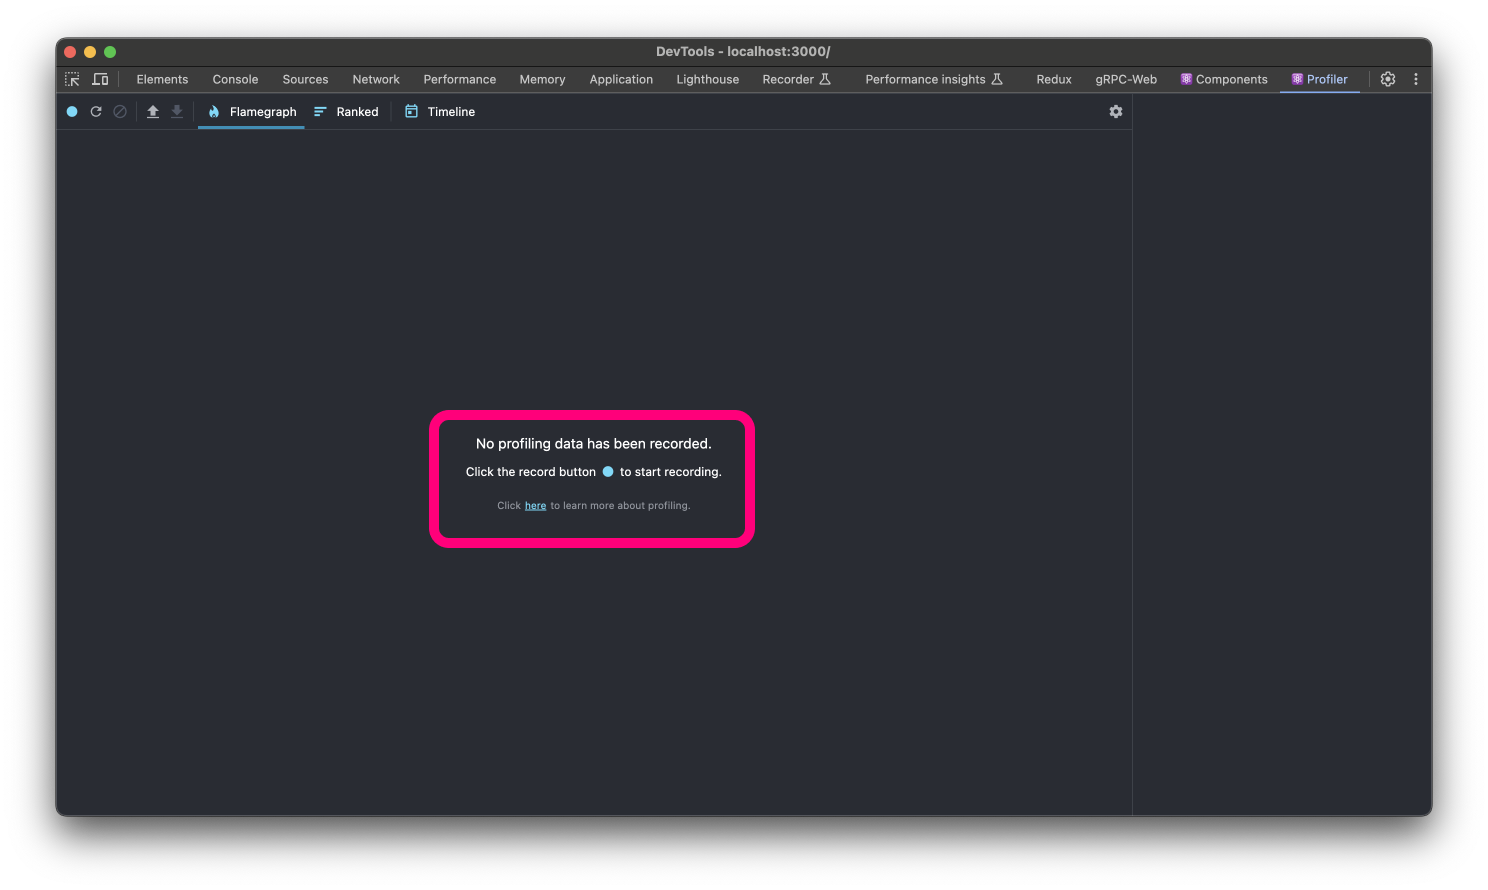
Perform the actions in your app you want to analyze. This could be page loads, user interactions like button clicks, swiping, or dynamic content loading. When you're done, click "Stop" to end the recording.
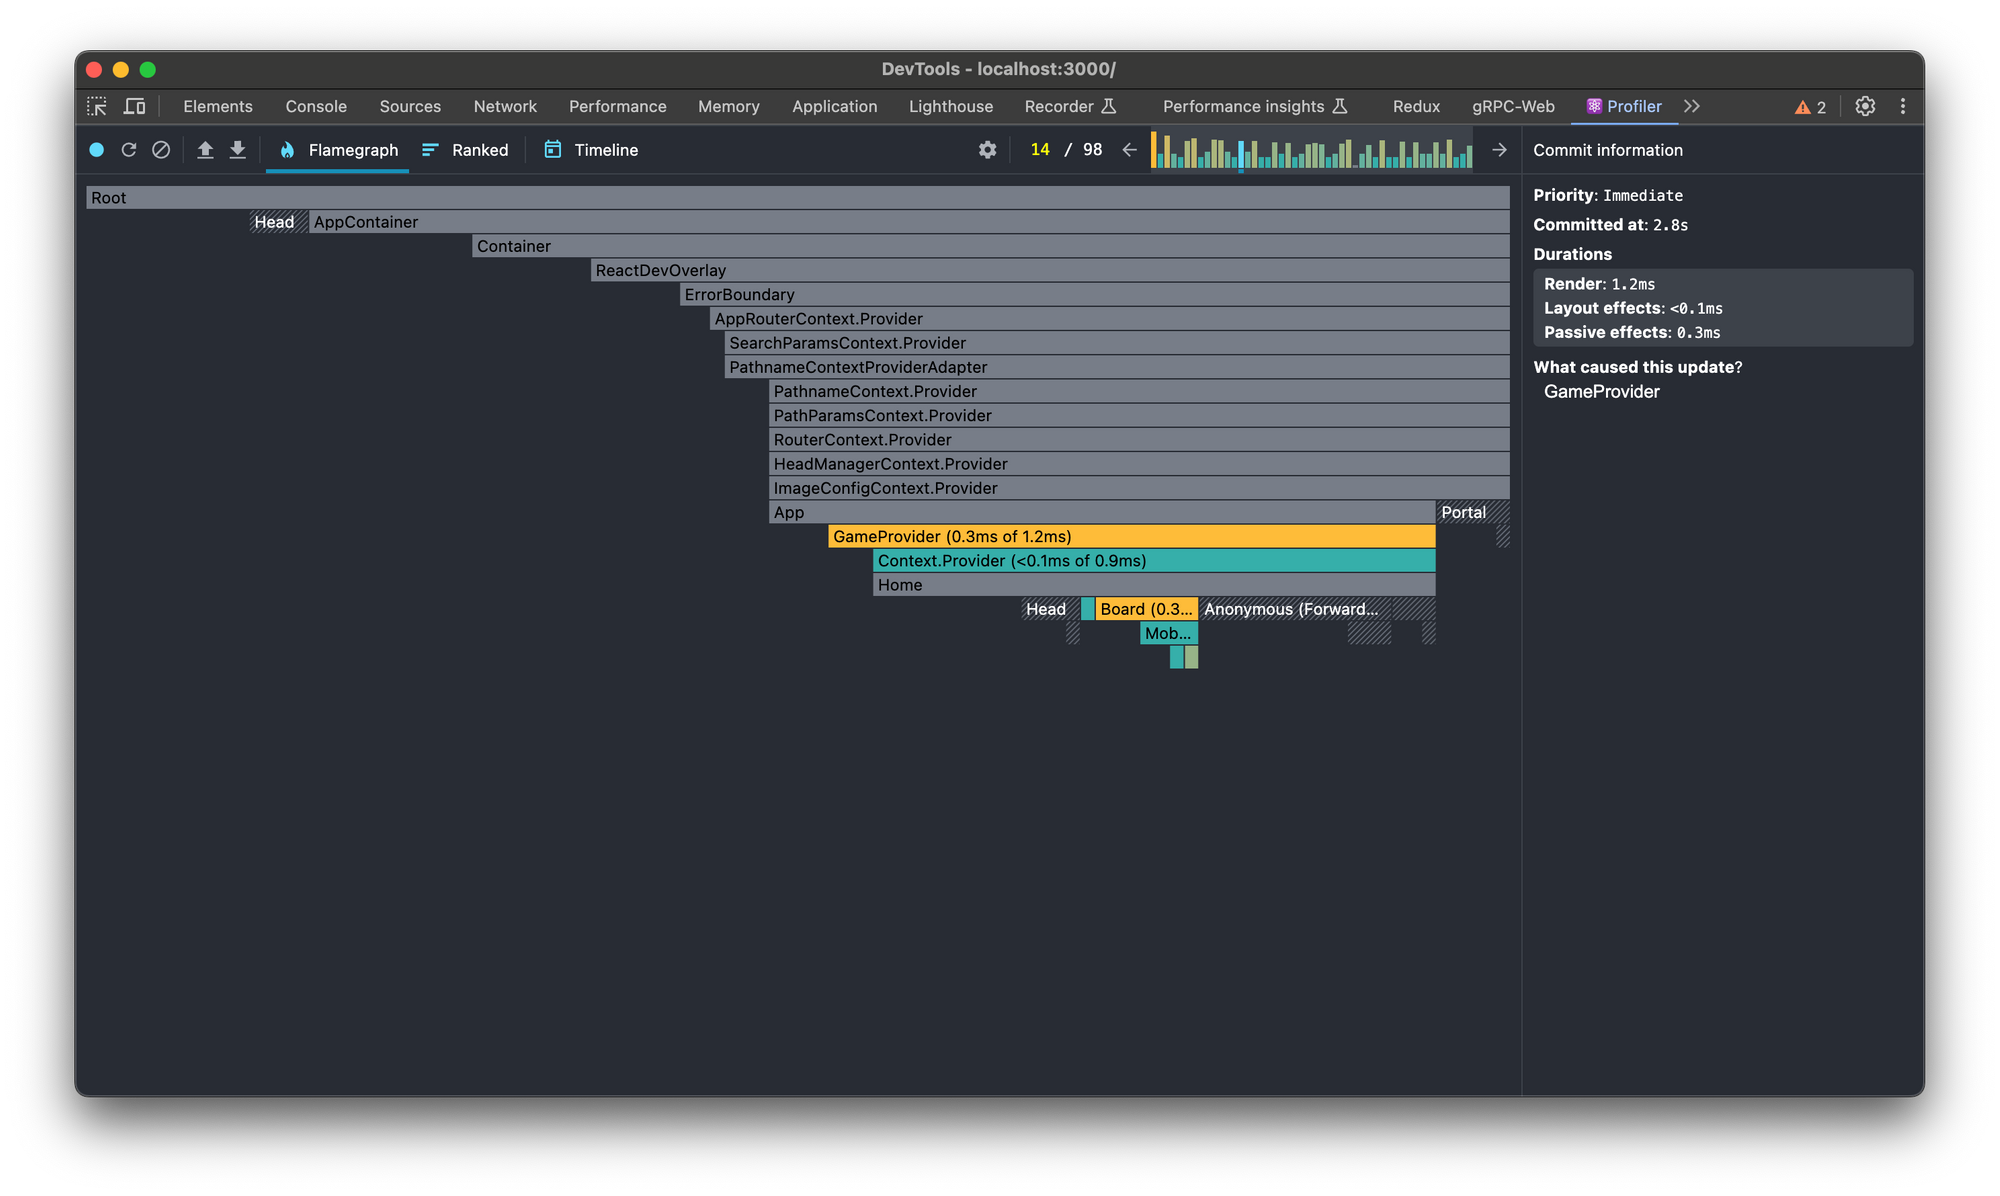
The Profiler will then display a flame graph and a list of commits. Each commit represents a render phase of your React application. Components that take longer to render will have wider bars.
You can then select a specific commit to view detailed information about the render performance of components during that commit:
You can also download the profiling session, or import a profiling session. This means you can share the session with your teammates.
Common Issue and Solution: How to Fix React DevTools Not Showing
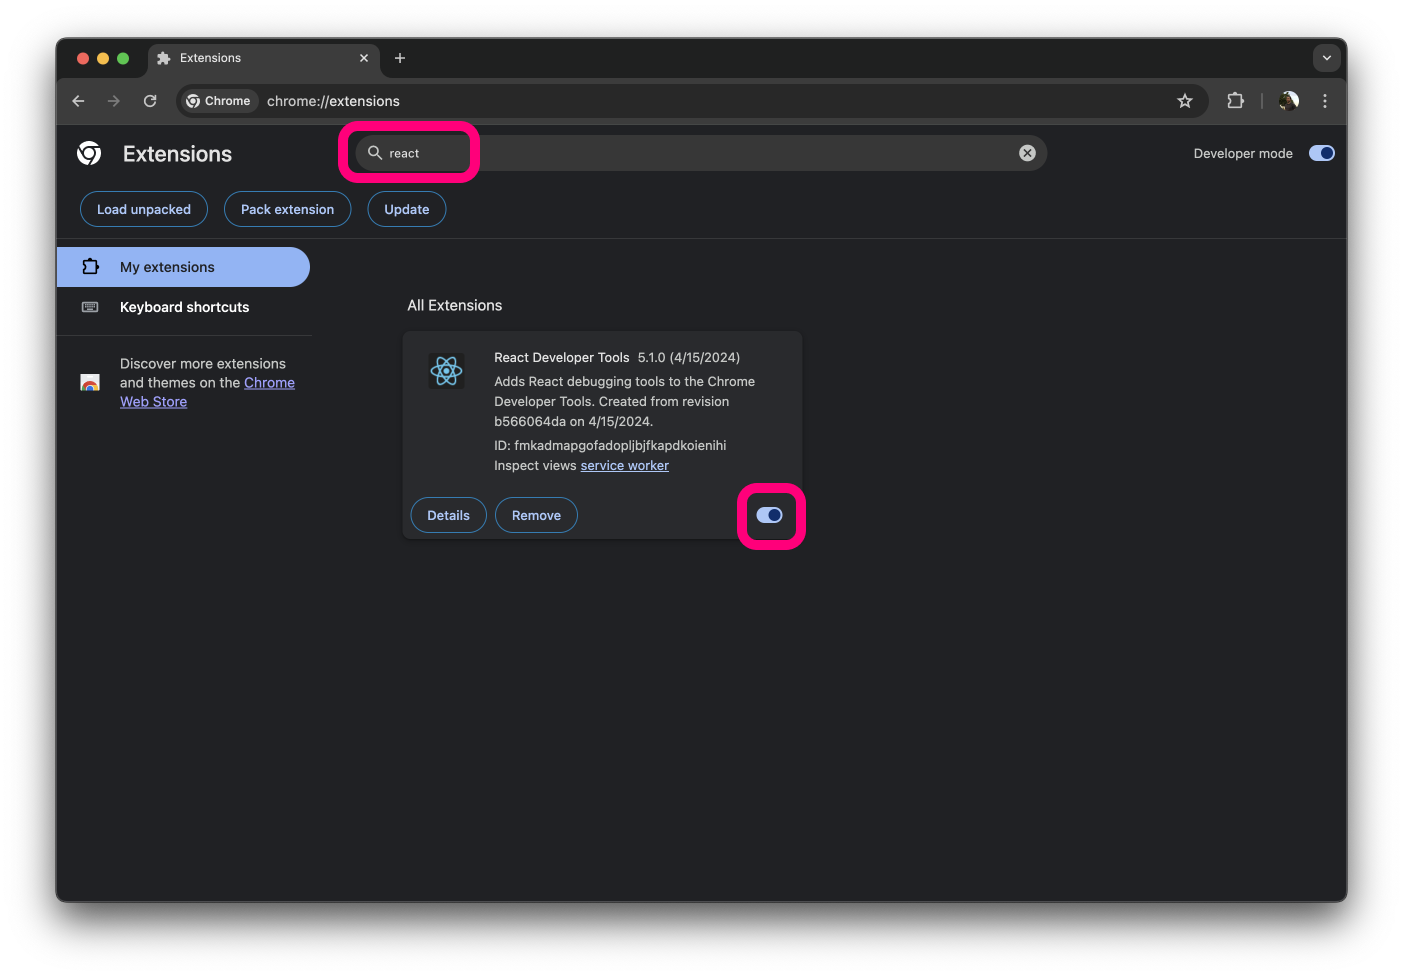
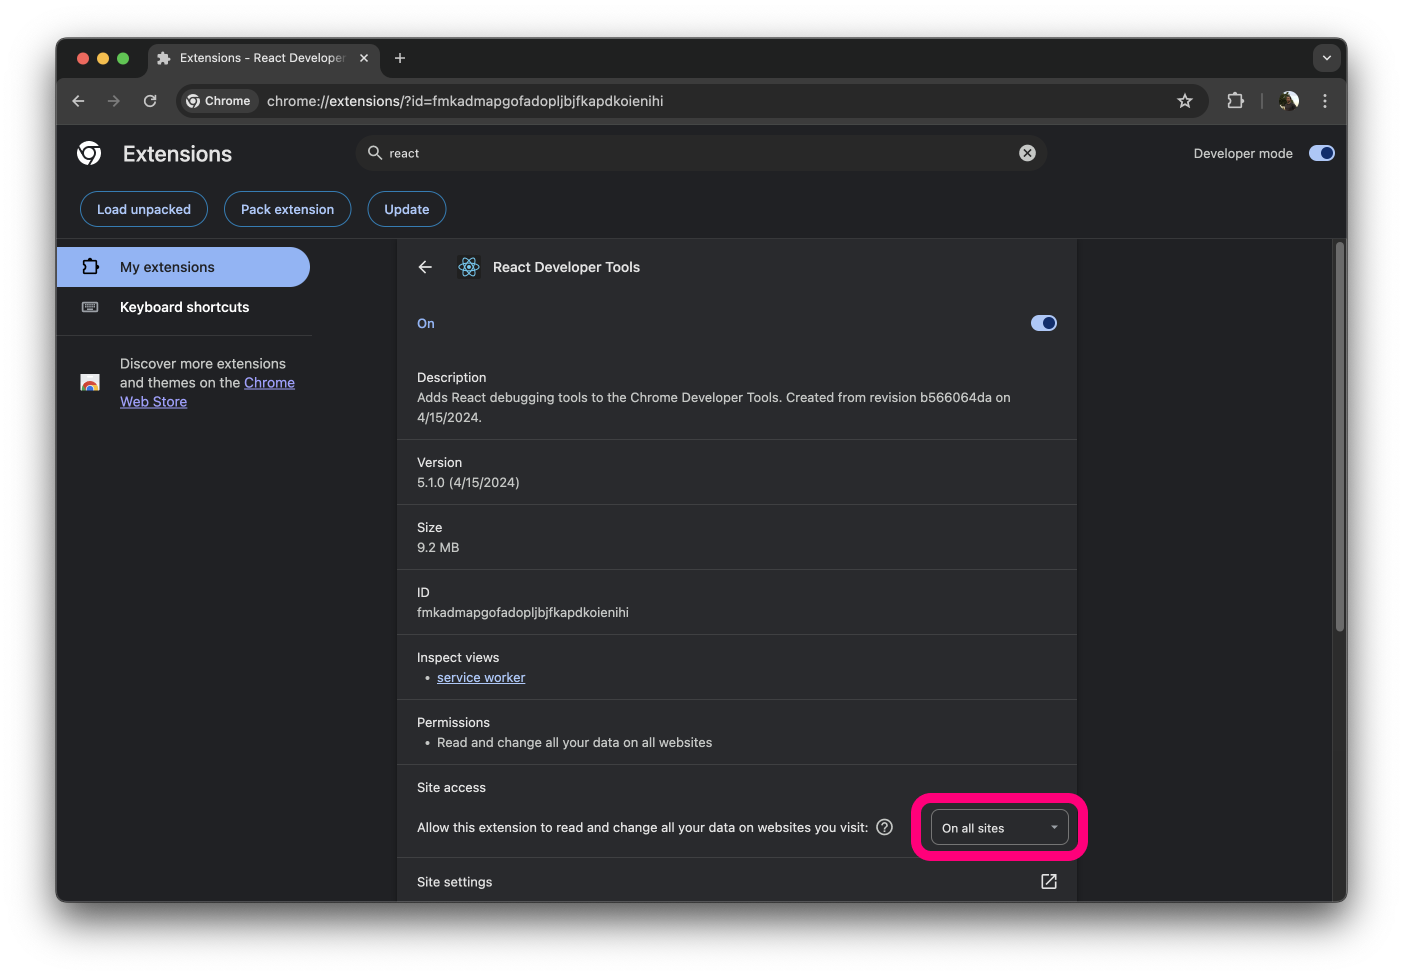
If DevTools fails to show up, it could be because it doesn't have access to the React sites you're viewing in the browser.
To fix this, type chrome://extensions/ into the address bar and hit enter, then search for the extension and make sure it's toggled on.
If that doesn't fix the issue, click the "Details" button and make sure you grant an "On all sites" access under the "Site access" option
Conclusion
From inspecting the component hierarchy and modifying state and props to profiling performance and understanding complex re-renders, React Developer Tools offers a comprehensive set of features that can improve the quality of your React applications.
Whether you're a beginner aiming to have a better understanding of the inner workings of React, or an experienced developer looking to optimize your applications, investing the time to master React Developer Tools will be profitable in your development processes.
Learn React and Next JS
Are you ready to dive deep into React and start creating real-world applications? Enroll in my React and Next JS course on Udemy! You'll learn through hands-on coding as we build an incredible 2048 game from scratch with cool animations.
Join now and start your journey to becoming an employable React developer!
Click to get started