
By Anton Lawrence
When it comes to debugging, the tool you use is extremely important and can determine how easy is is to fix problems within your code.
In the early days, the debugging process was quite a challenge. With the distinct lack of reliable debuggers, developers turned to several hacks.
For instance, when debugging a mobile app or website, you would recreate issues on your desktop and then use Chrome developer tools and similar toolkits.
Unfortunately, these hacks were not as effective — you had to constantly shift back and forth from your desktop browser and mobile device.
Fast forward to today, and we have a powerful suite of tools that allow you to debug defective code running on a different device as if it were local code. Best of all, these remote debugging tools not only address the debugging challenges but also enhance collaboration across development teams.
In this post, I have put together the top ten remote debugging tools which can be reliably used to debug your code remotely.
Rookout

Rookout is a tool that brings agility to the debugging process. It can be used to debug JVM, Node.JS, and Python code in both serverless and containerized applications.
The beauty of Rookout lies in its ability to allow users to debug both staging and production applications quickly and securely. It eliminates the lengthy and complicated debugging processes by providing all the data needed in a matter of seconds.
The on-demand data provided by Rookout ensures developers can understand and debug issues lying within their code without coding, redeploying or restarting their applications.
With Rookout, you can remotely debug live Electron apps. Rookout’s shareable interface allows developers to set non-breaking breakpoints in troublesome Electron apps.
The tool gives you complete visibility into your app's performance, so you can trace issues and develop appropriate fixes. Rookout makes all this possible without the need to install another software on the end-user
Highlights
- Easy to get started
- Seamless Git integration
- Integrates with a range of tools including Slack, Datadog, Sentry, Sumologic, and more
- Interaction tracking and screen sharing capabilities
- Provides comprehensive debugging data in real-time
Visual Studio Code
Visual Studio Code is always a top pick for every developer working with .NET. It has a ton of features to facilitate both local and remote debugging. With this tool, you can set conditional breakpoints and log points.
It also allows you to inspect variables. For remote debugging, you will need to install the VS code remote development extension pack. This package has three extensions that provide everything you need to launch, monitor, and accelerate your remote debugging loop.
Highlights
- Free to use, cross-platform operations
- Highly active development community with Microsoft backing
- Integrated Git control
- Supports a wide array of extensions and customization options for workflow enhancement
- Automatic error checking and color coding is great
RubyMine
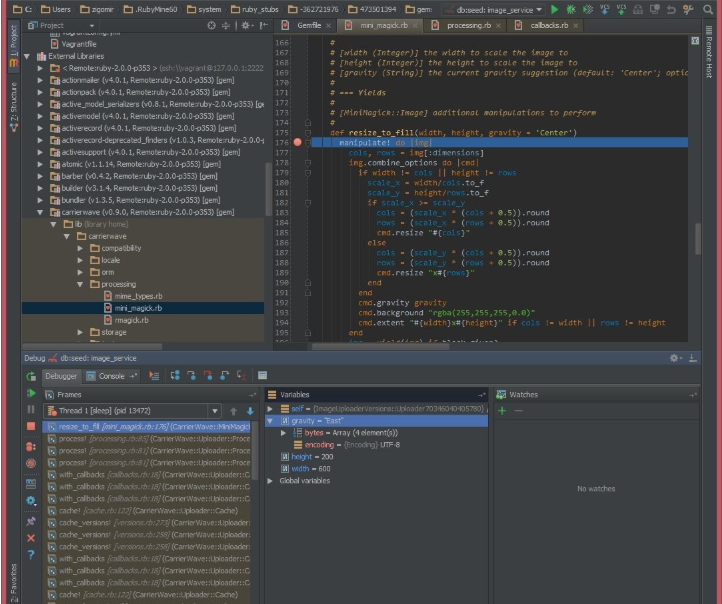
RubyMine is a powerful and intelligent cross-platform IDE that allows you to debug Ruby on Rails, CoffeeScript, JavaScript, CSS, ERB and HAML, and more. Its advanced built-in debugger allows you to set breakpoints and define hit conditions with ease.
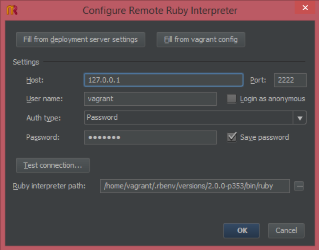
JetBrains' RubyMine provides two ways to debug applications that run on remote devices. First, you can add the remote Ruby interpreter and configure mappings between local and remote project files, then launch your debugging session.
Alternatively, you can run applications on the remote device then add the Ruby interpreter.
Once done, configure mappings between files and bind to a running process. The latter is especially helpful when debugging an application that you cannot launch directly from your IDE.
Another great thing about this tool is that it allows you to launch multiple debug processes simultaneously.
Highlights
- RubyMine is based on the solid intelliJ IDEA platform
- Good support for ruby-related frameworks and technologies
- Autocomplete feature is pretty good
- Good Git integration.
- Supports multiple plugins
- Integrates seamlessly with rails
PyCharm
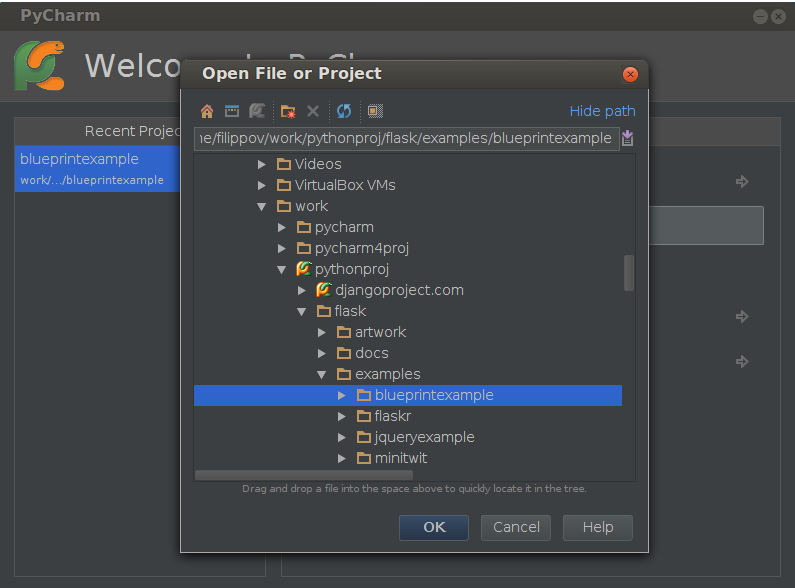
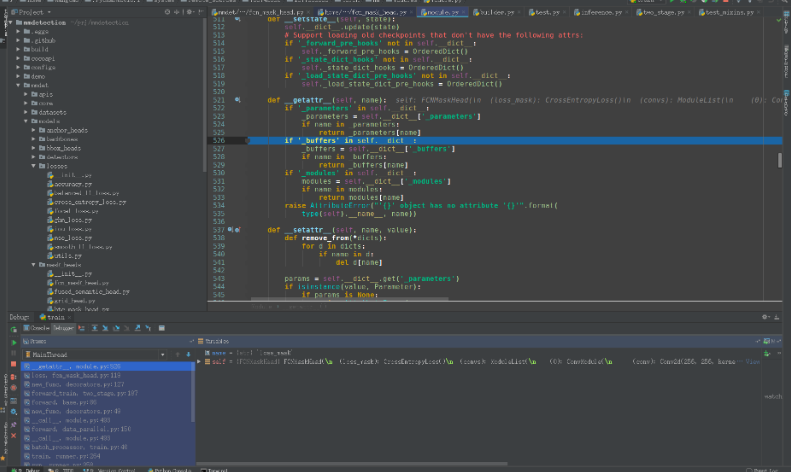
PyCharm is another robust IDE developed by JetBrains for Python. This intelligent code editor is equipped with remote development capabilities, including running, testing, debugging, deploying and applications on virtual machines and remote hosts.
The debugger offers several breakpoints, frames view, watches, stepping modes, remote interpreters, and a debug console.
Some amazing features of PyCharm include sophisticated auto-completion, excellent refactoring support and seamless integration with tools such as Django, IPython, Docker, Vagrant, and Pytest.
Additionally, PyCharm is a wonderful cross-platform development tool. Other than Python, it supports JavaScript, Cython, CoffeeScript, TypeScript SQL, HTML/CSS, Node.js, AngularJS, and more.
Highlights
- Awesome connectivity with multiple databases for querying within the IDE
- Searching and installing packages is easy
- Automatic code completion
- Git visualization
- Shows code errors on the fly and facilitates easy fixing
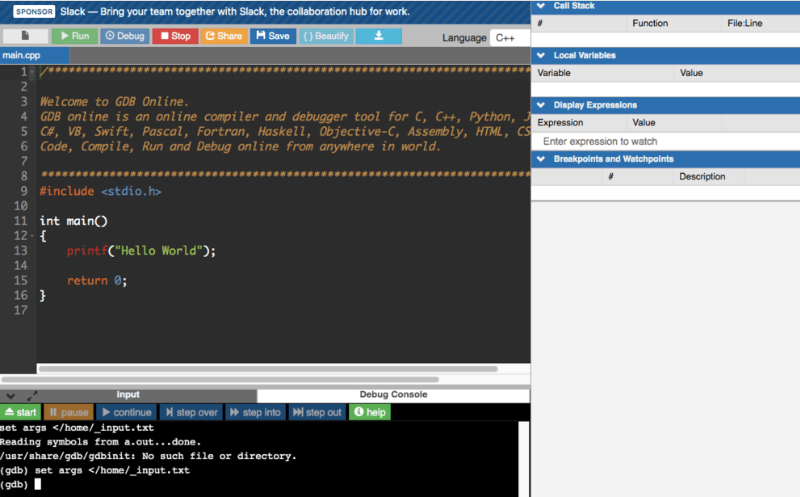
GDB
GDB can be effectively used to debug programs on another computer. To perform remote debugging, you will need to run the GDB utility in the host system. Additionally, you must run gdbserver on the target system so that the two utilities will communicate through a network or serial line using the GDB remote serial protocol.
There are two configuration options for remote debugging with GDB/gdbserver. The first involves using the remote GDB server to automatically build and upload application code to the remote machine.
The second option is using GDB remote debug where you should have the executable files.
Highlights
- Easy to use and trace faults within code
- Cross-platform and wide language support
- Effective for core dump analysis
Eclipse
Eclipse is a renowned IDE for Java development that also supports languages like Python, Ruby, C# and, PHP. The Eclipse IDE is equipped with advanced features for development and debugging, making it an all-rounded tool.
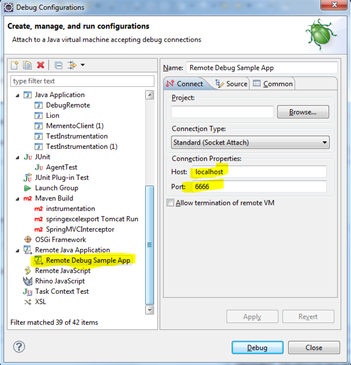
One of the most impressive features on Eclipse is the platform’s debug perspective that shows detailed debugging information such as breakpoints, variables, call stacks, and threads side by side.
Using Eclipse, you can step through program execution, suspend and resume threads, evaluate expressions and inspect values. Managing remote debugging configurations on Eclipse is quite easy and straightforward, which makes the tool more popular among developers.
Highlights
- Automatic code completion
- Good refactoring support
- Excellent navigation capability
- Helps with syntax checking for clean and efficient code
- Git Integration
Zend Studio Debugger
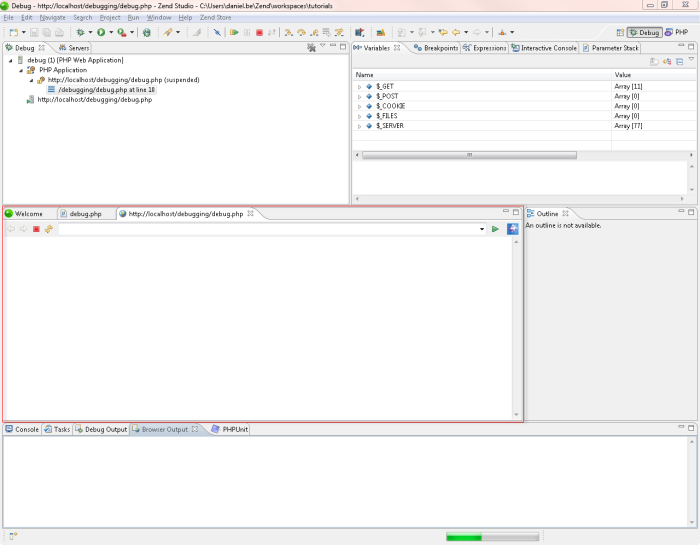
The Zend Studio is a professional IDE that supports PHP code editing, testing, debugging, and more.
It is tightly integrated with the Zend Server, thereby creating a complete PHP environment that facilitates easier analysis of problems detected in staging and production environments.
Zend also provides a PHP extension that users can install on web servers to debug PHP scripts. Using Zend for debugging is relatively easy – you only need to open the source code, set breakpoints in the project, and run a debug session.
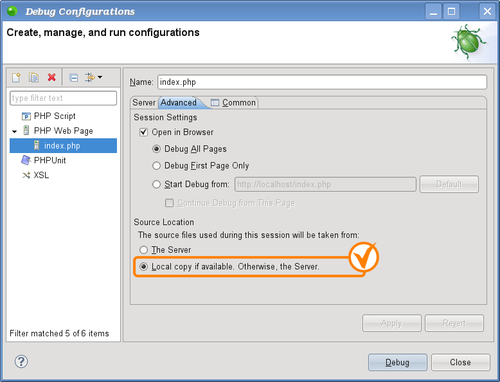
Remote debugging on Zend can be done in three ways. The first option is using the Debug URL functionality on Zend Studio.
Secondly, you can use the Debug as Web Page functionality within Zend Studio. And finally, using the Zend browser toolbar on Firefox or Chrome.
Highlights
- Ability to sift through project files in just a few keystrokes
- Highly efficient and speedy platform
- Large community support
- Great for building and debugging PHP applications
- The framework is exceptionally flexible
WinPdb
WinPdb is an excellent Python debugger that works well on Windows, Mac OS, and Linux systems. It is compatible with both Python 2.x and Python 3.x.
This debugging tool supports smart breakpoints, namespace modification, multiple threads, embedded debugging, and encrypted communication. For remote debugging, you will need to copy rpdb2.py (Winpdb’s command-line debugger) onto the remote machine.
Once finished, start the Python script with the debugger on the remote machine. From your local device, launch the GUI and attach the script to debug. At this point, you can use the basename or full path of the script as it is on the remote device. You can learn more about debugging Python scripts with Win PDB here.
Highlights
- Supports multithread debugging
- Encrypted communication for remote debugging
- Quicker than PDB
- Easy to use GUI with breakpoints, stack/variable inspection, and more
Use the above tools to make your remote debugging experience much better. Happy coding!