
By Goran Aviani
Recently I started focusing more on PHP, and I needed to set up a local debugging environment. Since there aren’t many tutorials on how to do it, I’ve encountered some problems on how to get the setup up and running.
By combining a few tutorials and spending a few hours on several forums, I came up with this text. The app I am working on runs inside of a Vagrant box which is shaky somehow. It collapses from time to time so I have to redo this setup, and therefore I know this setup works :).
The goal of this tutorial is to get the Xdebug working on your server and then point PhpStorm to Xdebug.
Let’s get started.
Prerequisites
If you don’t have Xdebug installed on your server but are using PHP7, you can do it by using Tailored Installation Instructions from the official Xdebug site here.
However, as my project is using PHP5, I’ve had to do it the old fashioned way: looking it up on forums.
In this tutorial I will assume you have Xdebug installed.
Getting started
First you need to find the location of the xdebug.so file on your server. Copy the location somewhere as you will use it later on.
locate xdebug.so
Now you need to navigate inside your server to a location: /etc/php5/apache2/conf.d/ and check if the file 20-xdebug.ini exists there. If it doesn’t exist, create one. You can create one using commands such as touch, vim, vi, nano and so on.
You can see my project is made in PHP5, so change your folder name/location according to your version of PHP.
Now open the 20-xdebug.ini file and paste this in:
zend_extension=”location to your xdebug.so file”
xdebug.remote_enable=1
xdebug.remote_port=9000
xdebug.remote_host=”your localhost address”
xdebug.remote_autostart=1
xdebug.remote_connect_back=0
xdebug.remote_handler=”dbgp”
xdebug.remote_mode=req
xdebug.remote_cookie_expire_time=-9999
xdebug.remote_log=”/tmp/xdebug.log”
xdebug.var_display_max_depth=15
xdebug.profiler_enable=0
xdebug.idekey=”phpstorm”
From the explanation of the 20-xdebug.ini file that is written bellow, you will see that some of these settings are not needed, or that they are set to a default value. I keep these values in the 20-xdebug.ini file because they are good to know.
Explanation of the 20-xdebug.ini file:
- xdebug.remote_enable — controls whether Xdebug should try to contact a debug client which is listening on the host and port as set with the settings
- xdebug.remote_port — The port to which Xdebug tries to connect on the remote host. Default is 9000.
- xdebug.remote_host — Selects the host where the debug client is running. Default is localhost.
- xdebug.remote_autostart — when this setting is set to 1, Xdebug will attempt to start a remote debugging session and try to connect to a client.
- xdebug.remote_connect_back — If enabled, the xdebug.remote_host setting is ignored and Xdebug will try to connect to the client that made the HTTP request. Default is 0.
- xdebug.remote_handler — Can be either ‘php3’ which selects the old PHP 3 style debugger output, ‘gdb’ which enables the GDB like debugger interface or ‘dbgp’ — the debugger protocol. The DBGp protocol is the only supported protocol. Default is dbgp.
- xdebug.remote_mode — Selects when a debug connection is initiated. This setting can have two different values: req — Xdebug will try to connect to the debug client as soon as the script starts. jit — Xdebug will only try to connect to the debug client as soon as an error condition occurs.
- xdebug.remote_cookie_expire_time — This setting can be used to increase (or decrease) the time that the remote debugging session stays alive via the session cookie. Default is 3600.
- xdebug.remote_log — If set to a value, it is used as filename to a file to which all remote debugger communications are logged.
- xdebug.var_display_max_depth — Controls how many nested levels of array elements and object properties are when variables are displayed with either xdebug_var_dump(), xdebug.show_local_vars or through Function Traces. Default is 3.
- xdebug.profiler_enable — Enables Xdebug’s profiler which creates files in the profile output directory. Default is 0.
- xdebug.idekey — Controls which IDE Key Xdebug should pass on to the DBGp debugger handler. The default is based on environment settings.
Save the file and restart the Apache server:
sudo service apache2 restart
Xdebug and PhpStorm
First you need to open PhpStorm and select Run > Edit Configuration. There you should select + (Add new configuration) and choose “PHP Remote Debug”.
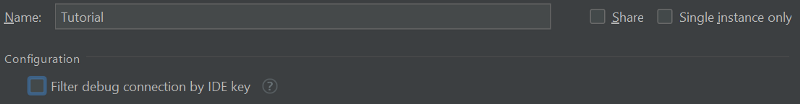
Change the name of the configuration from “Unnamed” to something else. I’ve chosen the name “Tutorial” for obvious reasons ;) Then check the “Filter debug connection by IDE key”.
Select the Servers button (…) and then select + (Add new Server).
- Rename your Server to something more soothing. I’ve chosen “localbackend1” in this example.
- In Host field type in your localhost. Set Debugger to Xdebug.
- Select “Use path mapping” and point to the folder of your app.
Click on Apply. You will be returned to the previous window where you will see that the IDE key is editable, and now you need to enter a key. I always put “phpstorm” or something similar.
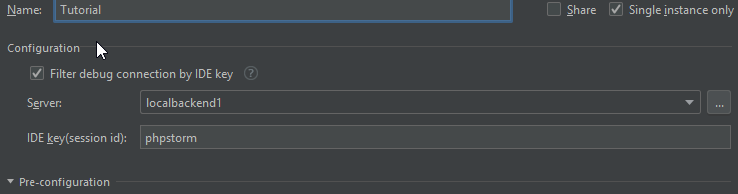
You will notice that the IDE key “phpstorm” is already in your 20-xdebug.ini file:
xdebug.idekey=”phpstorm”
You should also select Single instance only as it will stop you from launching more than one instance of the same project.
Click on to Apply and Voilà!
You are done with the setup!
Testing and wrapping up
Now you are complete. You should see the Tutorial configuration we created in the upper right corner of PhpStorm.
You can test it by setting a breakpoint in your project. Click on the “bug” button in the configuration window of Tutorial and then run your app.
That should be all, if everything is OK you should hit the breakpoint.
And remember, nothing beats the feeling of seeing run time values while debugging.
Thank you for reading! Check out more articles like this, and other fun stuff I make on my Github profile: https://github.com/GoranAviani