
By Akshaj Verma
Users on AirBnB can book a place to stay in over 34,000 cities across more than 190 countries. The goal of this blog post is to analyze the data, identify problems and opportunities, and come up with insights to increase revenue. This data was taken from Kaggle. If you’re interested in similar projects, have a look at my other blogposts here.
Why AirBnB though?
Well, I wanted to work on a real world data set that had real world implications with a wee bit of preprocessing. AirBnB was the most interesting dataset that I found. So, here we go.
Import the libraries.
Import the dataset.
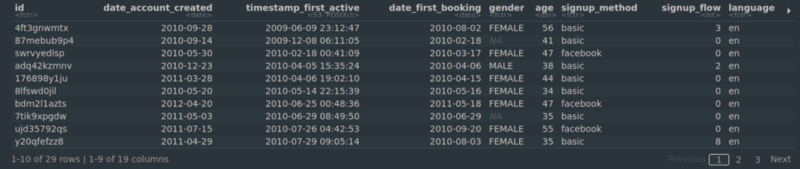
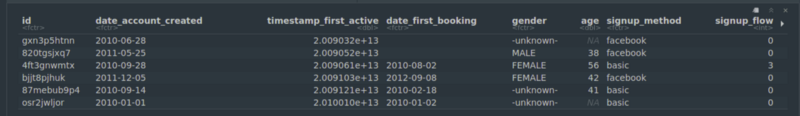 Data frame [Image[1]]
Pre-Processing
Convert to date-time format using lubridate. Replace -unknown- gender by NA.
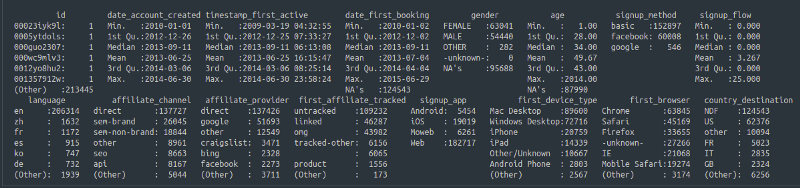 Summary of df [Image [2]]
- NA values in the
date_first_bookingcolumn say that the user hasn’t booked any room. - NA values in the
agecolumn means that the user hasn’t specified their age. We can fill dummy values in theagecolumn. - NA values in the
gendercolumn means that the user hasn’t specified their gender.
Note that there are 95,688 NA values in the gender column and 117,763 filled values. So, our analysis based on the gender demographic might not be entirely correct in the real world.
Number of NA values in each column of the data frame.
colSums(is.na(train_users_2))
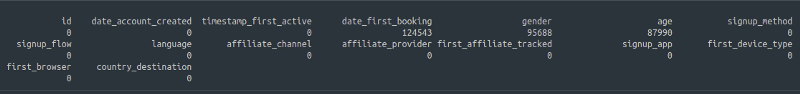 Number of NAs [Image [3]]
The age column contains values less than 18 and more than 80. In fact, age contains values as large as 104 and 2014. We will assign NA values to them.
To fill in the NA values in the age column, we’ll calculate the mean and standard deviation of the age column. Then we’ll generate n numbers as random integers between the mean and the standard deviation to fill in the NA values. n is the number of NA values in the age column.
Create a new column called age_brackets and add it to the data frame.
Finally, we’ll add 2 new columns to the data frame.
- The first column is
time_first_active_to_booking, which is equal to number of days betweendate_first_bookingandtimestamp_first_active. - The second column is
time_signup_to_booking, which is equal to number of days betweendate_first_bookinganddate_account_created
View the number of NAs per column.
colSums(is.na(train_users_2))
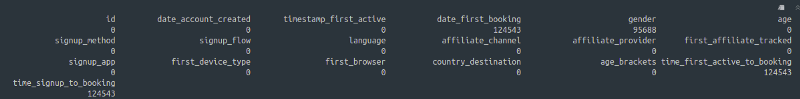 Number of NAs [Image [4]]
- As you can see in the table above, only the
date_first_booking,time_first_active_to_booking, andgendercolumns have NA values. This is totally fine. - NA values in the
date_first_bookingcolumn means that the user hasn’t booked any hotels yet. - NA values in the
gendercolumn means that the user hasn’t specified their gender.time_first_active_to_bookingis derived fromdate_first_booking, so it will have NA values.
Reset the gender levels. If you don’t do this, the -unknown- level will still show up in the levels(train_users_2$gender). We don’t want that, as we’ve already set all the -unknown- gender values to NA.
train_users_2$gender <- factor(train_users_2$gender)
We are done with the pre-processing. Whew. :P
Exploratory data analysis
Age, Gender, and Language
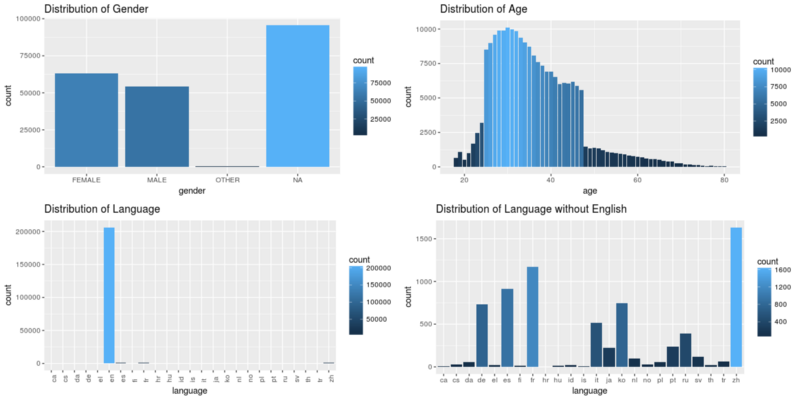 Age, gender, and language [Image [5]]
- We can see that there are a lot of missing values for gender. The majority of the users did not fill in their gender information on the platform.
- In the second plot, we observe that the age group of the majority of the users lies between 25 and 47 with the most users around the age of 30. This tells us that young and middle aged users are dominant.
- For a company based in the US, it isn’t surprising that the most used language on their portal/app is English.
- If we remove the English language from the plot, Chinese(zh) is the next most popular language on AirBnB, followed by French and Spanish. This suggests that AirBnB, after the US, is really popular in French and Spanish speaking countries/ communities. French is predominantly spoken in France, so we know this app is popular in France. But we can’t say that for Spanish, because Spanish is spoken in a lot of countries including Spain, Columbia, and the US, among many others.
This data, along with the user’s location, can be used to identify which regions (inside countries) use what language. Then, maybe, we could show targeted ads to those communities.
Age vs Gender
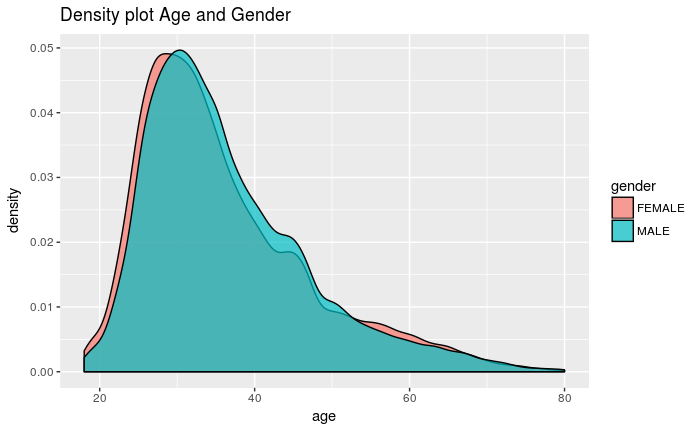 Distribution of Age vs Gender [Image [6]]
Based on age, there is almost no difference between number of men and women who use AirBnB. Men and women in their 30s are the most prominent users of AirBnB.
Affiliate Marketing a.k.a Advertisements
Before we begin to analyze the graphs, let’s understand what affiliate marketing is.
Affiliate marketing is a type of performance-based marketing in which a business rewards one or more affiliates for each visitor or customer brought by the affiliates’ own marketing efforts. Affiliate marketing is quickly becoming a powerful way to increase sales.
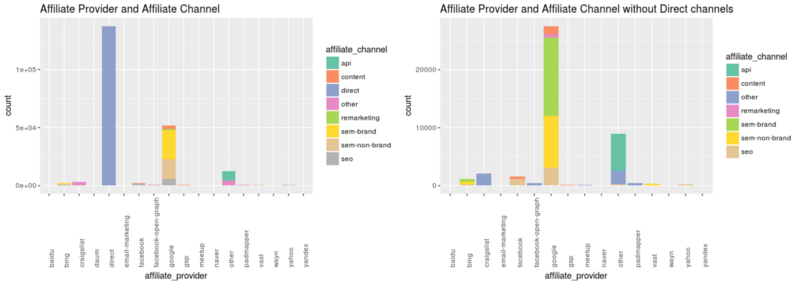 Affiliate Provider and Channel [Image [7]]
The 2 plots show the distribution of the affiliate channels used by different affiliate providers.
Direct marketing performed by AirBnB itself has had the most outreach in terms of marketing. Direct marketing is a form of advertising where organizations communicate directly to customers through a variety of media including text messages, email, websites, online adverts, promotional letters, and targeted television.
Google is a close second affiliate provider with semi-branding being its most popular affiliate channel. Bing, Facebook, and Craigslist are the other “major” contributors.
 Direct Marketing — Cable Car [Image [8]]
Targeted Marketing based on Age
These graphs show the comparison of the usage of the AirBnB platform based on the age demographic.
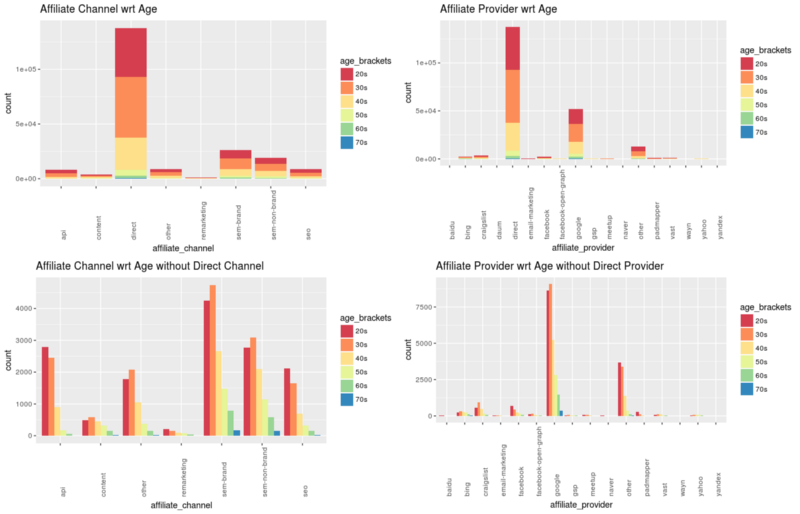 Targeted Marketing by Age [Image [9]]
Targeted Marketing based on Gender
These graphs show the comparison of the usage of the AirBnB platform based on the gender demographic.
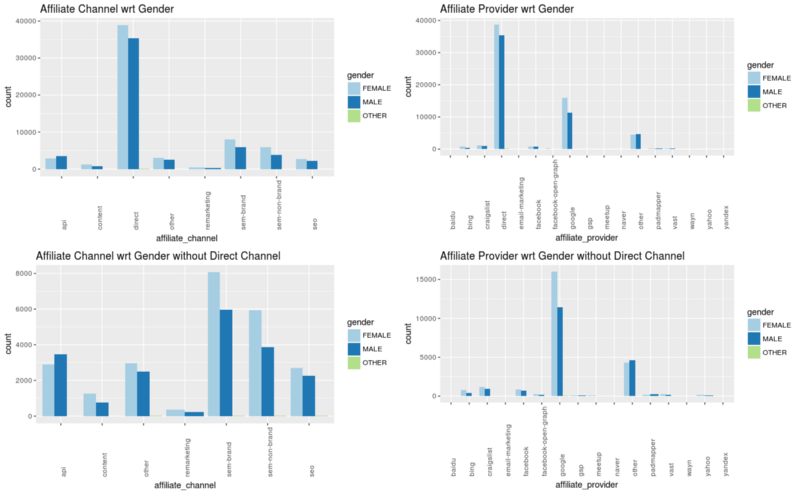 Targeted Marketing by Gender [Image [10]]
- More women than men are targeted by the direct affiliate channel.
- Same goes for the direct affiliate provider.
- If we remove the
directaffiliate channel, we observe the semi branded and semi non-branded are the two most popular channels followed by API and SEO (Search Engine Optimization). With the exception of the API channel, all other channels cater to more women than men. - Google as an affiliate provider is more common amongst women than men.

Signup App and Signup Method
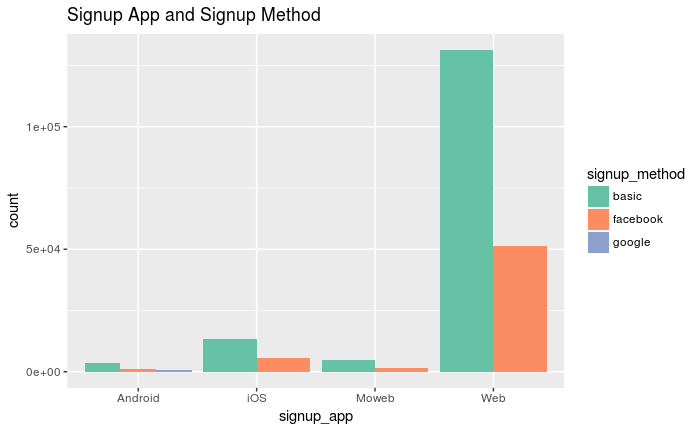 Signup App and Method [Image [12]]
- Signing up using email is the most popular option, followed by signup using Facebook. No body likes to link their Google account to their Airbnb account.
- An overwhelming majority of people access the AirBnB platform using browsers on their computers followed by their iOS app. The fact that Android users are less than iOS users might seem odd, but remember that AirBnB is an American company with it’s largest user base being Americans. iOS is more popular in the US than Android.
- People probably don’t use the app as much. This could be beacuse they don’t like the Android/iOS app’s UI or functionality. Maybe the web version offers more functionality and is easier to use. Or people aren’t aware of the AirBnB app.
Signup App and Method based on Age and Gender
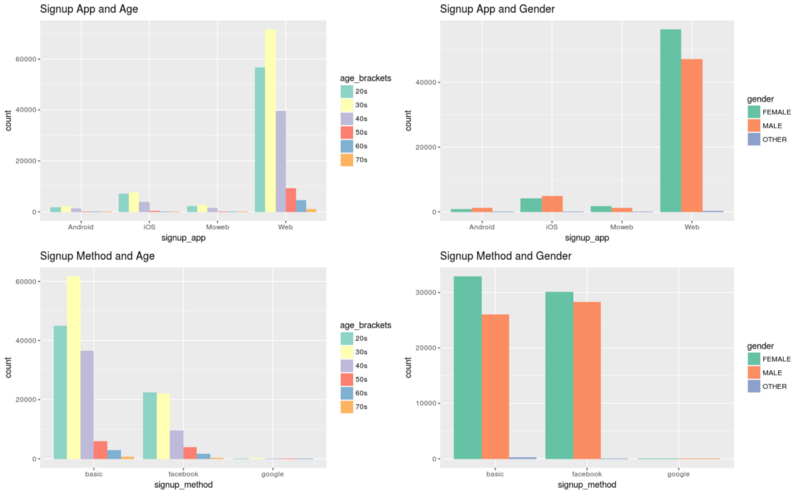 Signup Age and Gender [Image [13]]
- As expected, elderly people do not use smart phones at all to use AirBnB. A large number of people in their 20s, 30s, and 40s use their computers to access the AirBnB platform. One would expect the “tech savvy” teens and 20 year olds to use smartphones more, but that isn’t the case. (Note that there a lot more people in the 30s age bracket. This assumption might be wrong.)
- More women prefer signing up using their computers while more men prefer iOS/Android apps.
- A lot more people in their 30s prefer signing up using email as compared to Facebook. An almost weirdly equal number of people in their 20s and 30s prefer to signup using Facebook.
- More women than men prefer to use Facebook and email signup methods. Compared to the other 2, Google sign up method is like a 404 error, Does Not Exist.
First Device type vs Age and Gender
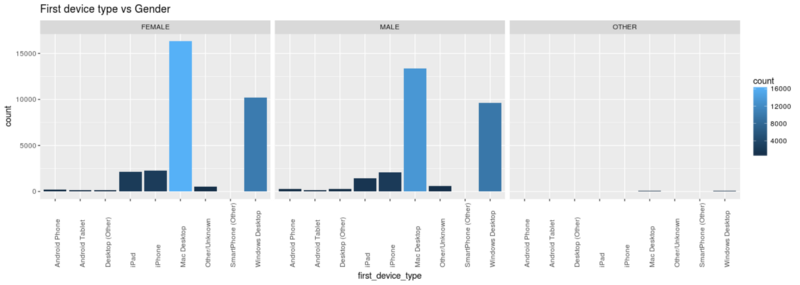 First Device Type -Gender[Image [14]]
- Macs are the most preferred laptops to access the AirBnB platform followed by Windows Desktop. Again, Apple is supremely popular in the US.
- iPhones and iPads are the second most widely used devices to access the AirBnB platform.
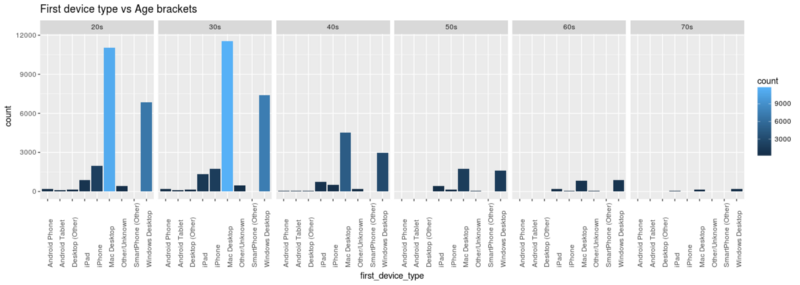 First Device Type-Age[Image[15]]
- Mac Desktops are highly popular amongst people in their 20s and 30s to access the AirBnB platform followed by the Windows Desktop.
- We see a decreasing trend in the usage of Macs as the age increases. There’s no disparity between Mac Desktops and Windows Desktops for people in their 60s.
- Smart phones, however, become unpopular as the Age increases.
Bookings and Accounts over the years
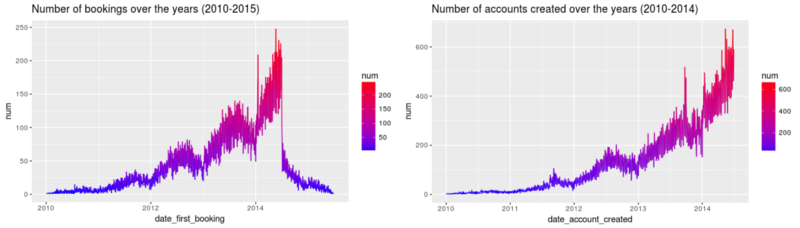 Bookings and Accounts [Image [16]]
- Number of bookings rapidly increase every year.
- The sharp drop in bookings for the year 2015 is because we only have data till 29–06–2015.
filter(train_users_2, date_first_booking >= "2015-06-29") - For the number of accounts created, we only have data till 2014–06–30.
filter(train_users_2, date_account_created >= "2014-06-30")
Number of First-bookings per year
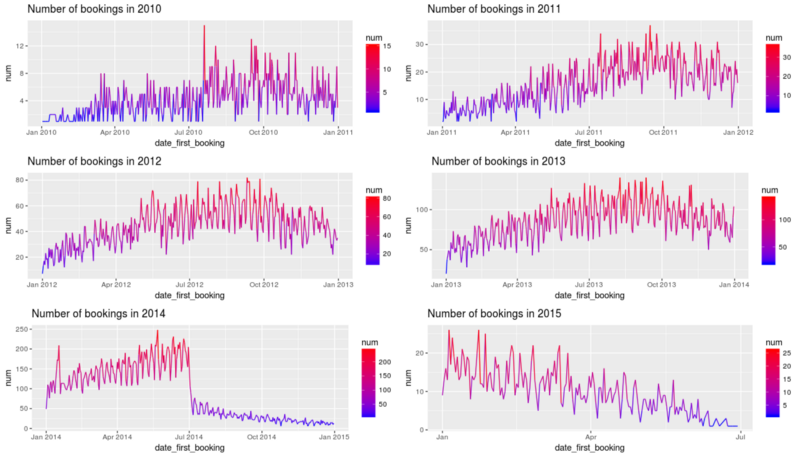 First Bookings [Image [17]]
- Number of first-bookings is at its lowest around January. This could possibly be because the year has just ended, so people don’t travel anywhere so soon. Also, cold outside much?
- Number of first-bookings always spikes up between the months of July and October. This could be in anticipation of festivals like Thanksgiving and Oktoberfest (or the summer holidays).
- However, we see a sharp drop in the number of bookings starting from July, 2014 until July, 2015.
“In July 2014, Airbnb revealed design revisions to the site and mobile app and introduced a new logo. Some considered the new logo to be visually similar to genitalia, but a consumer survey by Survata showed only a minority of respondents thought this was the case.”
Google “AirBnB 2014” to find the reason for the sudden drop in the number of bookings in 2014.
Number of Accounts created per year
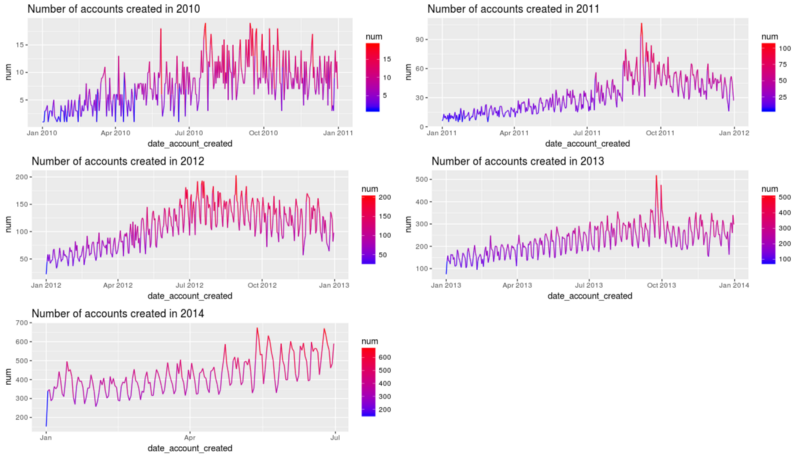 First Account [Image [18]]
- This plot follows a similar trend as the above plot.
- Number of new (first) accounts created is less around January and spikes around September and October.
- People probably create new accounts to book as well as compare prices between other services.
AirBnB could probably reduce prices or give more discounts and offers during the months of August, September, and October so that more people book places.
Time between Sign up and First booking based on Age and Gender
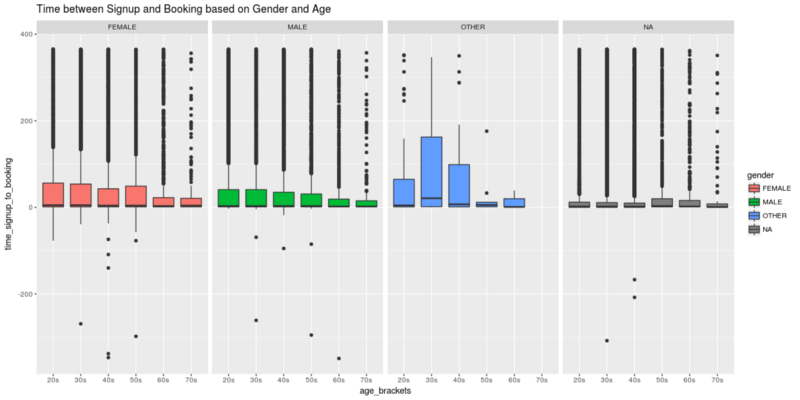 Booking — Signup [Image[19]]
The colored boxes indicate the interquartile range which represents the middle 50% of the data. The whiskers extend from either side of the box. The whiskers represent the ranges for the bottom 25% and the top 25% of the data values, excluding outliers.
- A heavy majority of people irrespective of age and gender book rooms on the day they signup. The median value is 0.
- You can see the “outliers” book rooms more 1000 days after signing up on the platform.
- The “wait-time” for the middle 50% users from each age bracket generally tends to decrease with age.
Time between the First Booking and First Activity
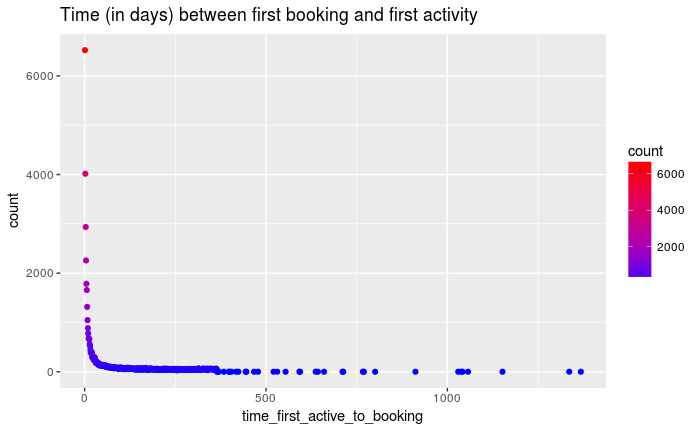 Booking — Active [Image [20]]
- Time between the first booking and first activity of the users 0 or close to 0 for a lot of people.
- There are people who’ve booked their first room more than 100 days after their first activity on the AirBnB platform. Damn.
Time between First booking and Signup
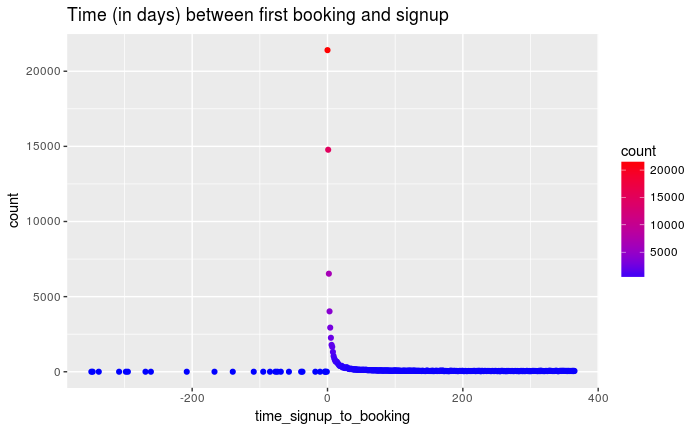 Booking — Signup [Image [21]]
- Here, we see that the number of days is negative for quite a number of people. People have booked rooms as long as a year before creating an account. Other than that, the data seems similar to the above plot.
- A huge number of people book the rooms on the same day they signup on the AirBnB platform.
Let’s analyze the negative values. How many negative values are there?
 Negative Time [Image [22]]
We see that there are only 29 negative values. This means that there were 29 users who were able to book their rooms without creating an account!
Let’s see in which years this happened. After filtering in only the negative values of time_signup_to_booking, that is people who booked rooms before signing up, we plot the following graph. This graph tells us that users could sign up before booking on the AirBnB platform from 2010 to 2013.
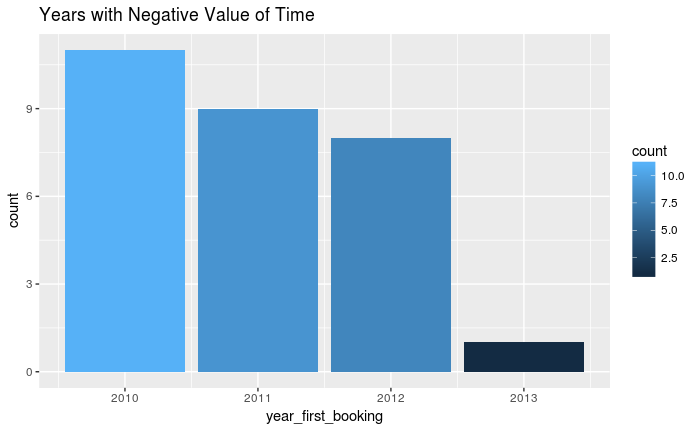 Count per year of booking before signing up [Image [23]]
The following statement was released by AirBnB.
“Up until early 2013 there was a handful of flows where a user was able to book before fully creating an account (by the definition of account creation we use today). After early 2013 this is no longer possible.”
Results
Booked vs Not Booked
NDF means no booking was made.
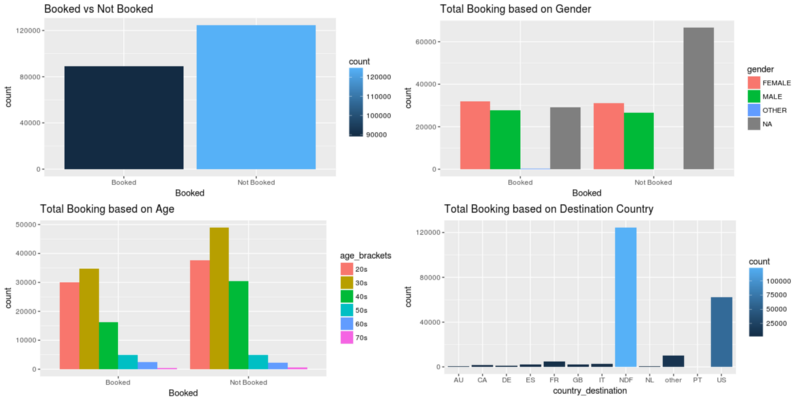 Booked vs Not Booked [Image [24]]
- There are clearly more inert users than active users.
- Male vs Female ratio is pretty much the same for users who book vs those who don’t. NA values, however, differ. There are lot of users who don’t provide their gender and don’t book any rooms.
- People in their 30s are the highest in the lot for both booking and not booking rooms. The ratio of Booked : NotBooked is less than 1 for people in their 20s, 30, and 40s. While the same ratio is kind of constant for people in their 50s, 60s, and 70s.
- As you can see, a huge number of people don’t end up booking rooms. The US has the most number of bookings after that. A large number of these bookings must be domestic, as the company itself is based in the USA.
The graph shows that people in their 20s, 30s, and 40s are AirBnB’s base customers.
Frequency of the Destination Country
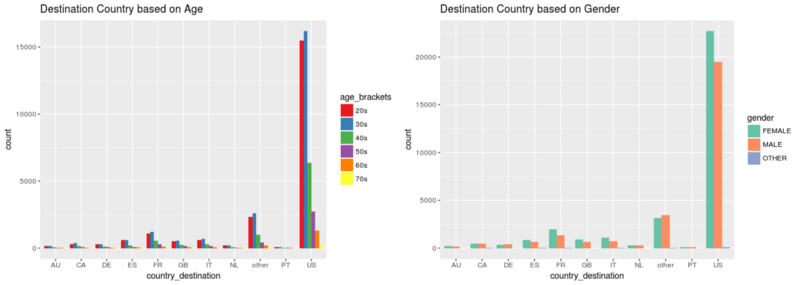 Freq of Destination Country [Image [25]]
- Highest number of inactive users (people who haven’t booked a room) are in their 30s.
- Women travel around slightly more than men using AirBnB.
- After the US and “other” countries, France is the next most popular destination.
- More women travel to France as compared to men, while more men visit Canada as compared to women.
Note that the travel need not be only international. It can be both national or international, as the country of origin of users is not provided in the dataset.
Effect of Affiliate Channel on the Destination Country
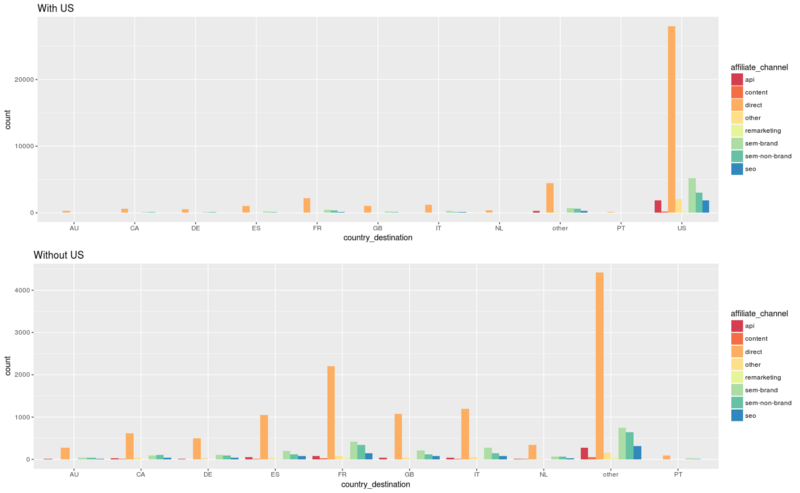 Effect of Affiliate Channels on Destination [Image [24]]
- Direct affiliate channels have played a major role to confirm bookings.
- Semi branding affiliate channel plays an important role to confirm bookings, especially in the US.
Effect of Affiliate Provider on the Destination Country
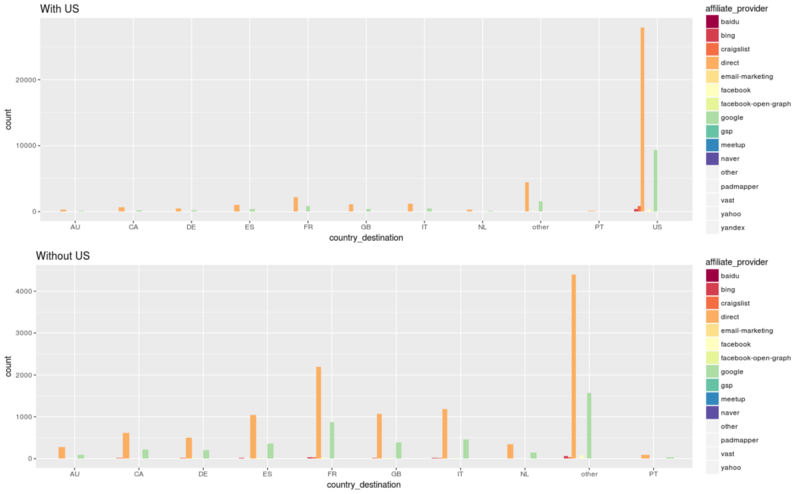 Effect of Affiliate Providers on Destination [Image [25]]
After the direct affiliate provider, Google plays an important role in confirming the bookings.
Monthly Booking Statistics based on Gender
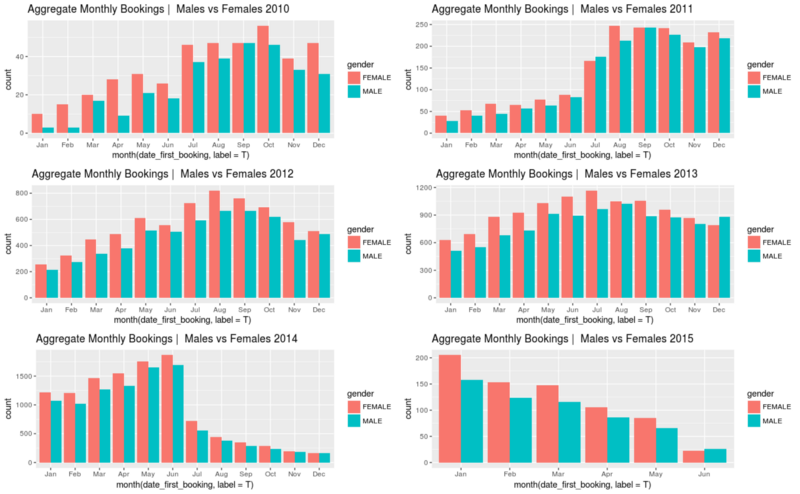 Monthly Bookings vs Gender [Image [26]]
- Women have always booked more hotels on AirBnB than men except for one month — December, 2013.
- We can see the total number of booking peaking around July, except in 2014 and 2015.
Weekly Booking Statistics based on Gender
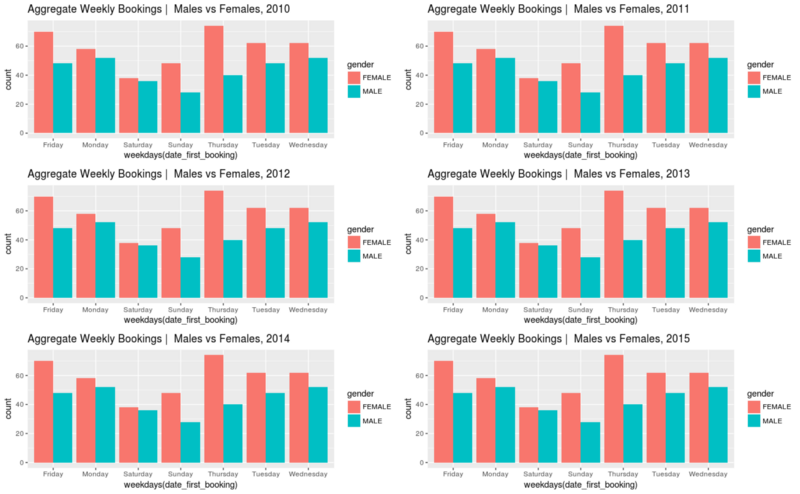 Weekly Booking vs Gender [Image [27]]
- Number of bookings is always the lowest during the weekend, ie. Saturday and Sunday.
- The number of bookings always peaks during Thursday and Friday. People probably book rooms for the weekend on Thursdays and Fridays.
- Hotel bookings by men drop a lot on Sundays as compared to Saturdays, but is the opposite for women.
- The number of bookings keep increasing from Monday to Friday only to fall on the weekend.
Daily Variation in the Number of Bookings
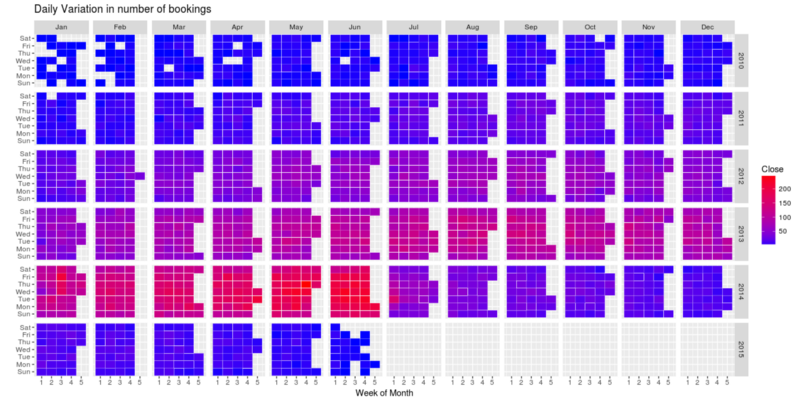 Daily Booking vs Gender [Image [28]]
We observe the AirBnB went from from 0–50 bookings per day in 2010 to almost 200 bookings per day in the early months of 2014.
The number dropped down to around 100 bookings per day thereafter.
Conclusions
Before I started working on this, I had a few preconceived notions about the kind of results I would get. For example, I did not expect iOS to be immensely popular. More so than Android.
Of the 432 million smart phones sold in the last quarter of 2016, 352 million ran Android (81.7 percent) and 77 million ran iOS (17.9 percent).
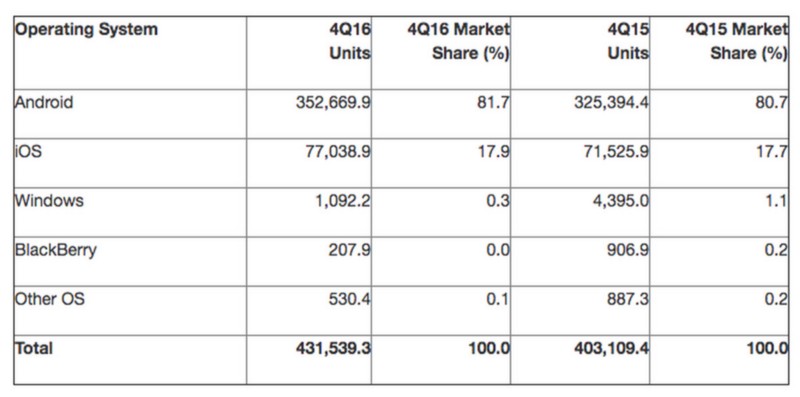 _Worldwide smartphone sales in the fourth quarter of 2016. (Thousands of units) [Image [29] credits: [Gartner](https://www.gartner.com/newsroom/id/3609817" rel="noopener" target="blank" title=")]
The sharp drop in the number of users around July, 2014 was also kind of unexpected. I mean, the company had a terrific growth rate until that point. It all started to go downhill after that. Although we have data only until mid 2015, who knows bookings might have picked up after that.
Who would’ve expected the number of bookings to drop on weekends? Certainly not me. But as it turns out, if you want to go out over the weekend, you gotta book your hotels before that. My bad. :P
Booking a room before creating an account? This part took me a lot of time to figure out. I thought I had erred. But when I finally Googled it, it turns out that this was possible before early 2013. AirBnB fixed the bug soon after.
The other thing that stuck out was, people in their 30s were more active on AirBnB as compared to people in their 20s. HOW? I certainly did not expect people in their 70s to travel, much less using AirBnB. _
Thank you for reading. Suggestions and constructive criticism are welcome. :) You can find me on LinkedIn. You can view the the full code here.
You can also check out my other blogposts Exploratory Analysis of FIFA 18 dataset using R, Getting Started With Hive, and GgPlot ’Em All | Pokemon on R.