
By Adam Henson
Using a post deploy step to automate performance regression testing in a continuous delivery workflow

In another post I went over how to analyze website performance using Lighthouse, and specifically how we can automate performance monitoring with Foo. In this post I’m going to demonstrate how we can step it up a notch by regression testing performance… automagically ?.
What is Regression Testing?
Regression Testing is a type of software testing to confirm that a recent program or code change has not adversely affected existing features. Adhering to best practice could include the below.
- Maintain a Strict Testing Schedule: Always maintain a continual testing schedule throughout the entire software development life cycle. Not only will this quickly force the team to adapt to a frequent testing regimen, it will also ensure the finished product is as well-tested as possible.
- Use Test Management Software: Unless your current software project is a simple self-developed side project, chances are you’ll have such an abundance of tests that tracking each will be well beyond the capabilities of a single individual or a spreadsheet. Thankfully, there are many different test management tools on the market designed to simplify the process of creating, managing, tracking, and reporting on all the tests in your entire testing suite.
- Categorize Your Tests: Imagine a test suite of hundreds or thousands of tests that are merely identified by a single
nameoridfield. How on Earth would anyone ever sort through that massive list in order to identify tests that are related? The solution is to categorize tests into smaller groups based on whatever criteria is appropriate for your team. Most test management tools will provide the means of categorizing or tagging tests, which will make it easier for everyone on the team to identify and reference a certain type of test. - Prioritize Tests Based on Customer Needs: One useful way to prioritize tests is to consider the needs of the customer or user. Consider how a given test case impacts the end user’s experience or the customer’s business requirements.
Check out this article for more info: “Regression Testing: What It Is and How to Use It”
What Does “Website Performance” Actually Mean?
Load times vary dramatically from user to user, depending on their device capabilities and network conditions. Traditional performance metrics like load time or DOMContentLoaded time are extremely unreliable since when they occur may or may not correspond to when the user thinks the app is loaded.
~ User-centric Performance Metrics | Web Fundamentals | Google Developers
Nowadays, life cycle of a web page load can be thought of more granularly. We can think of website performance metrics as being “user-centric”. When a user goes to a web page, they’re typically looking for visual feedback to reassure them everything is working as expected.
The metrics below represent important points of the page load life cycle. Each answers questions about the user experience.
- First Contentful Paint: Is it happening? Did the navigation start successfully? Has the server responded?
- First Meaningful Paint: Is it useful? Has enough content rendered that users can engage with it?
- Time to Interactive: Is it usable? Can users interact with the page, or is it still busy loading?
- Long Tasks (absence of): Is it delightful? Are the interactions smooth and natural, free of lag and jank?
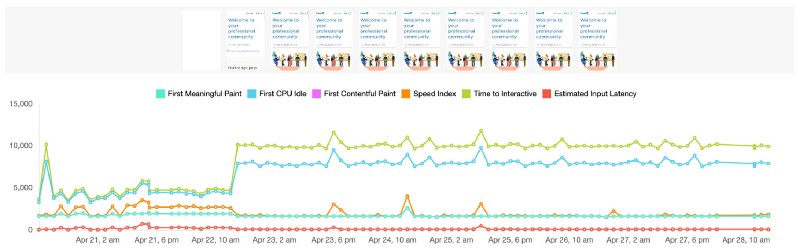
We can run performance audits manually or programmatically using tools like Lighthouse to provide values to metrics similar to the above. We can use a Lighthouse integration like Foo to automatically monitor website performance over time. In the example below you can see Twitter’s performance degrade and correlate it to an exact day and time! What if we could pinpoint this to an exact release? In the next section I explain how to do this.
How Can we Regression Test Performance Automatically?
We can accomplish automatic performance tests integrated as a post deploy step in a continuous delivery pipeline. We can do this by creating a free account with Foo and utilizing its public REST API. Follow the steps below.
- Create a free account with Foo. Verify your email by clicking on the link sent.
- Create a page on Foo where you can add the URL to the page you want to performance test.
- Click on the list item for your page from the screen above. This will direct you to the dashboard reflecting your page.
- Obtain the page API token by scrolling to the bottom of the page above.
- Trigger a test run by requesting the endpoint as detailed in Foo’s API documentation. A curl command would look something like
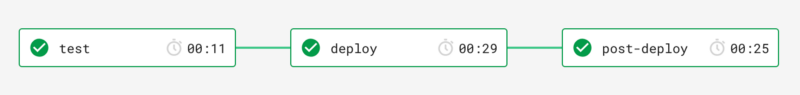
curl -X POST "https://www.foo.software/api/v1/queue/items" -H "accept: application/json" -H "Content-Type: application/json" -d "{ \"pages\": \"pagetoken1,pagetoken2\", \"tag\": \"My Tag\" }". - Add the above command as a post deploy step in your CD pipeline. You can find a full example in GitHub. Below a circleci snippet that actually defines this step.
From the example linked above our pipeline steps run on every commit to our master branch.
And voilà we are now deploying a release on every commit to master and running a performance audit on it automatically ⭐!
Conclusion
Foo provides many features to monitor and analyze performance. In this post we took a look into how we can utilize it to run Lighthouse performance regression testing automatically. Below are other features — most of which are free!
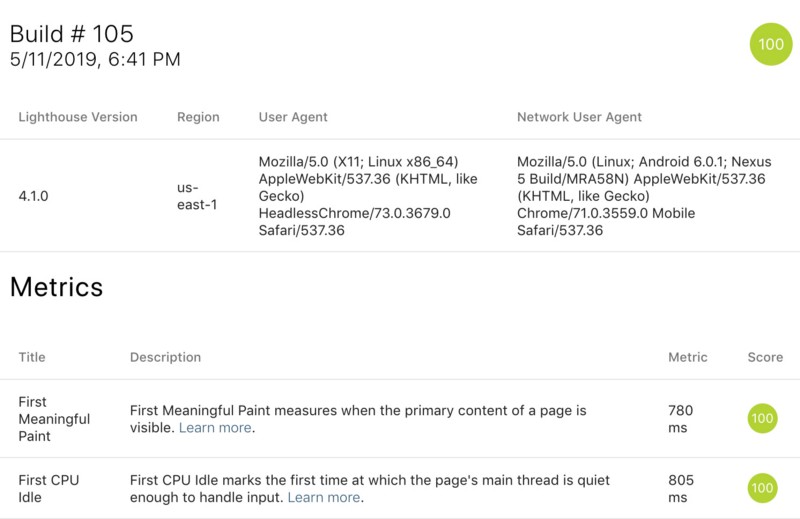
- Automatic performance audits, a timeline visualization and detailed views of results.
- Email, Slack, an PagerDuty notifications when performance has dropped, improved or become “back to normal”.
- Automatic health check pings and notifications.