
By Vivian Cromwell
I interviewed Irene Ros, who is the founding Director of Data Visualization at Bocoup where she has led visualization projects with partners like Google, The Guardian, The World Economic Forum, and Harvard Medical School (HMS) LINCS Center. Irene is also the Founder and Program Co-Chair of OpenVis Conf, a 2-day single-track conference about data visualization on the Open Web, entering its 5th year.
This article was originally posted on Between the Wires, an interview series featuring those who are building developer products.
Tell us a little bit about your childhood and where you grew up.
“I was the kind of kid who enjoyed building dollhouses but not really playing with the dolls.”
I was actually born in Kiev, Ukraine. When I was six, my parents moved to Israel where I then lived for the next ten years. It was a bit of an accidental move, but then I came to the States when I was 16. Both my parents always worked so I was very much on my own most of the time.
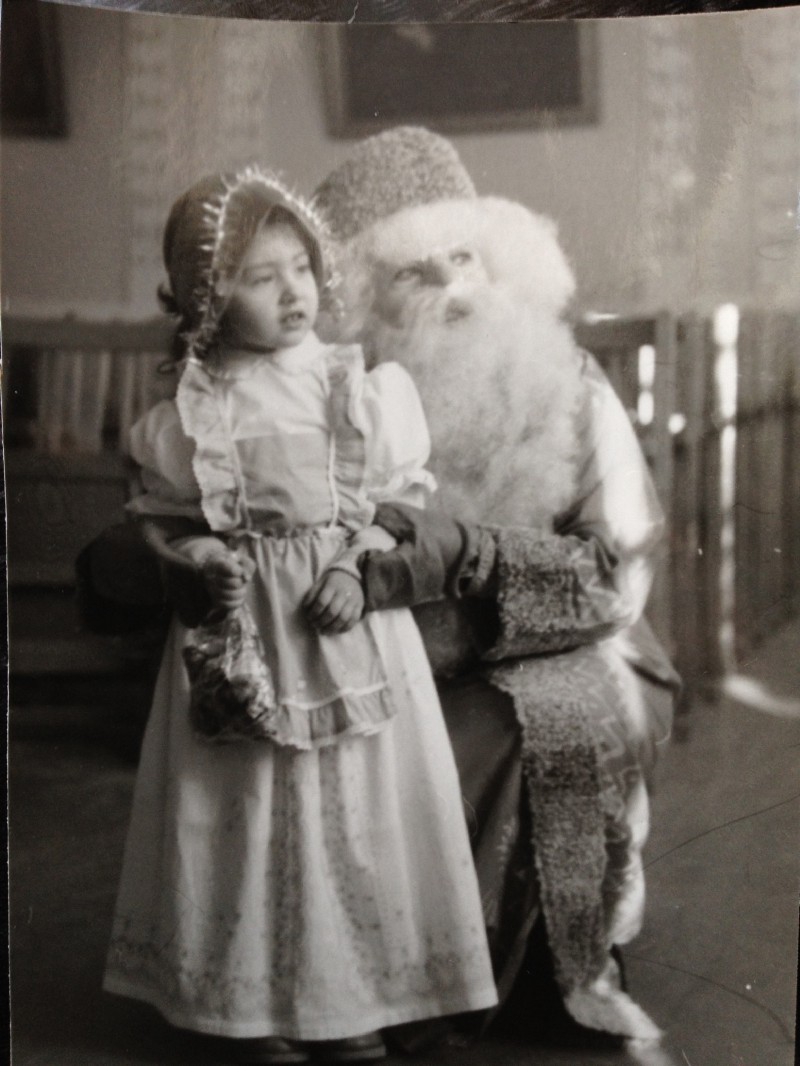 (Irene with Ded Moroz, Russian Santa Claus)
I loved math and science from a very young age and did little science experiments when I was home alone. It’s amazing I didn’t burn the house down. I was the kind of kid who enjoyed building dollhouses but not really playing with the dolls.
Tell us a little bit about your first programming experience.
My first programming experience was when I was nine. I had a cousin who was really into computers and I’d always hover around him whenever we visited. My parents, bless their hearts for recognizing that computers were going to be something big, spent an awful lot of money they barely had buying me one. This was before Windows even existed. All I had was Norton Commander. My cousin gave me this “BASIC Programming” book, and that’s how it all started.
I remember one of the first programs I wrote in BASIC. It could output the words of the Happy Birthday song. I was really excited.
That was the first memorable project I can think of. My high school in Israel had a really wonderful science and technology program, so I started taking computer science classes as early as ninth grade. As a consequence of starting so early, programming became a way of thought, a way of problem-solving for me. It was just a tool. I was very happy to be exposed to that early on. I think it’s still why I really love certain aspects of programming such as code refactoring, architecture and organization.
How did you start data visualization work?
My interest in data visualization started before Bocoup.
I studied Computer Science at the University of Massachusetts, Amherst and afterwards joined IBM as an engineer. I really loved my college experience, but it was very heavy on theory and algorithms, and it didn’t occur to me that making something beautiful and engaging was part of being a computer scientist.
Then one day in 2007 I just happened to go and see a talk at IBM, by Martin Wattenberg and Fernanda Viegas, who ran the Visual Communication Lab at IBM Research’s Collaborative User Experience group. During the talk, they showed this project called Many Eyes, which was really ahead of its time. It was like YouTube for data visualization. You could just upload your data and pick a visualization method, then you could share it with people by sending them a link. It had everything we expect of a modern system like that — commenting, remixing, saving and sharing a particular state — 10 years ago.
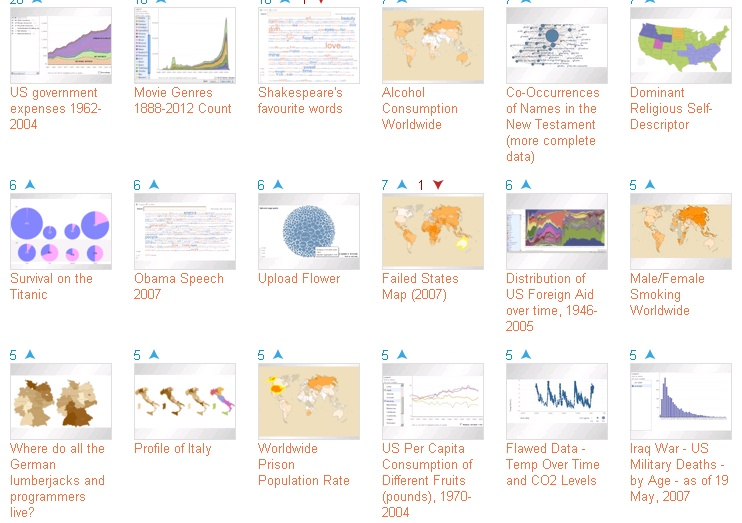
I was blown away because it was something I had never seen before. I ended up working with Martin and Fernanda for three years at IBM research and that was my gateway to data visualization. I am self taught in this field, but with their support and the support of other colleagues, I’ve learned a lot and appreciate the time they’ve invested in me.
From the get-go, we were creating things for the web, but it was challenging to navigate open-source licensing process at IBM at that time (IBM has come a long way since). I became comfortable enough looking through open source libraries, fixing issues locally or writing extensions, but I wasn’t quite ready to make PRs yet (Github barely existed then). It seemed like a distant world that was reserved for experts. I wanted to become that expert and really fell in love with the importance of open source — it allowed me to bring my ideas to life and I wanted to be more involved.
One day I Googled ‘Open Source Boston’ and Bocoup came up. I applied and here I am.

(Fun fact: http://boazsender.com/2012-10-30-how-bocoup-got-its-name.html)
What was data visualization like five years ago?
“Even though ‘data science’ is often used as a buzzword, it’s been great for raising awareness about the importance of thinking more critically of our data through applying techniques such as statistical analysis, predictive modeling and machine learning to name a few.”
When I started at Bocoup, the D3.js library didn’t exist. It was before every news publication was trying to make interactive content, except New York Times, who really led the charge on this front.
 _(NPM by numbers by Irene, using d3js. source: [http://npmbynumbers.bocoup.com/](http://npmbynumbers.bocoup.com/" rel="noopener" target="blank" title="))
D3.js is based on a seminal book in our field called the Grammar of Graphics, which provides a fundamental way of breaking down and assembling data visualization through primitive “components”. It’s been an underlying principle that many successful visualization libraries are built upon, such as ggplot in R. D3.js changed the field in a very fundamental way — it has enabled visualization creators to be incredibly creative in their work and make interactive content quickly.
When I started working with data visualization, the term “Data Science” didn’t exist either. That resulted in a lot of visualizations showing really basic aspects of the data: counts, averages etc. Even though “data science” is often used as a buzzword, it’s been great for raising awareness about the importance of thinking more critically of our data through applying techniques such as statistical analysis, predictive modeling and machine learning to name a few. Data Visualization has been an important part in this shift, both because it enables data exploration and improves the communication of final results — the more we understand our data, the better questions we can ask of it. The more interesting the questions, the more interesting the answers, and the more interesting our visualizations can be. I would say that no one should be creating data visualization without having some basic understanding of statistics at this point.
What is one of the most exciting data visualization projects you worked at Bocoup?
There are so many!
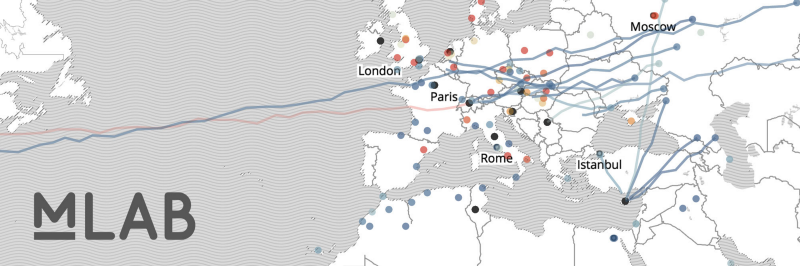
One of my favorites is a recent collaboration with Measurement Lab and Google Open Source Research team. Measurement Lab Visualizationsprovide a way to explore the largest collection of open Internet performance data on the planet. The data is open, free of charge, and comprises the largest open Internet performance dataset on the planet. Measurement Lab also offers visualization tools, so people can make sense of Internet performance across time and space. We partnered with them to build the next generation of their visualization tools.
 _([https://bocoup.com/work/measurement-lab](https://bocoup.com/work/measurement-lab" rel="noopener" target="blank" title="))
I love their mission and their amazing dataset, which goes all the way back to 2009 and offers incredible international coverage. The way it works is that anybody can run a test through their website. If you are in the United States and a few other countries, if you search for “speed test”, you will actually get an interface that will let you run a Measurement Lab test right away. Their methodology is much more effective and accurate than most other speed tests at this point.
We were really excited because they came to us and said, “We have this huge dataset and we want people to explore it in a pretty dynamic way, they want to be able to look at different time spans, locations or service providers.” It is a really interesting design problem because there were so many different types of stakeholders — Measurement Lab’s data has been used by political advocates and internet researchers alike, with very different goals. Because it is so large, it’s really hard for people to work with the raw data — they need infrastructure to process it and a lot of technical knowledge. We were grateful to Google who sponsored the project, and gave us unlimited access to their infrastructure to take these hundreds of millions of tests, and turn them into something useful and consumable on the web.
“I think it really captured a lot about our media culture, how we perceive gender and the way that we choose to represent it.”
The other project I have to mention is called Stereotropes. It was a team passion project that we did a few years ago. We were (and still are) really interested in text analysis and visualization. We came across a community called TV Tropes that catalogued and defined tropes in TV and film. Most interestingly, they had two list of tropes that were primarily associated with Male and Female characters, which we then used to try and gain a better understanding of how our culture defines male and female roles through adjective use in those tropes’ descriptions.
We built a really fun exploratory tool called Stereotropes that lets you explore those tropes. For example, people use words like ‘pretty’ to describe a lot of female characters or ‘strong’ to describe a lot of male characters. I think it really captured a lot about our media culture, how we perceive gender and the way that we choose to represent it.
 _(source: [http://stereotropes.bocoup.com/](http://stereotropes.bocoup.com/" rel="noopener" target="blank" title="))
I really love this project. We tried to encourage objective conversation on gender representation. I care a lot about the subject being a woman in engineering. We really wanted to provide our audience with a tool they could explore themselves to see some of these differences, and similarities!
We managed to engage a lot of people who were not related to engineering or data visualization. It’s something I always strive for — to get somebody who really does not understand technology, to care about what I’ve made.
You started OpenVis Conf 5 years ago, can you tell us about it?
OpenVis Conf was very much a response to my personal experience getting into this field. Because I was self-taught, I went through some struggles that I felt were unnecessary for other people to experience. For example, I saw a lot of beautiful work made by people I admired, but had no idea how to make it. I was inspired, but also unsure how to create similarly good work. I started OpenVis Conf with the goal of creating a community space that embodied a teaching spirit — every talk our speakers give is intended to teach our audience something. We want people to leave that conference with 100 ideas that they know how to pursue further. Our speakers have really embodied this value over the years and I’m really proud of the programs we’ve put together.
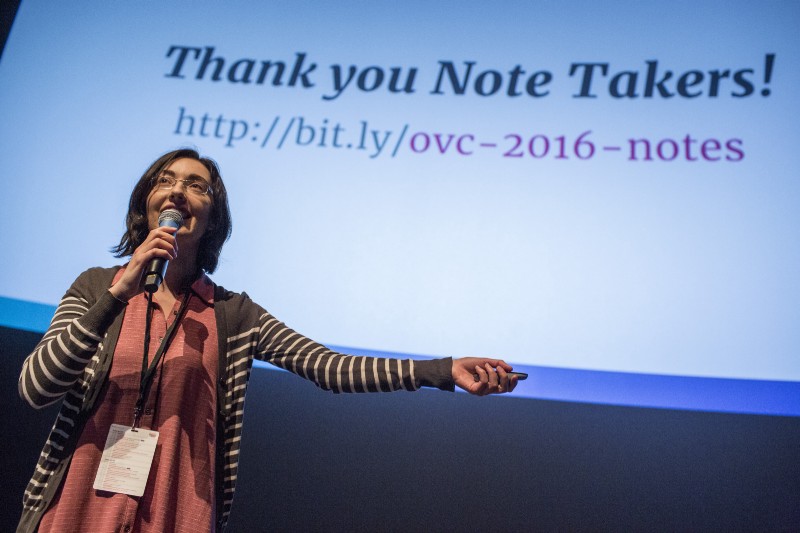
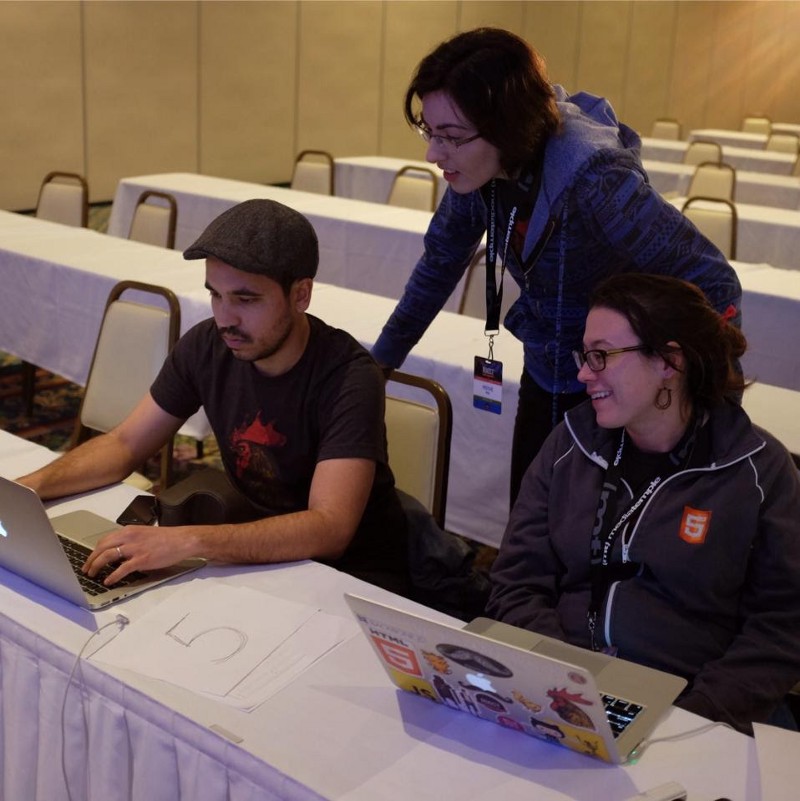
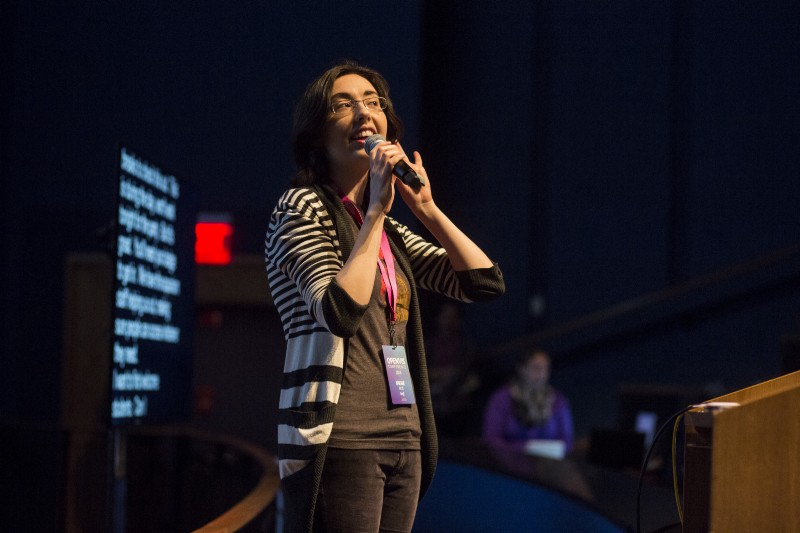 (Irene at OpenVis Conf)
I’m also really proud of our diversity efforts every year. Myself, my program co-chair Lynn Cherny, and our Programming Committee spend dozens of hours soliciting and reviewing talks from our community. We try very hard to create a diverse cast across many definitions of diversity: age, gender, race and sexual orientation. It’s a challenging task, but five years in I can definitively say it has only made our programs stronger every year. When I see an all white & male line up at other conferences, I cringe because I know they just aren’t doing the work.
This year is our 5th anniversary and we’re putting together a huge celebration. We just released our program, and we really can’t wait for the incredible lineup.
OpenVisConf 2017
_A two-day single track conference about the practice of visualizing data on the web_openvisconf.com
Can you talk about a difficult period you’ve had to go through, and how you overcame it?
“Overtime, especially now, I realize what a privilege that was — to be able to throw your work away. I realize that sometimes building something is just another step towards making something else.”
One of the biggest struggles I’ve had as a young developer, is that I was very attached to my code. I felt like my code and the things I made were a reflection of me. I wasn’t able to evaluate objectively: “Is this thing good or is this thing bad?”
My team leads at the time did an amazing job of helping me navigate that question. I’d build some kind of prototype and I’d spend weeks doing it, and then they would say: “I don’t think this is working, let’s just try something else.” And I’d just be so hurt, I’d take it personally, and it felt like failure.
Overtime, especially now, I realize what a privilege that was — to be able to throw your work away. I realize that sometimes building something is just another step towards making something else. There is nothing I love more than just prototyping something and having someone call out that it’s bad because they see something that I don’t. As a result, I get to go and improve it and make something better. As a developer, it’s hard to step out of your bubble and not treat your code as something precious, but code is just a tool to get somewhere — to build something useful or solve a problem. In and of itself, it’s nothing.
I really enjoy doing design activities as part of the projects we work on at Bocoup, because it’s really important to generate lots of ideas and then throw lots of them out. I constantly throw code away. I’ve developed a certain lack of attachment to the code that I produce. If someone comes to me and says, “There is a better way to do this.” I’ll just say, “Thank you,” and be very happy to start anew or refactor my code.
It was a painful lesson to learn but it really frees me from being locked into a set of tools and a set of practices. The moment I could let that go, I really grew as a developer, especially combined with asking for help and feedback.
It’s funny because I often find that folks who are newer to engineering ask a lot less questions than those who have been in the field much longer. Now I can ask five questions a day of my teammates as I’m working on something and it’ll take them two seconds to give me an answer and I can move on with my life. Newer engineers tend to take much longer to really work through something, often on their own. While it’s admirable, it’s not a good use of their time. It’s something I really watch out for during our interview process, for example.
I think that was a pretty big eureka moment for me. It wasn’t a moment, it was a long, long process.
How do you help junior developers overcome this?
“I’ve had a lot of failures just like everyone else, but we’ve built a company where failure is an important part of our culture.”
First, I think it’s really important to set up the team and our clients to understand that failure is an expectation. We strive to fail fast, but it’s really important that we iterate on an idea and find the right answer. To do that, we designate time specifically for design, brainstorming and prototyping. We meet often as a team to offer critiques of our work to each other, and we spend a lot of time discussing the work of others to learn what works and what doesn’t.
I think working as a team in this way has allowed us to create a safe space for failure. I don’t even think we notice it anymore. We might generate 30 ideas for a project and it’s obvious not all of them are going to make it, and there’s always some contention around refining a design, but the goal is always shared. We want to make something great and we’re in this together.
Establishing a culture of feedback is something we take very seriously at Bocoup. I’ve had a lot of failures just like everyone else, but we’ve built a company where failure is an important part of our culture. We work together to Identify it, move through it, and support each other in that process.
How do you balance between open-source and monetization for your data visualization projects at Bocoup?
Bocoup is primarily a consulting company. People come to us to help them solve their problems using open technology and practices. We build tools, websites, and applications. The same is true for my team, people come to us either because they need help understanding their data or they need help with designing and building the right visualizations to communicate something or enable and engage their audience.
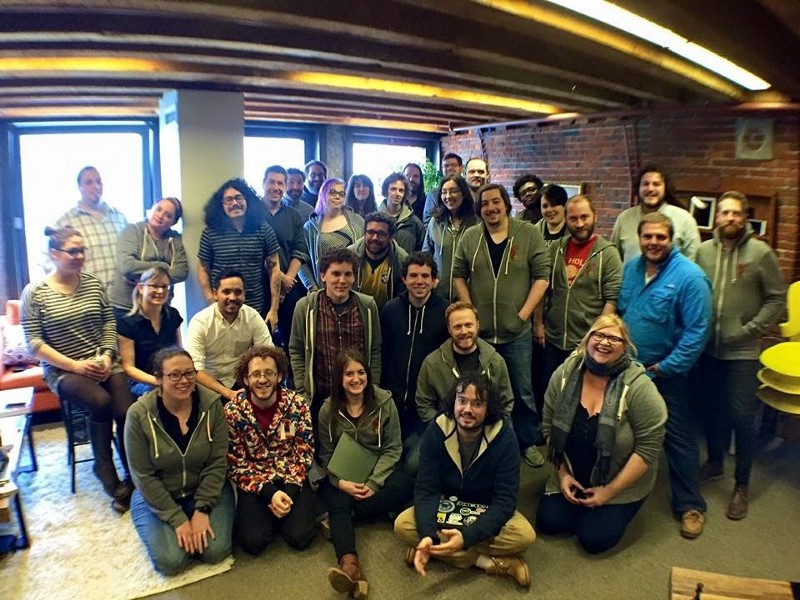 (Bocoup team pic)
I would say modern software engineering requires the use of open source tools. There are rarely commercial equivalents of equal quality. Most of our clients understand this, and their engineering teams certainly do. To us, using an open source stack enables our clients to build systems that can be maintainable and extendable, that can have a community and allow their engineers to feel supported.
“I think open source isn’t just about open code. It also comes down to using more open practices around the way your team works.”
In terms of our own contributions, as an engineer you always have the drive to modularize your code and to be able to make reusable components. That naturally leads to being able to release some part of your work as separate open source components, or contribute some patches back to an open source project. My team has worked with D3 extensively in our visualization projects, contributed integral community tools, the current D3 logo, and have created a framework for organizing visualization code made in D3 with our d3.chartto demonstrate the importance of modularity.
I think open source isn’t just about open code. It also comes down to using more open practices around the way your team works. Many of us have worked on big open source or client projects at Bocoup. When you work in such a distributed way, with a lot of people across the world in different time zones, you have to become really good at planning, documentation, coordination and communication. We bring a lot of those practices to existing teams to try and help them be more effective.
What are the challenges today in data visualization field, both from the technology point of view as well as the community?
This isn’t a new problem, but a challenge we will always face: there is a tension between aesthetics and usability, and how to incorporate both is a challenging question. We have seen lots of examples of things being built that go too far one way or the other, but we have lots of conversations as a community about that. It’s a balance we will continue to navigate.
There is also a data literacy question. Everybody wants to make a new visualization style that’s never been used before, and it kind of blows everybody’s minds. That’s really cool, but you are probably going to impress 200 people in the field and then confuse everyone else who, as a consequence, won’t engage with what you’ve made. Are the things that we are creating working? Are people understanding what we are making? Are they actually engaged with what we are trying to say? Is what we’re making helpful to anyone?
We don’t have a great way of evaluating what’s working on a system level. We have lots of ideas on how to study small components (such as specific visualization styles etc.,) but not larger systems. I think that’s an interesting problem for us to solve as a community. We also don’t have a great way of determining when something we’ve made has failed. I think about that often and would love to see that debate.
what other hobbies or interests do you have after programming?
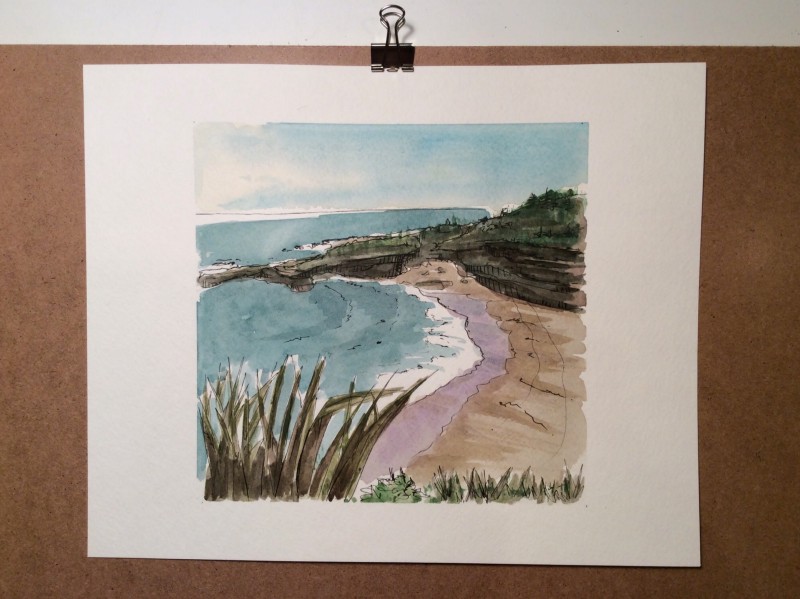
Actually I’m a singer; I’ve been singing for my whole life and I really enjoy it. I also paint some. I enjoy creative pursuits that may or may not have to do with computers. It’s good to recharge.
Learn more about Irene:
website: http://ireneros.com
twitter: https://twitter.com/ireneros
Github: https://github.com/iros
This project is made possible with sponsorships from frontendmasters.com, egghead.io, Microsoft Edge and Google Developers.
 Our sponsors.
Donate to support this project.
To suggest a maker you’d like to hear from, please fill out this form.
You can also send feedback to betweenthewires on Twitter.