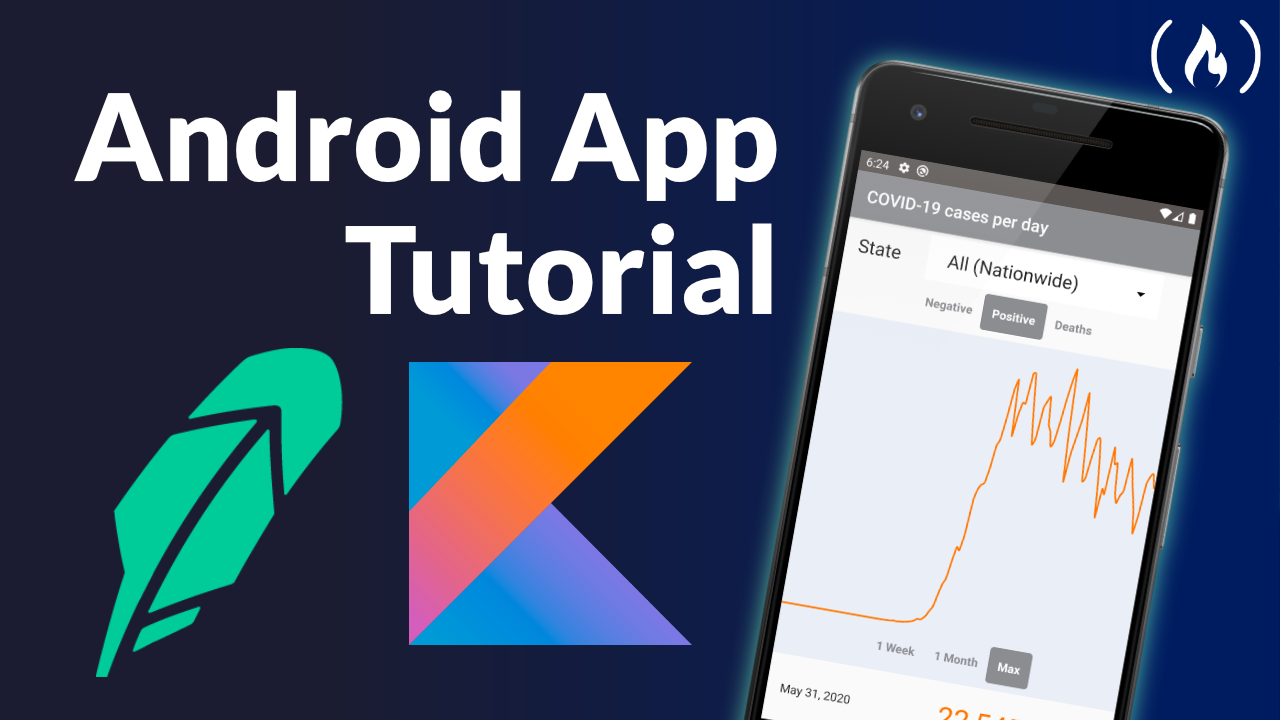
The Robinhood stock trading app has some useful UI components that are applicable to many different types of apps that display data. Knowing how to implement those components is a very useful tool to have in your toolbox.
We've released a course that will teach you how to develop an Android app with Kotlin that has a lot of similarities to Robinhood. But in this app, instead of charting stock prices, the app will chart COVID-19 cases.
You will learn how to display data in a way that can be used to display a wide variety of datasets in different contexts.
Rahul Pandey developed this course. He is an app developer and Facebook engineer. He has created many apps that are currently on the app store and has also created many app development tutorials.
Here are the different sections of this course:
- Retrieving data from the API
- Building the layout
- Render the spark line chart
- Add chart interaction
- Add colors and state spinner
- Ticker view + radio button styling
- Color update + conclusion
Watch the full course on the freeCodeCamp.org YouTube channel (90 minute watch).
