

This article shows how to build end-to-end, code-first LLM observability in a FastAPI application using the OpenTelemetry Python SDK.
Instead of relying on vendor-specific agents or opaque SDKs, we will manually design traces, spans, and semantic attributes that capture the full lifecycle of an LLM-powered request.
Table of Contents
FastAPI Example: End-to-End LLM Spans (Complete and Explained)
Exporting and Visualizing Traces (Where This Fits with Vendor Tooling)
Introduction
Large Language Models (LLMs) are rapidly becoming a core component of modern software systems. Applications that once relied on deterministic APIs are now incorporating LLM-powered features such as conversational assistants, document summarization, intelligent search, and retrieval-augmented generation (RAG).
While these capabilities unlock new user experiences, they also introduce operational complexity that traditional monitoring approaches were never designed to handle.
Unlike conventional software services, LLM systems are probabilistic by nature. The same request may produce slightly different responses depending on factors such as prompt structure, model configuration, retrieval context, and sampling parameters such as temperature or top-p.
In addition, LLM workloads introduce entirely new operational dimensions such as token consumption, prompt construction latency, inference cost, context window limits, and response quality.
These factors mean that a request can appear technically successful from an infrastructure perspective while still producing an incorrect, hallucinated, or low-quality result.
Traditional observability tools typically focus on infrastructure-level signals such as latency, error rate, and throughput. While these metrics remain important, they are insufficient for understanding how an LLM application behaves in production.
Engineers must also understand what prompt was constructed, which documents were retrieved, how many tokens were consumed, which model configuration was used, and how the final response was evaluated. Without this visibility, debugging LLM behavior becomes extremely difficult and operational costs can quickly spiral out of control.
This is where LLM observability becomes essential. Observability for LLM systems extends beyond infrastructure monitoring. It captures the full lifecycle of an AI-driven request — from user input and context retrieval to prompt construction, model inference, post-processing, and quality evaluation.
When implemented correctly, observability allows teams to answer why the model generated a particular response, which retrieval results influenced the output, how much a request cost in terms of tokens, where latency occurred within the request pipeline, and whether the response passed basic quality or safety checks.
This article demonstrates how to implement end-to-end LLM observability in a FastAPI application using OpenTelemetry. Instead of relying on proprietary monitoring agents or opaque vendor SDKs, we take a code-first approach to instrumentation. By explicitly designing traces, spans, and semantic attributes, we gain precise control over how LLM interactions are observed and analyzed.
Throughout the guide, we will walk through a practical architecture for tracing a retrieval-augmented generation (RAG) workflow, where each stage of the request lifecycle is represented as a trace span. We will explore how to design meaningful span boundaries, capture prompt and model metadata safely, record token usage and cost signals, and attach evaluation results directly to traces.
The article also explains how this instrumentation can be exported to any OpenTelemetry-compatible backend such as Jaeger, Grafana Tempo, or LLM-specific platforms like Phoenix.
By the end of this guide, you will understand how to:
Structure traces so that each user request maps to a single end-to-end LLM interaction
Design span hierarchies that reflect the logical stages of an LLM pipeline
Capture prompt metadata, model configuration, and token usage safely
Attach evaluation and quality signals to traces for deeper analysis
Export observability data to different backends without changing instrumentation
Most importantly, the goal of this article is not simply to demonstrate how to add telemetry to an application. Instead, it aims to show how to think about observability when building LLM-powered systems.
When LLM operations are treated as first-class components within a distributed system, traces become a powerful tool for debugging, optimization, cost management, and continuous improvement of model behavior.
Prerequisites and Technical Context
Before following this guide, you should be familiar with the Python programming language, basic web API concepts, and general microservice architecture. Below are some key tools and concepts used in this article.
FastAPI (Web Framework)
FastAPI is used as the primary web framework for the application. It is a modern Python framework designed for building high-performance APIs using standard Python type hints. FastAPI simplifies request validation, serialization, and API documentation while remaining lightweight and fast.
Large Language Models (LLMs)
Large Language Models (LLMs) are the computational core of the example system. An LLM is a model trained on vast amounts of text data to generate or transform language in ways that resemble human communication. In production environments, LLMs are commonly used for tasks such as conversational interfaces, summarization, and question answering.
Observability (Concept)
Observability is the overarching concept that connects all the technical pieces in this article. At a high level, observability refers to the ability to understand a system's internal behavior by examining the data it produces during execution. Rather than asking whether a system is simply "up" or "down," observability helps answer deeper questions about why a request behaved a certain way, where latency was introduced, or how different components interacted.
OpenTelemetry (Instrumentation Standard)
OpenTelemetry is the mechanism used to implement observability within the application. It is an open, vendor-neutral standard for generating telemetry data such as traces, metrics, and logs. By instrumenting key parts of the LLM workflow, we can observe how requests flow through the system, how long each step takes, and what contextual data influenced the final outcome. OpenTelemetry serves as the foundation for collecting this information in a consistent and portable way, independent of any specific monitoring backend.
Why LLM Observability Is Fundamentally Different
Traditional observability assumes deterministic behavior: the same input produces the same output. LLM systems violate this assumption. The same request can vary due to prompt template changes, retrieval differences, sampling parameters (temperature, top-p), model version upgrades, and context window truncation.
As a result, teams need visibility into what the model saw, how it was configured, what it retrieved, how long it took, and how much it cost, all correlated to a single user request. Logs alone are insufficient, and metrics lack dimensionality. Distributed traces are the backbone of LLM observability.
Reference Architecture: A Traceable RAG Request
A typical FastAPI-based RAG service follows this flow:
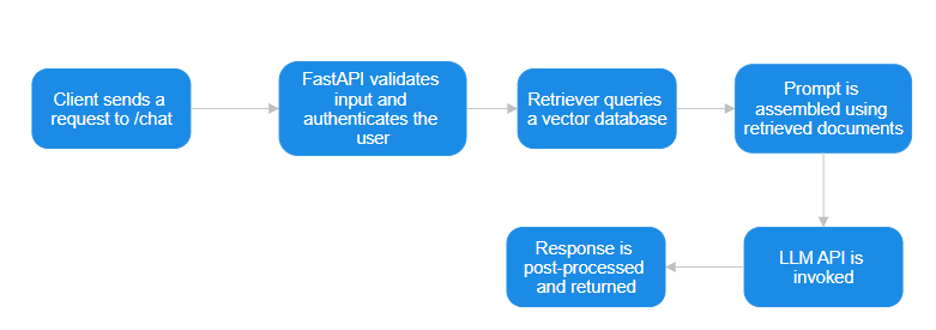
Each step is observable, but only if we deliberately instrument it. The goal is one trace per user request, with child spans representing each logical LLM step.
Reference Architecture Explained
Client Sends a Request to /chat
The architecture begins when a client sends a request to the /chat endpoint. This request typically contains the user's query along with any session or conversation context required by the application.
Keeping the client interface minimal and well-defined is intentional: it ensures the backend receives a predictable input shape and prevents application-specific logic from leaking into downstream LLM processing.
From an observability perspective, this request marks the start of a single end-to-end trace, allowing every subsequent operation to be correlated back to the original user action.
FastAPI Validates Input and Authenticates the User
Once the request reaches the service, FastAPI performs schema validation and authentication. Validation guarantees that only well-formed inputs proceed through the pipeline, while authentication ensures that expensive LLM operations are only executed for authorized users.
Placing this step early reduces unnecessary computation and protects the system from abuse. It also improves trace quality by ensuring that all observed requests represent legitimate execution paths rather than malformed or rejected traffic.
Retriever Queries the Vector Database
After validation, the system queries a vector database to retrieve documents relevant to the user's request. This retrieval step is the foundation of retrieval-augmented generation (RAG). By grounding the LLM in external knowledge, the system improves factual accuracy and reduces hallucinations.
Separating retrieval from generation allows teams to tune similarity thresholds, embedding models, and top-k values independently, and it makes it easier to diagnose whether poor responses are caused by bad retrieval or model behavior.
Prompt Is Assembled Using Retrieved Documents
With relevant documents in hand, the system constructs the final prompt that will be sent to the LLM. This step combines the user query, retrieved context, system instructions, and formatting rules into a single structured prompt.
Making prompt assembly an explicit stage enables prompt versioning, experimentation, and observability. It also provides a natural place to detect issues such as context window overflows or excessive prompt size before invoking the model.
LLM API Is Invoked
The LLM API call is the most expensive and non-deterministic operation in the pipeline, which is why it occurs only after all preparatory work is complete. At this stage, the model receives a fully constructed prompt and produces a response based on its configuration parameters.
This step is the primary focus of latency, cost, and reliability controls such as retries, timeouts, and circuit breakers. From an observability standpoint, this span becomes the anchor for token usage, cost attribution, and prompt-level debugging.
Response Is Post-Processed and Returned
After the LLM returns a response, the system performs post-processing before sending the result back to the client. This may include formatting, filtering, validation, or enrichment of the output. Post-processing acts as a final safeguard against malformed or low-quality responses and ensures consistency with application requirements. It also provides a clean boundary for attaching evaluation signals, such as response length, relevance scores, or truncation indicators, before the request completes.
Why This Design Is Better Than Simpler Alternatives
This architecture intentionally avoids coupling responsibilities together. Validation, retrieval, prompt construction, model execution, and response handling are all distinct steps. This separation makes the system easier to test, easier to observe, and easier to evolve. When something fails, engineers can identify where and why rather than treating the LLM as a black box.
Compared to a monolithic "send user input directly to the LLM" approach, this design offers better correctness, lower cost, and higher resilience. It also aligns naturally with distributed tracing, since each block maps cleanly to a trace span with a clear semantic purpose. As the system grows, additional features such as caching, fallback models, or policy enforcement can be added without destabilizing the entire flow.
Most importantly, this architecture treats the LLM as one component in a larger system, not the system itself. That mindset is essential for building reliable production applications.
LLM Models That Work Best for This Architecture
This architecture is model-agnostic, but certain model characteristics work particularly well with retrieval-augmented workflows.
Models with strong instruction-following and reasoning capabilities tend to perform best, especially when prompts include structured context from retrieved documents. General-purpose models such as GPT-4-class systems perform well when accuracy and reasoning depth are critical.
For lower-latency or cost-sensitive use cases, smaller instruction-tuned models can be effective when paired with high-quality retrieval. Open-source models such as LLaMA-derived or Mistral-based systems also fit well into this architecture, particularly when deployed behind a private inference endpoint.
The key requirement is not the model itself, but how it is used. Models that can reliably ground their responses in provided context, respect system instructions, and produce stable outputs under varying prompts integrate most cleanly into this design. Because retrieval and prompt construction are explicit stages, models can be swapped or compared without changing the overall system structure.
OpenTelemetry Primer (LLM-Relevant Concepts Only)
OpenTelemetry defines three core types of telemetry data: traces, metrics, and logs. For LLM systems, traces are the most important. To make them useful, you need to understand a few building blocks:
a trace represents a single end-to-end request
a span is a timed operation within that trace
attributes are key–value metadata attached to spans
events are time-stamped annotations
context propagation ensures child spans attach to the correct parent.
FastAPI’s async nature makes correct context propagation essential, but OpenTelemetry’s Python SDK handles this as long as spans are created correctly.
With those concepts in place, the next step is to wire OpenTelemetry into the app. Start by configuring the OpenTelemetry SDK in FastAPI: define a TracerProvider, attach a Resource (service name and environment), configure an exporter (Jaeger, Tempo, Phoenix, and so on), and enable FastAPI auto-instrumentation.
Designing LLM-Aware Spans
Span Taxonomy
A clean span hierarchy is critical. In this guide, a single http.request span (usually auto-generated) acts as the root, and it contains child spans such as rag.retrieval, rag.prompt.build, llm.call, llm.postprocess, and, optionally, llm.eval. Each of these spans represents a logical unit of work rather than an implementation detail.
Span Boundaries
Getting span boundaries right is just as important as picking the right span names. Avoid extremes like wrapping the entire LLM workflow in one giant span, creating a separate span for every token, or dumping all data into logs.
Instead, aim for a few coarse-grained spans that each represent a meaningful step in the request, enrich them with well-chosen attributes, and use events to mark important milestones within a span rather than splitting everything into smaller spans.
Instrumenting the LLM Call
When instrumenting the LLM call, treat it as the most critical span in the trace. Whether you are calling OpenAI, Anthropic, or another provider, start the span immediately before the API request and end it only after the full response (or stream) is complete.
Within that span, capture retries, timeouts, and errors so it becomes the central place for latency analysis, cost attribution, and prompt debugging.
For streaming responses, you can emit events for each chunk to track progress, but avoid creating separate child spans unless you truly need fine-grained timing.
FastAPI Example: End-to-End LLM Spans (Complete and Explained)
from fastapi import FastAPI, Request
from opentelemetry import trace
from opentelemetry.trace import Tracer
from typing import List
import asyncio
import hashlib

# Obtain a tracer instance from OpenTelemetry.
# All spans created with this tracer will be part of the same distributed
# tracing system and exported to the configured backend.
tracer: Tracer = trace.get_tracer(__name__)

# Initialize the FastAPI application.
app = FastAPI()

# Helper functions used by the observable endpoint
async def retrieve_documents(query: str) -> List[str]:
    """
    Simulate document retrieval (e.g., vector search or knowledge base lookup).
    This function represents the retrieval stage in a RAG pipeline.
    In a real system, this might query a vector database or search index.
    """
    await asyncio.sleep(0.05)  # Simulate I/O latency
    return [
        "FastAPI enables high-performance async APIs.",
        "OpenTelemetry provides vendor-neutral observability.",
        "LLM observability requires tracing prompts and tokens.",
    ]


def build_prompt(query: str, documents: List[str]) -> str:
    """
    Construct the final prompt from retrieved documents and the user query.
    Prompt construction is kept separate so it can be observed or modified
    independently if needed (for example, to measure prompt assembly latency).
    """
    context = "\n".join(documents)
    return f"""
Context:
{context}

Question:
{query}
"""


class LLMResponse:
    """
    Minimal abstraction for an LLM response.
    This keeps the example self-contained while still allowing us to attach
    token usage and other metadata for observability.
    """

    def __init__(self, text: str, prompt_tokens: int, completion_tokens: int):
        self.text = text
        self.prompt_tokens = prompt_tokens
        self.completion_tokens = completion_token

    @property
    def total_tokens(self) -> int:
        return self.prompt_tokens + self.completion_tokens

async def call_llm(prompt: str) -> LLMResponse:
    """
    Simulate an LLM API call.
    In a real implementation, this would call OpenAI, Anthropic, or another
    provider. The artificial delay represents model latency.
    """
    await asyncio.sleep(0.2)  # Simulate inference time
    response_text = "FastAPI and OpenTelemetry enable end-to-end LLM observability."
    # Token count is approximated here for demonstration purposes.
    prompt_tokens = len(prompt.split())
    completion_tokens = len(response_text.split())
    return LLMResponse(response_text, prompt_tokens, completion_tokens)


def summarize_response(response: LLMResponse) -> str:
    """
    Example post-processing step.
    Post-processing is separated into its own phase so any additional latency
    or errors are not incorrectly attributed to the LLM itself.
    """
    return response.text


# Observable FastAPI endpoint
@app.post("/query")
async def rag_query(request: Request, query: str):
    """
    Handle a single RAG-style request with explicit OpenTelemetry spans.
    This endpoint demonstrates how to create one trace per request, with child
    spans for retrieval, LLM invocation, and post-processing.
    """

    # Create a top-level span for the HTTP request.
    # Even if FastAPI auto-instrumentation is enabled, defining this explicitly
    # allows us to attach domain-specific metadata.
    with tracer.start_as_current_span("http.request") as http_span:
        http_span.set_attribute("http.method", "POST")
        http_span.set_attribute("http.route", "/query")

        # Retrieval phase
        # This span isolates the retrieval step so that relevance issues can be
        # debugged independently of LLM behavior.
        with tracer.start_as_current_span("rag.retrieval") as retrieval_span:
            retrieval_span.set_attribute("rag.top_k", 5)
            retrieval_span.set_attribute("rag.similarity_threshold", 0.8)
            documents = await retrieve_documents(query)

            # Record how many documents were returned.
            # This is a key signal when diagnosing hallucinations
            # or missing context in the final response.
            retrieval_span.set_attribute(
                "rag.documents_returned",
                len(documents),
            )

        # LLM invocation phase
        # This span wraps the actual LLM call and is the primary anchor for
        # latency, cost, and prompt-related analysis.
        with tracer.start_as_current_span("llm.call") as llm_span:
            llm_span.set_attribute("llm.provider", "example")
            llm_span.set_attribute("llm.model", "example-llm")
            llm_span.set_attribute("llm.temperature", 0.7)
            llm_span.set_attribute("llm.prompt_template_id", "rag_v1")

            # Build the final prompt using retrieved context.
            # The raw prompt is intentionally not stored as a span attribute.
            prompt = build_prompt(query, documents)

            # Prompt metadata
            prompt_hash = hashlib.sha256(prompt.encode()).hexdigest()
            llm_span.set_attribute("llm.prompt_hash", prompt_hash)
            llm_span.set_attribute("llm.prompt_length", len(prompt))

            response = await call_llm(prompt)

            # Hash the response instead of storing raw text.
            # This allows correlation across traces without exposing content.
            response_hash = hashlib.sha256(
                response.text.encode()
            ).hexdigest()
            llm_span.set_attribute("llm.response_hash", response_hash)

            # Record token usage to enable cost attribution
            # and capacity planning.
            llm_span.set_attribute("llm.usage.prompt_tokens", response.prompt_tokens)
            llm_span.set_attribute("llm.usage.completion_tokens", response.completion_tokens)
            llm_span.set_attribute("llm.usage.total_tokens", response.total_tokens)

            # example price per token
            estimated_cost = response.total_tokens * 0.000002
            llm_span.set_attribute("llm.cost_estimated_usd", estimated_cost)

        # Post-processing phase
        # Any transformation after the LLM response is captured here,
        # ensuring inference latency is not overstated.
        with tracer.start_as_current_span("llm.postprocess") as post_span:
            summary = summarize_response(response)
            post_span.set_attribute(
                "llm.summary_length",
                len(summary),
            )

    # Return the final response to the client.
    # All spans above belong to the same distributed trace.
    return {"summary": summary}
Before examining the full code example, it helps to understand how the instrumentation relates to the observability principles described earlier in this article.
The goal of the example is not simply to show how to create spans, but to demonstrate how a single user request can be represented as a structured trace containing meaningful metadata about each stage of the LLM pipeline.
At a high level, the code follows three key design ideas:
One trace per user request
One span per logical LLM workflow stage
Semantic attributes attached to spans for debugging, cost tracking, and analysis
Each of these concepts directly corresponds to the observability practices discussed earlier.
Top-Level Request Span
The FastAPI endpoint begins by creating a top-level span called http.request. This span represents the entire lifecycle of the incoming request and serves as the root span for the trace.
with tracer.start_as_current_span("http.request") as http_span:
Although FastAPI can generate HTTP spans automatically through OpenTelemetry auto-instrumentation, explicitly creating this span allows the application to attach domain-specific metadata such as route names or user identifiers.
Attributes such as the HTTP method and route are attached here:
http_span.set_attribute("http.method", "POST")
http_span.set_attribute("http.route", "/query")
This ensures that every trace can be easily filtered by endpoint when analyzing production traffic.
Retrieval Span
The next span captures the retrieval phase of the RAG pipeline:
with tracer.start_as_current_span("rag.retrieval") as retrieval_span:
This span isolates the vector search or knowledge retrieval step from the rest of the pipeline. If users report irrelevant answers, engineers can inspect this span to determine whether the issue originates from poor retrieval results rather than model behavior.
Several semantic attributes are attached here:
rag.top_k– number of documents requestedrag.similarity_threshold– similarity cutoff used for filtering resultsrag.documents_returned– number of documents actually retrieved
These attributes align with the RAG observability signals discussed in the earlier section of the article.
LLM Invocation Span
The most important span in the trace is the llm.call span, which wraps the actual model invocation.
with tracer.start_as_current_span("llm.call") as llm_span:
This span captures the latency, configuration, and token usage associated with the LLM request. In production systems, it becomes the primary location for analyzing model behavior and cost.
Key attributes recorded in this span include:
llm.provider– the model provider (OpenAI, Anthropic, etc.)llm.model– the specific model versionllm.temperature– sampling parameter controlling response randomnessllm.prompt_template_id– identifier for the prompt template used
These attributes make it possible to correlate changes in model configuration with downstream quality or cost changes.
Prompt Handling and Privacy
Instead of storing the full prompt or response text directly in the trace, the example demonstrates a safer practice: hashing sensitive data.
response_hash = hashlib.sha256(response.text.encode()).hexdigest()
The resulting hash is stored as a span attribute:
llm_span.set_attribute("llm.response_hash", response_hash)
This approach allows engineers to correlate repeated responses across traces without exposing potentially sensitive content in observability systems.
Token Usage Tracking
The llm.call span also records token usage:
llm_span.set_attribute(
    "llm.usage.total_tokens",
    response.total_tokens
)
Capturing token usage at the span level is critical for monitoring cost and efficiency, since token consumption directly determines billing for most LLM providers.
Post-Processing Span
Finally, the example includes a llm.postprocess span:
with tracer.start_as_current_span("llm.postprocess") as post_span:
This span represents any transformation applied after the model generates its response. Separating post-processing from the LLM call ensures that additional latency — such as formatting, filtering, or validation — is not incorrectly attributed to the model itself.
An attribute such as response length is recorded here:
post_span.set_attribute("llm.summary_length", len(summary))
This can be useful when diagnosing issues such as unexpectedly short or truncated outputs.
How the Spans Form a Complete Trace
When the request finishes, all spans belong to the same distributed trace:
http.request
 ├── rag.retrieval
 ├── llm.call
 └── llm.postprocess
This hierarchy reflects the logical workflow of a retrieval-augmented LLM system. Because each span contains structured metadata, engineers can quickly answer questions such as:
Was the latency caused by retrieval or model inference?
How many documents influenced the prompt?
Which model configuration produced the response?
How many tokens were consumed?
Was the response post-processed or truncated?
This structured trace design is what transforms observability from simple monitoring into a practical debugging and optimization tool for LLM systems.
Semantic Attributes: Best Practices for LLM Observability
The goal is not to capture every possible detail, but to record the minimal set of stable, high-signal attributes that enable effective debugging, cost control, and quality analysis in production. Poor attribute design leads to noisy traces, privacy risks, and dashboards that are impossible to reason about.
Prompt, Response, and Model Metadata
Storing raw prompts is often unsafe and expensive, so it is better to record minimal, structured metadata instead. In practice, this means attaching a stable template identifier with llm.prompt_template_id, a hashed version of the final prompt using llm.prompt_hash (to avoid storing raw text), and a size indicator such as llm.prompt_length, which captures the number of tokens or characters.
You should also always record key inference parameters: llm.provider (for example, "openai" or "anthropic"), llm.model (for example, "gpt-4.1"), llm.temperature and llm.top_p (sampling parameters), llm.max_tokens (the maximum tokens allowed), and llm.stream to indicate whether streaming was enabled, while staying within your organization’s privacy and compliance requirements.
with tracer.start_as_current_span("llm.call") as llm_span:
            llm_span.set_attribute("llm.provider", "example")
            llm_span.set_attribute("llm.model", "example-llm")
            llm_span.set_attribute("llm.temperature", 0.7)
            llm_span.set_attribute("llm.top_p", 0.9)
            llm_span.set_attribute("llm.max_tokens", 512)
            llm_span.set_attribute("llm.stream", False)
            llm_span.set_attribute("llm.prompt_template_id", "rag_v1")

            # Build the final prompt using retrieved context.
            # The raw prompt is intentionally not stored as a span attribute.
            prompt = build_prompt(query, documents)

            # Prompt metadata
            prompt_hash = hashlib.sha256(prompt.encode()).hexdigest()
            llm_span.set_attribute("llm.prompt_hash", prompt_hash)
            llm_span.set_attribute("llm.prompt_length", len(prompt))
Token Usage and Cost (Why This Matters in Practice)
Token usage is one of the most common blind spots in LLM systems. Many teams monitor latency and error rates but discover runaway costs only after invoices spike. Because token consumption varies significantly by prompt structure, retrieved context, and model configuration, it must be captured explicitly at the span level.
The most important practice is to record token usage at the end of the LLM span, once the model has completed inference. This ensures that the values reflect the full request rather than partial or streamed output.
At minimum, capture the attributes:llm.usage.prompt_tokens ,llm.usage.completion_tokens and llm.usage.total_tokens.
def __init__(self, text: str, prompt_tokens: int, completion_tokens: int):
        self.text = text
        self.prompt_tokens = prompt_tokens
        self.completion_tokens = completion_token

    @property
    def total_tokens(self) -> int:
        return self.prompt_tokens + self.completion_tokens

async def call_llm(prompt: str) -> LLMResponse:
    """
    Simulate an LLM API call.
    In a real implementation, this would call OpenAI, Anthropic, or another
    provider. The artificial delay represents model latency.
    """
    await asyncio.sleep(0.2)  # Simulate inference time
    response_text = "FastAPI and OpenTelemetry enable end-to-end LLM observability."
    # Token count is approximated here for demonstration purposes.
    prompt_tokens = len(prompt.split())
    completion_tokens = len(response_text.split())
    return LLMResponse(response_text, prompt_tokens, completion_tokens)
These values allow you to distinguish between requests that are expensive because of large prompts (often caused by excessive retrieval or poor prompt construction) versus those that are expensive because of long model-generated outputs.
*Where possible, also attach an estimated cost:* llm.cost_estimated_usd
    # example price per token
    estimated_cost = response.total_tokens * 0.000002
    llm_span.set_attribute("llm.cost_estimated_usd", estimated_cost)
This value is typically derived by multiplying token counts by the model's published pricing. Even if the estimate is approximate, it enables powerful analysis. For example, you can identify which endpoints, prompt templates, or user flows are responsible for the highest cumulative cost, rather than relying on coarse, account-level billing dashboards.
Once spans carry the right attributes, the next step is to connect them to output quality, not just system health.
Evaluation Hooks Inside Traces
This section describes an additional pattern you can layer on top of the core instrumentation in this guide. It is optional and not implemented in the sample code, but it shows how to attach quality signals directly to your traces.
Observability is not just about whether the system stayed up, it is also about whether the model produced a useful answer. Evaluation hooks inside traces let you attach lightweight quality signals directly to the same spans you use for latency and cost.
Inline evaluations are the simplest approach. You can run quick checks synchronously and record the results as span attributes, such as llm.eval.passed for a simple boolean check, llm.eval.relevance_score for an optional numerical score, or flags like llm.eval.hallucination_detected and llm.eval.refusal_detected. These attributes travel with the trace, so you can filter and aggregate on them in your observability backend just like any other field.
For higher accuracy, you can introduce model-based evaluation as a separate step. In this pattern, an evaluator LLM runs asynchronously on the original prompt and response, and its work is captured in a child span (for example, llm.eval) that shares the same trace ID as the main llm.call span. You then attach scores such as relevance, faithfulness, or toxicity to that evaluation span.
Because the evaluation span shares the same trace ID, you can correlate quality regressions with changes in prompts or retrieval.
Exporting and Visualizing Traces (Where This Fits with Vendor Tooling)
This code-first observability design is vendor-agnostic. Once traces are emitted using OpenTelemetry, they can be exported to different backends without changing instrumentation.
General-purpose tracing systems like Jaeger and Grafana Tempo help engineers debug latency, errors, and request flow across retrieval, prompting, and model calls, answering how the system behaved. LLM-focused platforms such as Arize Phoenix use the same data but add model-specific insights like prompt clustering, token analysis, and quality correlation.
Because instrumentation stays OpenTelemetry-native, you maintain full control over attributes and trace structure while still using vendor dashboards, and you can switch backends as your needs evolve without touching the application code.
Operational Patterns and Anti-Patterns
Effective LLM observability requires disciplined practices. High-volume systems should sample traces to limit overhead, and prompts or responses should be hashed by default to reduce storage and privacy risk. Traces must be treated as production data, with proper access control and retention policies.
Common pitfalls include relying only on vendor SDK traces, logging prompts without trace correlation, or ignoring evaluation signals. These issues fragment visibility and hide quality regressions, especially when observability focuses only on agents instead of full application context.
Extending the System
Once traces are reliable, they support advanced capabilities. Metrics like p95 latency can be derived from spans, logs can be linked using trace IDs, and historical traces can power offline evaluation or prompt testing.
By following OpenTelemetry conventions, the observability stack also stays aligned with emerging LLM semantic standards, keeping the system flexible and future-proof.
Conclusion
End-to-end LLM observability is not achieved by installing another agent. It is achieved through intentional span design, meaningful semantic attributes, and, where needed, lightweight evaluation hooks.
By treating LLM calls as first-class operations within distributed traces, you gain faster debugging, controlled costs, safer deployments, and measurable quality improvements. The backend — Jaeger, Tempo, Phoenix — is interchangeable. The instrumentation strategy is not.
A well-designed trace is the most valuable artifact in a production LLM system.