By Mandi Cai
Introduction
There comes a time in the life of a budding “low-key but also high-key trying to become a front-end designer and developer” when they must enter the world of charting libraries.
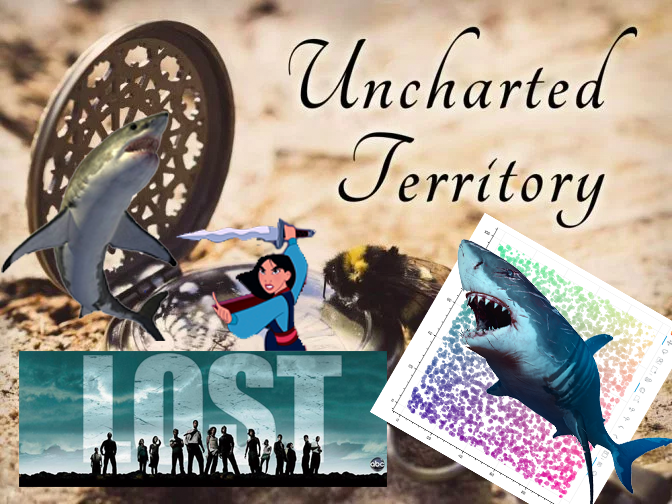 Navigating uncharted waters
Charting libraries produce data-driven visualizations. They are the reason you can quickly grasp trends in life expectancy on FiveThirtyEight or gauge the national sentiment about an upcoming presidential election (yikes) on The New York Times.
Think about the charts that you can create within Google Sheets, except now you have direct viewing and editing rights to the library that drives those charts. You are the master of these low level building blocks constituting a “chart”.
Several charting libraries are written in JavaScript, a language that is more familiar to web developers than most, which makes learning them a less daunting feat. When executed correctly, charting libraries have the power to drive home a powerful message and give you the opportunity to view serious visual candy.
Recently, our team was tasked with creating an interface that needed to integrate a charting library in order to fulfill the goal. As a result, we had to decide on a library that satisfied our specific use cases. If you weigh your needs correctly and choose a library that somehow satisfies all of them, life is golden.
However, libraries are never a one-size-fits-all kind of deal. More often than not, your initial assumption that a library is the perfect match will be incorrect because of unforeseen obstacles that pop up.
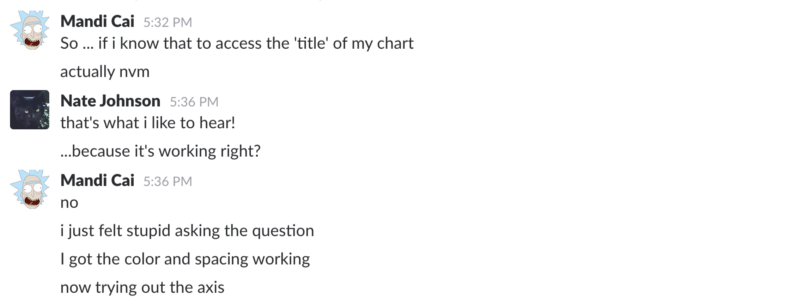 When nothing was working
Perhaps you’re thinking: “What are those options?”, “ How did you approach choosing an option?” or “Why did you feel stupid?” (refers to the Slack message above).
This article will describe our process of choosing a charting library among the myriad of JavaScript charting libraries that are currently available, the critical decision of switching between two charting libraries (Bokeh and D3.js), and the pros and cons of each one. For me, this was “uncharted” territory, and if you feel the same way about charting libraries or data visualization in general, you’ll feel better after reading this.
Let’s begin!
Why We Tried Bokeh First
Our needs fell into two camps: speed and interactivity. Because we were handling larger quantities of data, our visualization had to be able to update at lightning speed (or at least at a speed that had no perceivable lag).
Our application also needed to have the desired interactivity that we envisioned for the user. In an ideal scenario, the library would already include some of these interactive functions that we could easily throw in, instead of having to write them from scratch.
Enter Bokeh.
About Bokeh
Bokeh is a library primarily intended for creation of visualizations in the browser from large or streaming datasets. You create these visualizations using Python. Then Bokeh’s JavaScript API takes in your Python script and renders the plots or charts in addition to handling the UI interactions in the browser.
You can also choose to use the Bokeh Server to handle streaming of your data. In the Bokeh 0.12.13 documentation, it states: “This capability to synchronize between python and the browser is the main purpose of the Bokeh Server.”
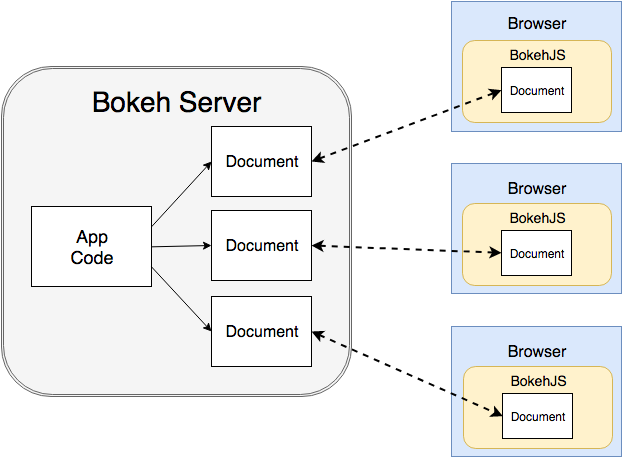 _[Source image](https://bokeh.pydata.org/en/latest/_images/bokeh_serve.svg" rel="noopener" target="blank" title=")
Advantages
Bokeh is magical for a lot of reasons. It renders first using WebGL with a HTML5 Canvas fallback, provides several built-in tools to interact with charts, handles egregiously large data sets, and ultimately, creates something that can go on the web immediately.
The ability to navigate between Python and JavaScript is also incredibly powerful for charting because Python allows you to tap into useful data structure and data analysis tools, while JavaScript translates the manipulated data into browser-friendly visualizations.
Disadvantages
One drawback to Bokeh, however, is that it is limited in the degree of interactivity that a visualization can have. Bokeh enables you to “chart” in the more conventional sense— it offers a 2-D, grid-like canvas with axes as the baseline. And that’s okay, because often that’s what the user needs and wants. Experienced Bokeh users can make really beautiful things (see examples here).
But if I wanted to make a visualization that went outside of the conventional characteristics of a chart, such as simulating forces between atoms and dragging the atoms around, I don’t know how I would accomplish that in Bokeh.
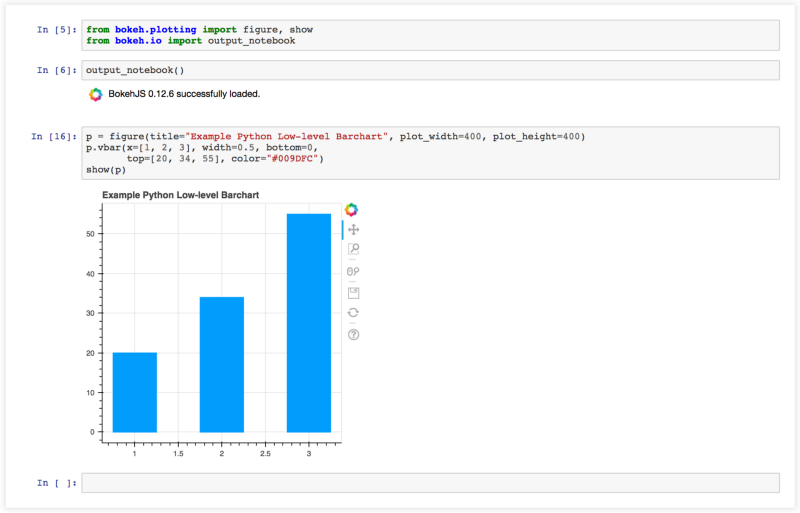
Bokeh is also intended for development in Python, not JavaScript. Below are examples of barcharts in Bokeh using Python. It’s super simple and clean.
Bokeh Barchart using Python (via Jupyter Notebook)
Before beginning to use Bokeh, we made the conscious decision to script in JavaScript instead of Python because our entire web application was and is built on a JavaScript framework. None of the Bokeh documentation is in JavaScript (it is in Python, as you would expect), and attempting to get under the JavaScript hood proved difficult.
If you are working with low-level glyphs, it is true that anything possible in Python is possible in JavaScript with Bokeh. However, if you are just starting to learn both languages like I was, translating syntax between the two is not intuitive.
In addition, there are limitations to the high-level JavaScript Bokeh.Charts and Bokeh.Plotting APIs — some are deprecated, others make it really hard for you to change features of the plot. The examples below are my attempts at creating Bokeh plots in JavaScript.
Bokeh Low-level Barchart using Javascript
Bokeh High-level Barchart using Bokeh.Charts Javascript API
More on developing in JavaScript with Bokeh here. As you can you see, JavaScript with Bokeh’s library loses the simpler lines of code that we observed when developing with Python. I think it took around an hour of fiddling in the console to add a white outline to the bars and a title in my high-level chart, which reiterates my struggle of navigating outside the boundaries of the Bokeh.Charts JavaScript API when you want to change visual details of the chart.
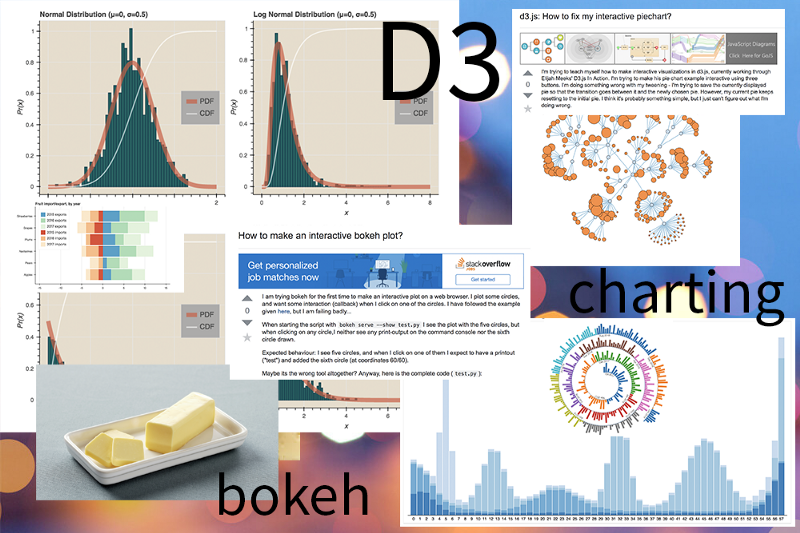
Finally, there’s more documentation and active usage of other charting libraries, like D3.js or three.js, compared to Bokeh. With more active contributors and users of a library comes a higher probability of finding the solution you need to fix a specific bug.
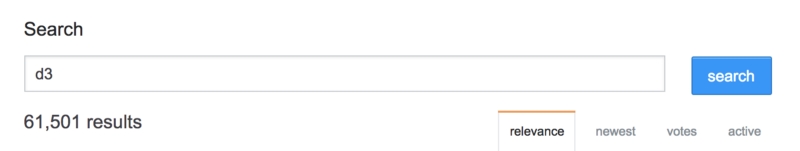 61,501 results for D3 on Stack Overflow
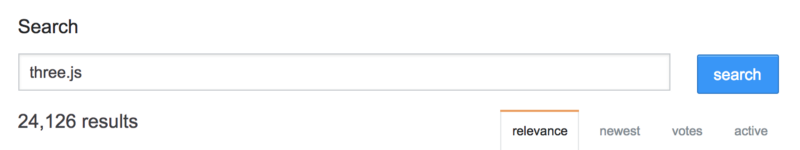 24,126 results for three.js on Stack Overflow
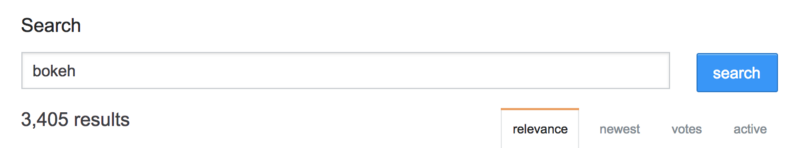 3,405 results for Bokeh on Stack Overflow
— — — — — — — — — — — — — — — — — — — — — — — — — — — — — — —
Why We Switched to D3
So we were stuck. We had reached the point of “this library suits our needs sort of but it’s a pain to continue making things in JavaScript and maybe we’re going to hit the ceiling one day when we realize we need something that isn’t available in Bokeh right now.” Cool.
Enter D3.
Our initial concern with D3 was that it would render our visualizations too slowly, given past experiences with rendering SVG’s in the browser with larger quantities of data. We also knew that the learning curve for D3 was significantly higher than Bokeh’s learning curve.
But we were still optimistic given D3’s popularity, the infinite amount of beautifully documented D3 applications, and our “Get Sh*t Done” attitude … so we decided to give it a try anyway.
 _Get Shit Done by [Tyler Somers](https://dribbble.com/shots/1685729-Get-Shit-Done" rel="noopener" target="blank" title=")
About D3
D3.js is a JavaScript library that emphasizes data-binding. It gives you the unique power to generate elements in the DOM and bind datum/data to elements simultaneously. With a completely data-driven library, you can add elements dynamically when adding or removing data points and transition between data sets. D3 also lends more control over the aesthetic and interactivity of the final result, which means you can get away with creating the most bizarre/wonderful visualizations.
Advantages
To our surprise, the D3 visualizations we created with our datasets were very buttery. We quickly realized that D3 is structured specifically for quick rendering, despite the massive arrays we were passing in to the library.
Instead of passing in data points one by one and generating the respective SVG, which can be quite tedious, D3 allows you to bind your entire data set to your SVG’s before they exist. The SVG’s are then generated rapid-fire and associated with their respective data point all in one go.
It’s like a chef in the kitchen that receives a list of orders at once and can prep the food in an order that omits unnecessary wait time, rather than always waiting to receive the next order after preparing one dish.
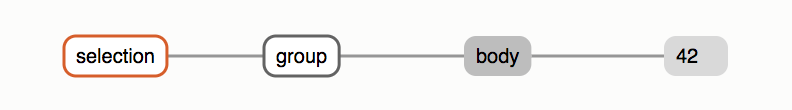
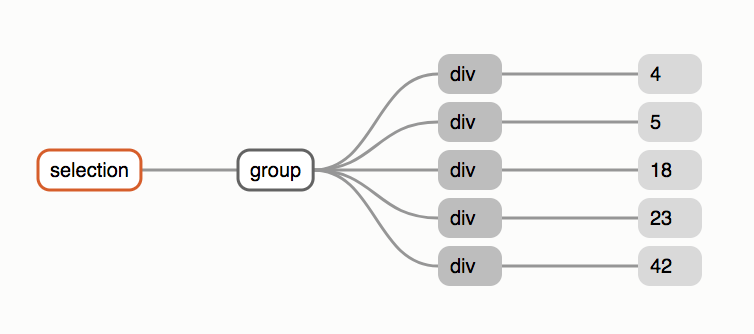 _Visualization of data binding to DOM elements from Mike Bostock’s [explanation on D3 selections](https://bost.ocks.org/mike/selection/" rel="noopener" target="blank" title=")
The best part about D3 is that it offers ample opportunity for smooth interactions and transitions between data sets. Because our ultimate goal was and is to empower the user, we wanted to create a visualization that would invite an individual to engage with it.
D3 is also meant for JavaScript development. There would be no more “digging underneath the hood” of the JavaScript API as we were doing with Bokeh. The barchart example I created using BokehJS previously in this article is shown below using the D3 library.
D3 Barchart
Yes, there are more complex lines of code compared the code required for a Bokeh chart. It took more time and energy to pick up. But you have complete control over every small detail of your chart, and it’s all documented somewhere online (probably via the creator, Mike Bostock). That’s pretty great.
Lastly, there has been extensive usage of D3 in recent years to visualize the 2017 US elections, the movement of refugee populations, infant vaccination rates for WHO, and countless other trends and stories. As a result, D3 has garnered a significant amount of exposure and attention, which leads to more active users and new ways to use the library every day.
When choosing a library for the long haul and keeping in mind that your teammates will also need to learn it eventually, it is absolutely crucial to consider the library’s current and future community of contributors. A library with a continuously thriving community is ideal, and D3 seems to foster that type of community.
Disadvantages
The initial learning curve is higher for D3 compared to Bokeh, assuming you’re developing in Python with Bokeh. JavaScript is more verbose than Python. However, if like us you were planning on developing in JavaScript, it’s worth trudging through the D3 tutorials.
It is hard understanding how selections work, what .enter() and .exit() even mean, and the magic that just happens with one simple line of code (.transition() anybody?). BUT — once you’ve wrapped your head around D3’s unique structure of assuming things exist before they exist, the possibilities are endless.
Ultimately, the benefits of D3 outweighed the effort and time of learning it, and we had a hunch that switching to D3 would be a good long-term investment.
Conclusion
So there you have it! We are still actively using and learning D3 as we integrate the library into our application and our team. Though just because we are moving forward with D3 does not mean that we won’t use Bokeh for a different application in the future. There are pros and cons to every charting library, and it’s important to reflect constantly to determine whether you should continue with your current library or start exploring other options.
Before choosing a charting library, know your specific needs and don’t be afraid to dive headfirst into the uncharted waters of charting libraries with those needs in mind. If something does not work the first time around, try something new that seems promising.
It’s about exploring, documenting, and checking back in with yourself and your teammates to continue evolving the project in productive ways.
Onward!
 _Source [here](https://www.xkcd.com/688/" rel="noopener" target="blank" title=")
If you have any comments, corrections, suggestions, or just want to talk, feel free to e-mail me at mandicai@gmail.com. You can find some of my work at http://mandilicai.com/.