
By ?? Anton de Regt
Data can tell lots of stories, and finding the hidden secrets is like finding a needle in a haystack.
After finishing my first data analysis course on Udacity, it was time for a real-world project.
In this project, I’m going to explore baseball data. To be more specific: batting data for every player that played between 1871 and 2016. You can download the entire dataset here.
My process:
- Have a first look at the data
- Come up with a question
- Wrangle the data
- Explore the data
- Draw conclusions/predictions
- Communicate my findings
My goal is to find the secrets of baseball in the data and share it with you, so that you can learn something and improve your game.
antonderegt/data-baseball
data-baseball — A Final project of Udacitygithub.com
First look at the data
The first step is to import a dataset. For the first look, I am going to display the first five entries to get an idea of what I’m dealing with.
import matplotlib.pyplot as pltimport numpy as npimport pandas as pdimport seaborn as sns%matplotlib inline
# Reading the batting datafilename = 'Batting.csv'batting_df = pd.read_csv(filename)
# Printing the first five entriesbatting_df.head()
# Getting some metrics on the home runs, number of games, runs batted in and the number of strikeoutsbatting_df[['HR','G', 'RBI', 'SO']].describe()
Looking at the table above, it seems batters hit an average of 2.8 home runs in a season with an average of 51 games.
batting_df_groupedby_year = batting_df.groupby(['yearID']).sum()homeruns_per_year = batting_df_groupedby_year[['HR']]
# Plotting the heatmap in reverse order to make it easier to see the increasesns.heatmap(homeruns_per_year.iloc[::-1])
 Plotting the heatmap
Above you can see the number of home runs increase as the years pass. On the left y-axis you can see the year, and on the right y-axis you can see the number of home runs.
Questions
Before the data will reveal its secrets, I have to ask it a few questions. Here are some examples of questions I can ask the data:
- Which teams have the most effective batters?
- Is there a correlation between Strikeouts and Home Runs?
- Who is the best stealer in history (Caught Stealing vs. Stolen Bases)?
- Which region produces the best batters (need to merge with another table for that)?
- What is the relationship between different performance metrics? Do any have a strong negative or positive relationship?
- What are the characteristics of baseball players with the highest salaries?
The question I am going to focus on is: which metrics correlate and which metrics do not?
Wrangling
# Displaying the batting data for the last ten yearsbatting_last_ten_years = batting_df.groupby(['yearID'], as_index=False).sum().sort_values(by='yearID', ascending=False).head(10)batting_last_ten_years
The dataset I am using is already very clean. I don’t have to do a lot of wrangling to get to the data I need. Above you can see batting data from the last 10 years.
Exploring
In the next code block, I will calculate the correlations between Home runs and all the other metrics. This way we can see which metrics contribute to home runs and which metrics are bad for scoring home runs. For example, I expect batters who play more games to score more home runs. I also expect batters with a high RBI to score the most home runs.
A correlation of 1 between two values is a perfect positive correlation. This means that when one of the two values increases, the other increases as well.
A correlation of -1 is a negative correlation. This means that when one value increases the other decreases.
As the value of a correlation goes to 0, the correlation is very small or non-existent. I will call a positive correlation ++, + or +- depending on the strength of the correlation. No correlation will be 0, and negative correlations will range from -+, — , or — — being a strong negative correlation.
def standardize(data): return (data - data.mean()) / data.std(ddof=0)
def pearsons_r(x, y): return (standardize(x) * standardize(y)).mean()
# It doesn't make sense to calculate the correlation between these values and home runsleave_out = ['playerID', 'yearID', 'teamID', 'lgID', 'HR']
# Meaning of the column names in the datadictionary = {'playerID':'Player', 'yearID':'Year', 'teamID':'Team', 'lgID':'League', 'HR':'Home Runs','stint':'Stints', 'G':'Games', 'AB': 'At Bats', 'R': 'Runs', 'H':'Hits', '2B':'Doubles', '3B':'Triples', 'RBI':'Runs Batted In', 'SB':'Stolen Bases', 'CS':'Caught Stealing', 'BB':'Base on Balls', 'SO':'Strikeouts', 'IBB':'Intentional Walks', 'HBP':'Hit by pitch', 'SH':'Sacrifice hits', 'SF':'Sacrifice flies', 'GIDP':'Grounded into double plays'}
strong_positive_correlation = []strong_negative_correlation = []
def correlations_for_hr(df): columns = list(df) for x in columns: if x not in leave_out: name_of_metric = dictionary[x] r = pearsons_r(df['HR'], df[x]) # Calculating the strenth of the correlation correlation = '' if r > 0.7: correlation = '++' strong_positive_correlation.append(name_of_metric) elif r > 0.5: correlation = '+ ' elif r > 0.3: correlation = '+-' elif r >= -0.3: correlation = 'O ' elif r > -0.5: correlation = '-+' elif r > -0.7: correlation = '- ' elif r > -1: correlation = '--' strong_negative_correlation.append(name_of_metric) print('{} Correlation between Home runs and {}:{}'.format(correlation, name_of_metric, "%.3f"%r)) print('-----------------------------------------') print('Correlations:')print('-----------------------------------------------------')print(correlations_for_hr(batting_df))print('\n')
print('Positive correlations: {}'.format(strong_positive_correlation))print('\n')
print('Negative correlations: {}'.format(strong_negative_correlation))
Output:
Correlations:--------------------------------------------------------------------O Correlation between Home runs and Stints: -0.065--------------------------------------------------------------------+ Correlation between Home runs and Games: 0.668--------------------------------------------------------------------+ Correlation between Home runs and At Bats: 0.695--------------------------------------------------------------------++ Correlation between Home runs and Runs: 0.729--------------------------------------------------------------------++ Correlation between Home runs and Hits: 0.703--------------------------------------------------------------------++ Correlation between Home runs and Doubles: 0.725--------------------------------------------------------------------+- Correlation between Home runs and Triples: 0.348--------------------------------------------------------------------++ Correlation between Home runs and Runs Batted In: 0.837--------------------------------------------------------------------O Correlation between Home runs and Stolen Bases: 0.265--------------------------------------------------------------------+- Correlation between Home runs and Caught Stealing: 0.409--------------------------------------------------------------------++ Correlation between Home runs and Base on Balls: 0.731--------------------------------------------------------------------++ Correlation between Home runs and Strikeouts: 0.822--------------------------------------------------------------------++ Correlation between Home runs and Intentional Walks: 0.753--------------------------------------------------------------------+- Correlation between Home runs and Hit by pitch: 0.497--------------------------------------------------------------------O Correlation between Home runs and Sacrifice hits: 0.064--------------------------------------------------------------------++ Correlation between Home runs and Sacrifice flies: 0.792--------------------------------------------------------------------++ Correlation between Home runs and Grounded into double plays: 0.767--------------------------------------------------------------------
Positive correlations: ['Runs', 'Hits', 'Doubles', 'Runs Batted In', 'Base on Balls', 'Strikeouts', 'Intentional Walks', 'Sacrifice flies', 'Grounded into double plays']
Negative correlations: []
Reviewing first expectations
Remember my expectations? I expected the number of games and the RBI score to have a positive correlation with home runs. According to my calculations above, the number of games has a positive correlation with a Pearson’s R of .668. So players who played more games in a season have a higher number of home runs. This sounds very logical, since batters who play more games have more chances of scoring a home run.
My other expectation was that a high RBI would mean a high number of home runs. The correlation between home runs and RBI is big with .837! This again is quite logical, because home runs are able to reward the player with the most RBI points.
Another interesting fact is that there are no negative correlations. So, there is no metric that decreases when the number of home runs increases.
# HOME RUNS vs. RUNS BATTED INsns.lmplot(size=10, data=batting_df[['HR', 'RBI']], x='HR', y='RBI', x_estimator=np.mean)
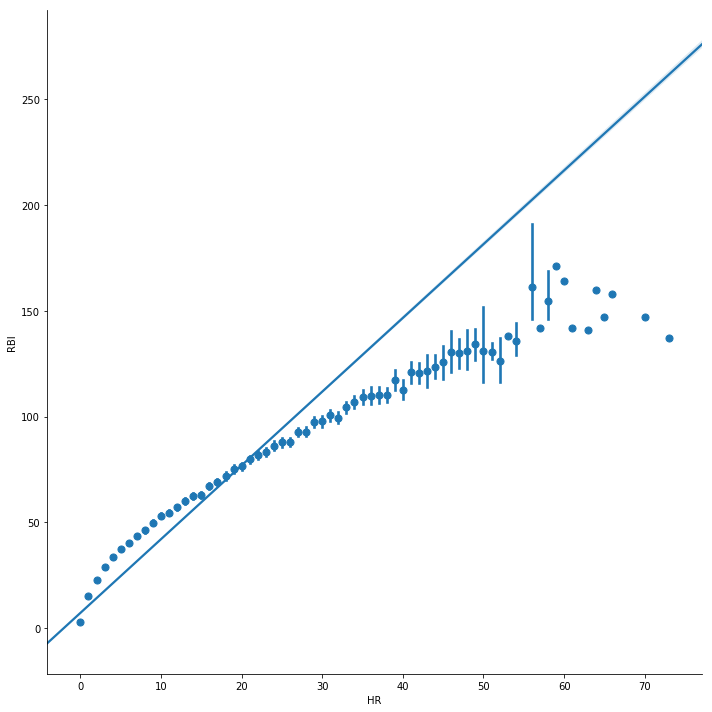 HOME RUNS vs. RUNS BATTED IN
The chart above shows how home runs correlate to RBI. You can see the number of home runs of the x-axis and the number of RBI points on the y-axis.
# HOME RUNS vs. STRIKEOUTSsns.lmplot(size=10, data=batting_df[['HR', 'SO']], x='HR', y='SO', x_estimator=np.mean)
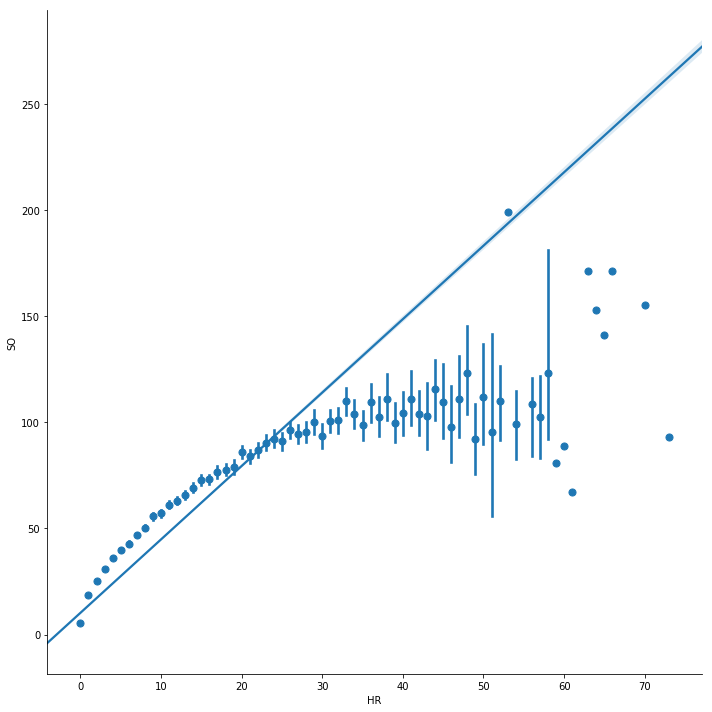 HOME RUNS vs. STRIKEOUTS
The plot above returns an interesting correlation. It’s the correlation between home runs and strikeouts. The Pearson’s R correlation is .822, being almost as high as the correlation between home runs and RBI.
This correlation was more interesting to me because RBI’s are a direct result of home runs. Strikeouts, on the other hand, have a direct correlation to losing your chance at a home run. How on earth would strikeouts result in more home runs?
How are home runs and strikeouts related
To solve this mystery, I started thinking… Maybe the batters who take more risk are more likely to score a home run. Because they swing even on balls that seem hard to hit. So, if taking more risks gives you more home runs, I took a look at risky metrics. Risky metrics are metrics that involve risk-taking, like stealing bases. Let’s have a look at the correlation.
# HOME RUNS vs. CAUGHT STEALINGsns.lmplot(size=10, data=batting_df[['HR', 'CS']], x='HR', y='CS', x_estimator=np.mean)
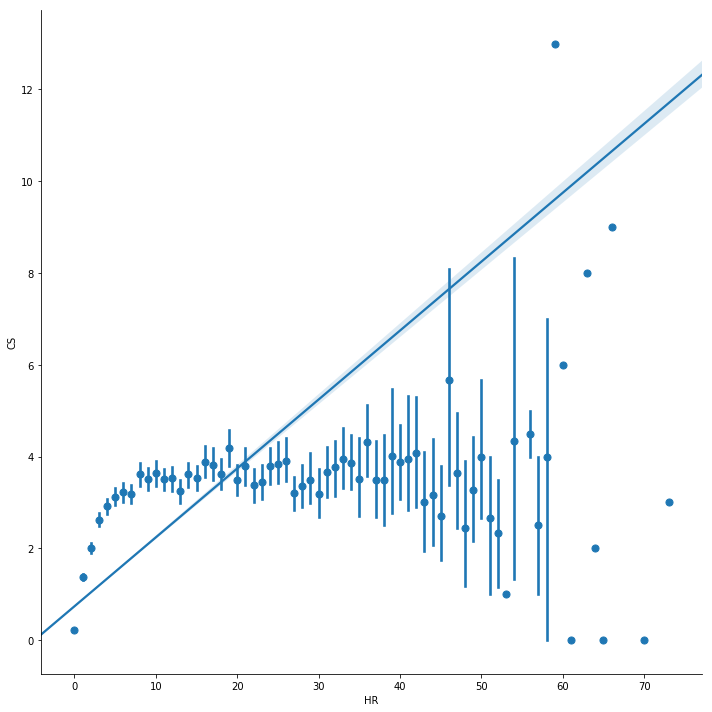 HOME RUNS vs. CAUGHT STEALING
Above you can see the correlation (.409) between home runs (x-axis) and the number of times a runner gets caught stealing (y-axis). There is a vague correlation, but it’s not enough to make a conclusion. Maybe the risk takers have gotten very good at stealing bases and don’t get caught stealing? Let’s look at stolen bases.
# HOME RUNS vs. STOLEN BASESsns.lmplot(size=10, data=batting_df[['HR', 'SB']], x='HR', y='SB', x_estimator=np.mean)
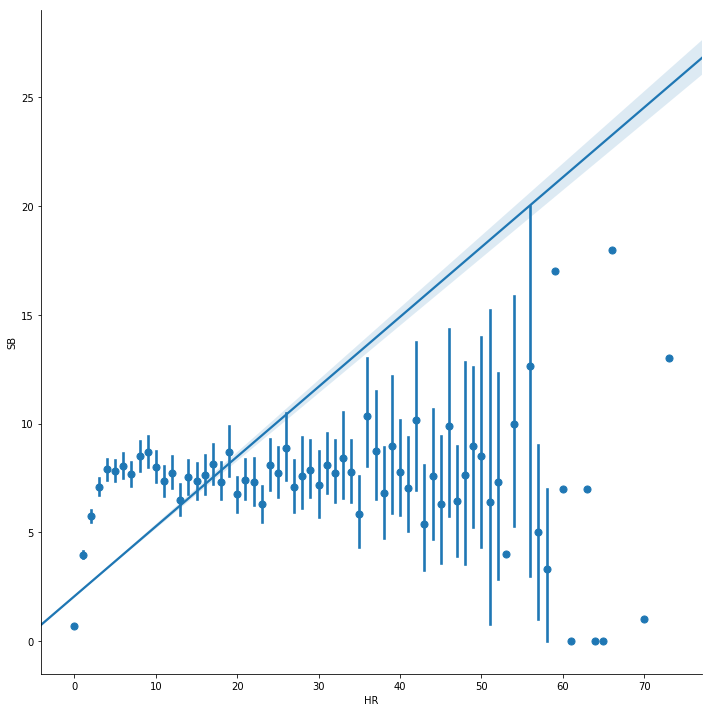 HOME RUNS vs. STOLEN BASES
Above you can see the correlation of .265 between home runs (x-axis) and stolen bases (y-axis). This correlation is non-existent. So, taking risks has nothing to do with scoring a home run.
The data alone is not going to reveal the secret of scoring a home run. I need to learn more about baseball to solve this mystery. My next plan of attack was watching YouTube videos to see how high scoring batters behave.
As it turns out, scoring a home run has more to do with fine calculations than taking risks. I saw batters waiting for the right pitch. They’d rather get a strike, hoping the next throw will serve them batter, eh better. An added benefit is that the pitcher tires faster as he has to throw more balls.
Conclusions/Predictions
To batters trying to improve their home run stats, I have a few suggestions. Step one in getting more home runs is: play more games, no excuses — play! Step two: get some strikeouts. It sounds counter-intuitive, but it increases your number of home runs. The way this works: it blows out the pitcher and gives the batter more time to wait for the best pitch to hit that GRAND SLAM.
For more about the correlation between home runs and strikeouts, read this article.
Or this one about risks of a tired pitcher
For more check out ditisAnton.com and SIGN UP for my weekly newsletter.