By Ravindu Fernando
Logging is an essential component within any application. Logs enable you to analyze and sneak a peak into what’s happening within your application code like a story. Software developers spend a large part of their day to day lives monitoring, troubleshooting and debugging applications, which can sometimes be a nightmare. Logging allows software developers to make this hectic process much easier and smoother.

If you have containerized your application with a container platform like Docker, you may be familiar with docker logs which allows you to see the logs created within your application running inside your docker container. Why then think of Elastic Stack to analyze your logs? Well, there are mainly two burning problems here:
- Imagine you have tens, hundreds, or even thousands of containers generating logs — SSH-ing in to all those servers and extracting logs won’t work well.
- Also containers are immutable and ephemeral, which means they have a shorter life span. So once your containers are gone and replaced with new containers, all of your application logs related to old containers are gone.
So the ultimate solution for this is to create a centralized logging component for collecting all of your container logs into a single place. This is where Elastic Stacks comes in.
Elastic Stack mainly consists of four major components:
- Beats is the new member which made the ELK Stack known as Elastic Stack. Beats are light weight log data shippers which can push logs to the ELK Stack. For this post I will be using Filebeats, a member of the Beats family, which offers a lightweight way to collect and forward and centralize logs and files.
- Logstash is a component which aggregates, modifies, and transfers logs from multiple input locations into Elasticsearch.
- Elasticsearch is a distributed, JSON-based search and analytics engine that stores and indexes data (log entries in this case) in a scalable and manageable way.
- Kibana is an enriched UI to analyze and easily access data in Elasticsearch.
In this post, we will look into how to use the above mentioned components and implement a centralized log analyzer to collect and extract logs from Docker containers.
For the purposes of this article, I have used two t2.small AWS EC2 instances, running Ubuntu 18.04 installed with Docker and Docker compose. Instance 1 is running a tomcat webapp and the instance 2 is running ELK stack (Elasticsearch, Logstash, Kibana).
In Linux by default docker logs can be found in this location:
/var/lib/docker/containers//<container-id>-json.log
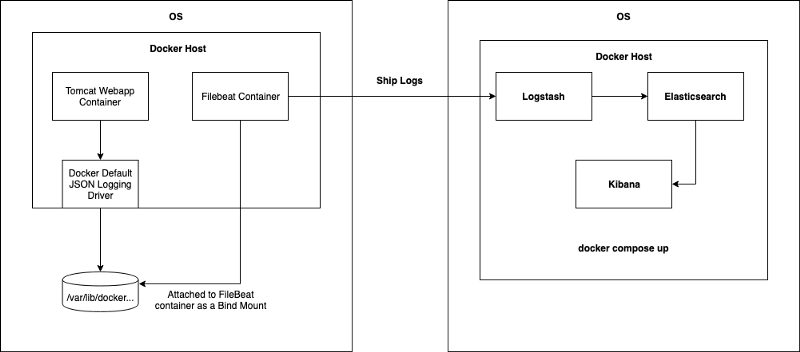
All docker logs will be collected via Filebeat running inside the host machine as a container. Filebeat will be installed on each docker host machine (we will be using a custom Filebeat docker file and systemd unit for this which will be explained in the Configuring Filebeat section.)
Our tomcat webapp will write logs to the above location by using the default docker logging driver. Filebeat will then extract logs from that location and push them towards Logstash.
Another important thing to note is that other than application generated logs, we also need metadata associated with the containers, such as container name, image, tags, host etc… This will allow us to specifically identify the exact host and container the logs are generating. These data can also be sent easily by Filebeat along with the application log entries.
By doing this kind of implementation the running containers don’t need to worry about the logging driver, how logs are collected and pushed. Filebeat will take care of those. This is often known as single responsibility principle.
Configuring Filebeat
For this section the filebeat.yml and Dockerfile were obtained from Bruno COSTE’s sample-filebeat-docker-logging github repo. Many thanks to his awesome work.
But since I have done several changes to filebeat.yml according to requirements of this article, I have hosted those with filebeat.service (systemd file) separately on my own repo. You can access the repo here.
As the initial step, you need to update your filebeat.yml file which contains the Filebeat configurations. Given below is a sample filebeat.yml file you can use. Note the line 21, the output.logstash field and the hosts field. I have configured it to the IP address of the server I’m running my ELK stack, but you can modify it if you are running Logstash on a separate server. By default Logstash is listening to Filebeat on port 5044.
To get to know more about Filebeat Docker configuration parameters, look here.
After that you can create your own Filebeat Docker image by using the following Dockerfile.
Once the image is built, you can push it in to your docker repository. Now since you have the capability to run Filebeat as a docker container, it’s just a matter of running the Filebeat container on your host instances running containers. Here is the docker run command.
docker run -v '/var/lib/docker/containers:/usr/share/dockerlogs/data:ro' -v '/var/run/docker.sock:/var/run/docker.sock' --name filebeat ${YOUR_FILEBEAT_DOCKER_IMAGE}:latest
In the above Docker command, note the two bind mount parameters: /var/lib/docker/containers is the path where docker logs exist within the host machine, and it has been bound to /usr/share/dockerlogs/data path within Filebeat container with read only access. In the second bind mount argument, /var/run/docker.sock is bound into the Filebeat container’s Docker daemon. It is the unix socket the Docker daemon listens on by default and it can be used to communicate with the daemon from within a container. This allows our Filebeat container to obtain Docker metadata and enrich the container log entries along with the metadata and push it to ELK stack.
If you want to automate this process, I have written a Systemd Unit file for managing Filebeat as a service.
Configuring the ELK Stack
For this I will be using my second EC2 instance, where I run the ELK stack. You can do this by simply installing Docker compose and checking out this awesome deviantony/docker-elk repo and just running docker-compose up -d
Note that all your firewall rules allow inbound traffic into the Logstash, Elasticsearch and Kibana.
Before running the ELK stack you need to make sure your logstash.conf file is properly configured to listen to incoming beats logs on port 5044 and the logs are being properly added onto the elasticsearch host. Also you need to make sure to add an index parameter on to your Elasticsearch to identify the logs generated by Filbeat uniquely.
In your docker-elk repo you can find your logstash.conf file by following docker-elk/logstash/pipeline pathname. This is the configuration file for setting up Logstash configurations. You need to update it as follows:
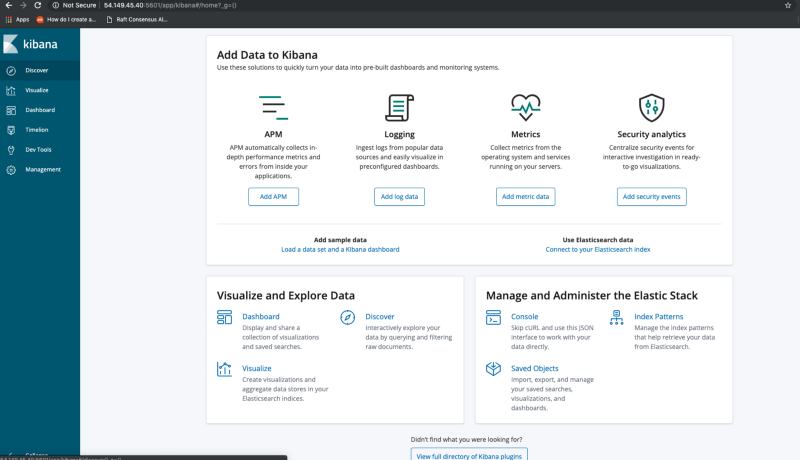
Once you do it, you can access your Kibana dashboard on port 5601 by default as defined on the docker-compose.yml file on deviantony/docker-elk repo.
Under the management tab, you can create an index pattern for Filebeat logs. This has to be done before you can view the logs on Kibana dashboard.
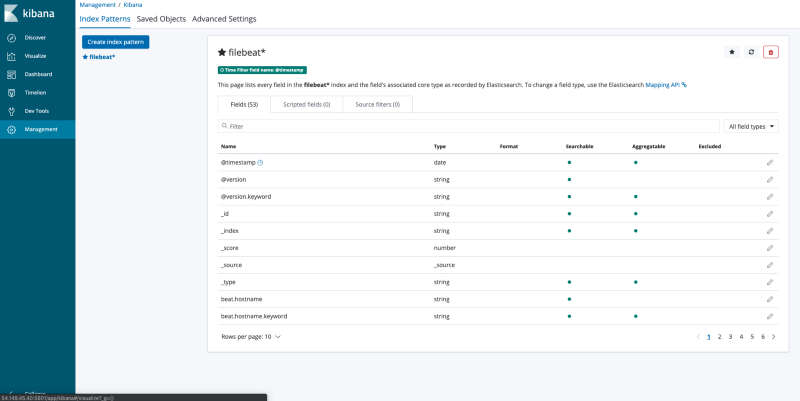
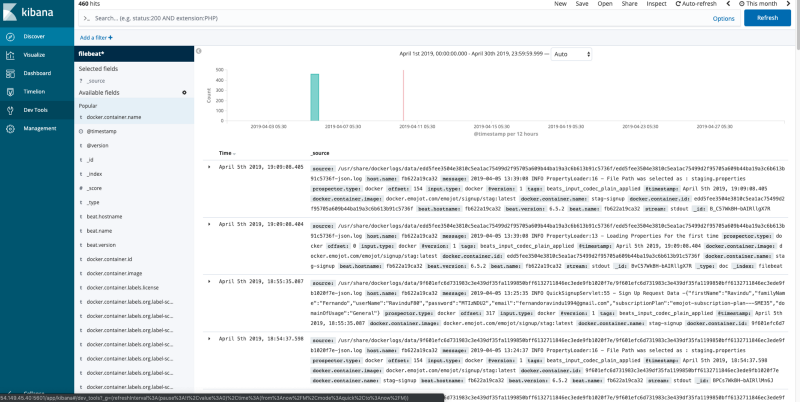
If your containers are pushing logs properly into Elasticsearch via Logstash, and you have successfully created the index pattern, you can go to the Discover tab on the Kibana dashboard and view your Docker container application logs along with Docker metadata under the filebeat* index pattern.
References
- https://www.elastic.co/guide/en/beats/filebeat/current/filebeat-getting-started.html
- https://medium.com/@bcoste/powerful-logging-with-docker-filebeat-and-elasticsearch-8ad021aecd87
- https://www.elastic.co/guide/en/logstash/current/configuration.html
- https://medium.com/lucjuggery/about-var-run-docker-sock-3bfd276e12fd