

Previously, we walked through creating a map that shows an interactive look at Coronavirus (COVID-19) cases per country. How can we extend this with some case statistics to show recent data about the impacts on our world?
Author's note: Similar to before, this dashboard is meant to be a demo and proof of concept for using real world data to build a dashboard. While this data should be accurate per the NovelCOVID API, I would recommend using tools like the Johns Hopkins University dashboard for complete and accurate analysis. Stay home and be safe! ❤️
- What are we going to build?
- What do we need before we get started?
- Step 1: Update how we fetch our data and fetch the statistics
- Step 2: Adding statistics to our dashboard
- Step 3: Make the data human friendly
- Step 4: Add the Last Updated date
- What can I do next?
What are we going to build?
We're going to be extending our original map demo with some basic statistics that we can retrieve from the NovelCOVID API. To get an idea, here's my demo I'm basing this off of.
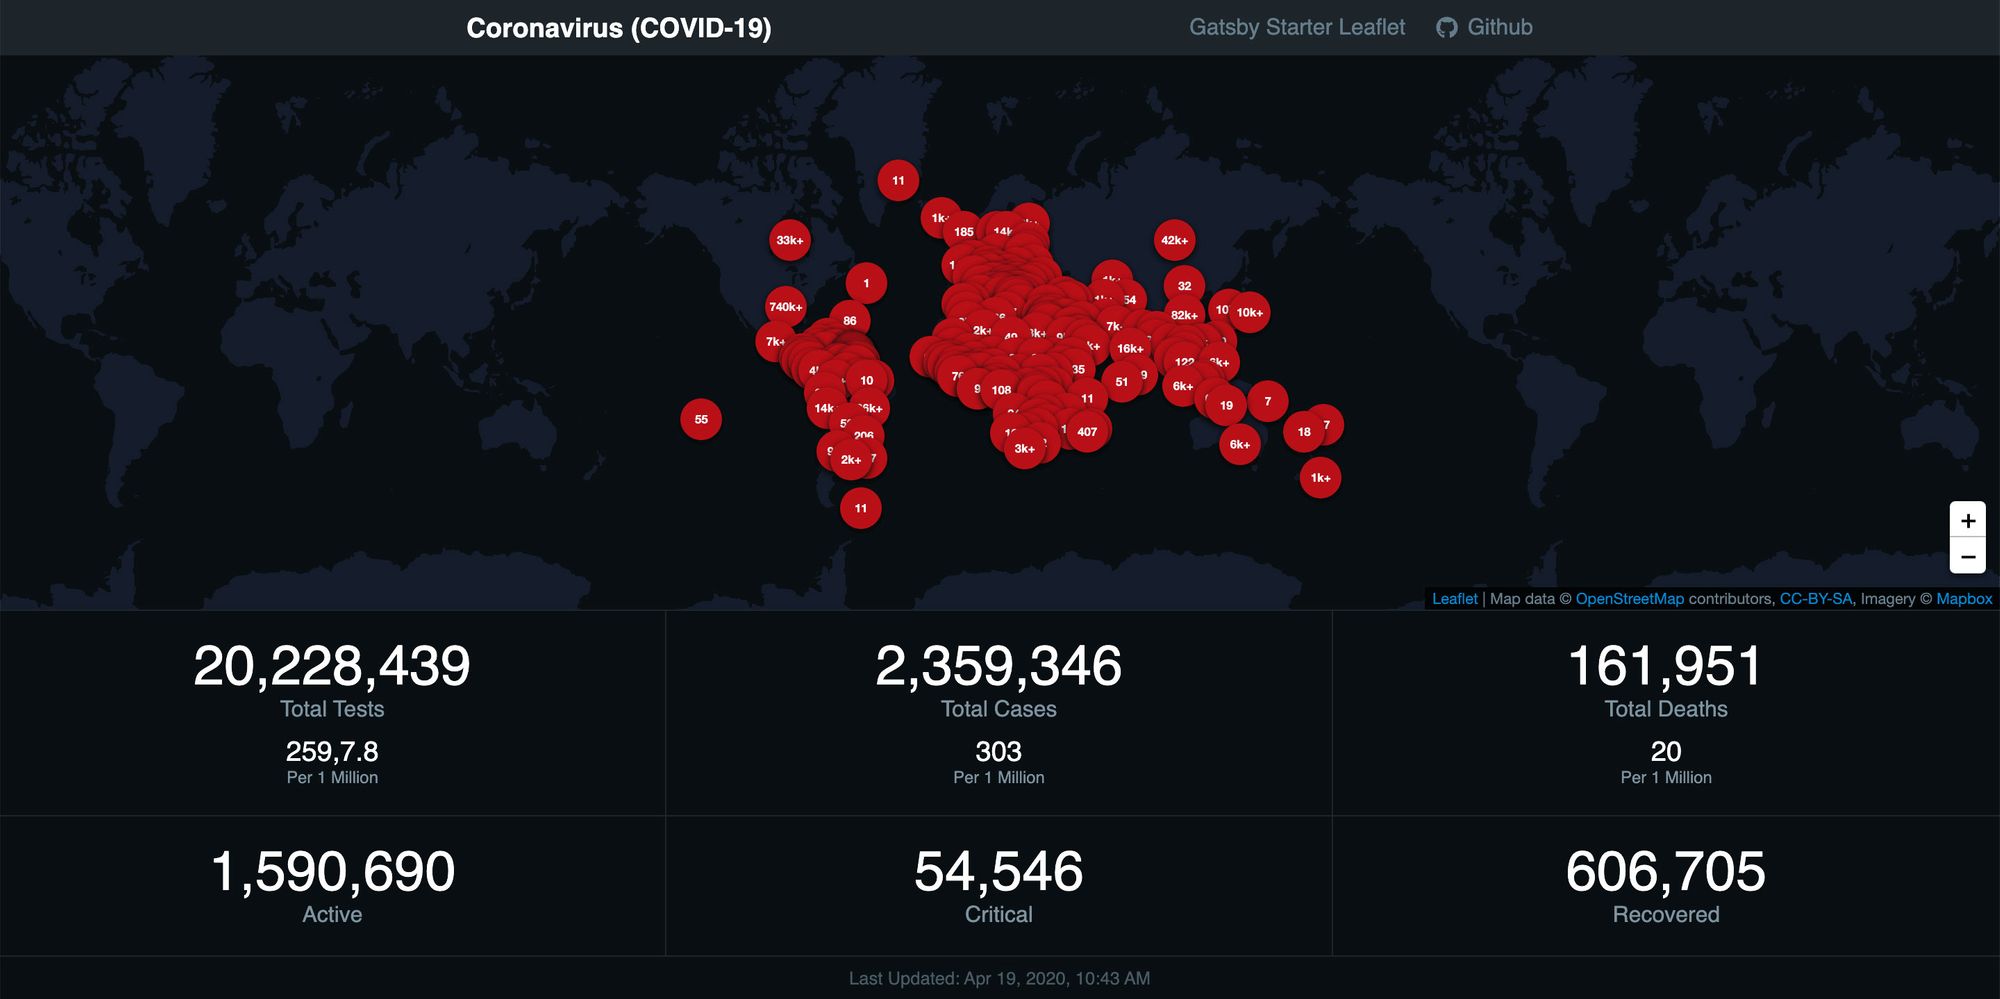 Coronavirus (COVID-19) map demo with dashboard statistics
While you're not required to have completed Part 1 to apply these concepts, it definitely helps, and it lets you set up a map for your dashboard. If you'd like to start there, which I recommend, check out How to create a Coronavirus (COVID-19) Dashboard & Map App with Gatsby and Leaflet first.
Woah, a mapping app?
Yup. If you haven't played with maps before, don't be discouraged! It's not as bad as you probably think. If you'd rather start with mapping basics, you can read more about how mapping works first.
What do we need before we get started?
For this walkthrough, you pretty much need a React app in some form. I'll be working with the dashboard we previously built in my last walkthrough that includes a map of the cases of the Coronavirus (COVID-19) per country.
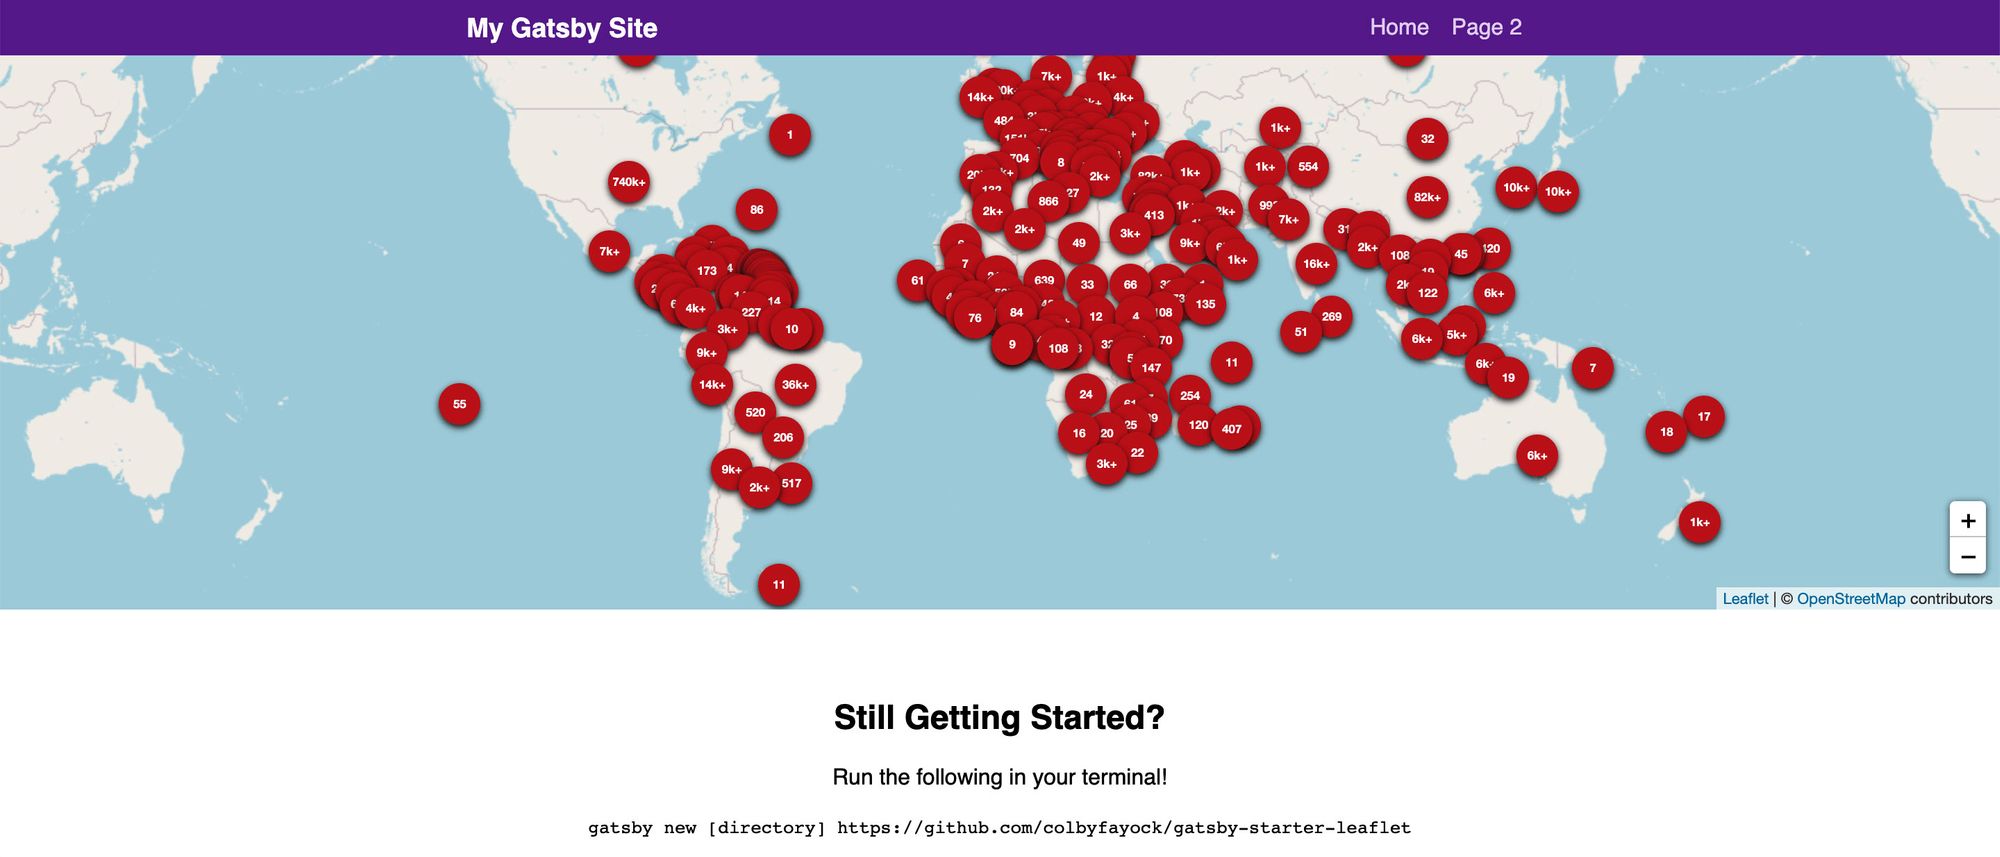 Coronavirus (COVID-19) map dashboard
I recommend starting with the previous tutorial, but if you want to skip the map and start fresh, the easiest way would probably be to use Create React App, Gatsby, or Next.js.
Step 1: Update how we fetch our data and fetch the statistics
To get started with our statistics dashboard, we're going to do a little prep work by changing how we're fetching the data. The goal here, is we're going to wrap our request logic in a reusable way so that we can use it for both our countries data and our new statistics data.
Creating a new React hook to fetch data
Diving in, the first we'll do is create a new React hook that will serve as how we fetch the data. To get started, create a new file in your hooks directory called useTracker.js and add a line inside of hooks/index.js to export it:
// New file src/hooks/useTracker.js
// This will be empty for now
// Inside hooks/index.js
export { default as useTracker } from './useTracker';
Inside of our useTracker.js file, we're going to set up our request logic. This is a long file, so make sure you copy and paste the entire thing before we walk through what it does:
import { useEffect, useState } from 'react';
import axios from 'axios';

const API_HOST = 'https://corona.lmao.ninja/v2';

const ENDPOINTS = [
  {
    id: 'all',
    path: '/all',
    isDefault: true
  },
  {
    id: 'countries',
    path: '/countries'
  }
]

const defaultState = {
  data: null,
  state: 'ready'
}

const useTracker = ({ api = 'all' }) => {

  const [tracker = {}, updateTracker] = useState(defaultState)

  async function fetchTracker() {
    let route = ENDPOINTS.find(({ id } = {}) => id === api);

    if ( !route ) {
      route = ENDPOINTS.find(({ isDefault } = {}) => !!isDefault);
    }

    let response;

    try {
      updateTracker((prev) => {
        return {
          ...prev,
          state: 'loading'
        }
      });
      response = await axios.get(`${API_HOST}${route.path}`);
    } catch(e) {
      updateTracker((prev) => {
        return {
          ...prev,
          state: 'error',
          error: e
        }
      });
      return;
    }

    const { data } = response;

    updateTracker((prev) => {
      return {
        ...prev,
        state: 'ready',
        data
      }
    });

  }

  useEffect(() => {
    fetchTracker()
  }, [api])

  return {
    fetchTracker,
    ...tracker
  }
};

export default useTracker;
Starting from the top:
- We import our dependencies: we're going to use Reacts
useEffectanduseStatehooks to manage our requests - We define default constants: we have a base API endpoint for our data, a list of the available endpoints we'll use, and a state object that will store our data
- We define our
useTrackerhook: our hook includes one argumentapithat will allow us to specify which endpoint we'll use to make our request - We set up a state instance: we'll want to keep track of our fetched data, so we create a
trackerstate instance that we'll be able to update - We created an asynchronous
fetchTrackerfunction: we'll use this to make our actual request - Inside our function: we first find the API route and create our URL, update our state instance to a "loading" state, try to make our request, catch any errors if there are any, and finally if the request is successful, we update our state with that data
- We trigger our function: using a
useEffecthook, we trigger ourfetchTrackerfunction to make the request. We only have one dependency ofapi. This means the function will only fire the first time and any time theapivalue we pass in changes. We won't be changing that value, but it may be helpful in other instances if you're dynamically changing the API used - We return our tracker: the returned object includes both our
trackerdata as well as ourfetchTrackerfunction that we could use to refetch the data if we'd like
And with all of that, we have a brand new hook that will fetch data from the NovelCOVID API.
Using our new tracker hook
To make use of this hook, let's jump over to src/pages/index.js, remove our axios import if it's there, and instead import our hook:
import { useTracker } from 'hooks';
With our hook, let's replace our original country data request. First, add the following to the top of the IndexPage component:
const { data: countries = [] } = useTracker({
  api: 'countries'
});

const hasCountries = Array.isArray(countries) && countries.length > 0;
This will let us fetch our country data and let us know if we have any results. Next, let's replace our original request.
Inside of our mapEffect function, let's remove the axios request in addition to the response, the destructured data object, and the hasData constant.
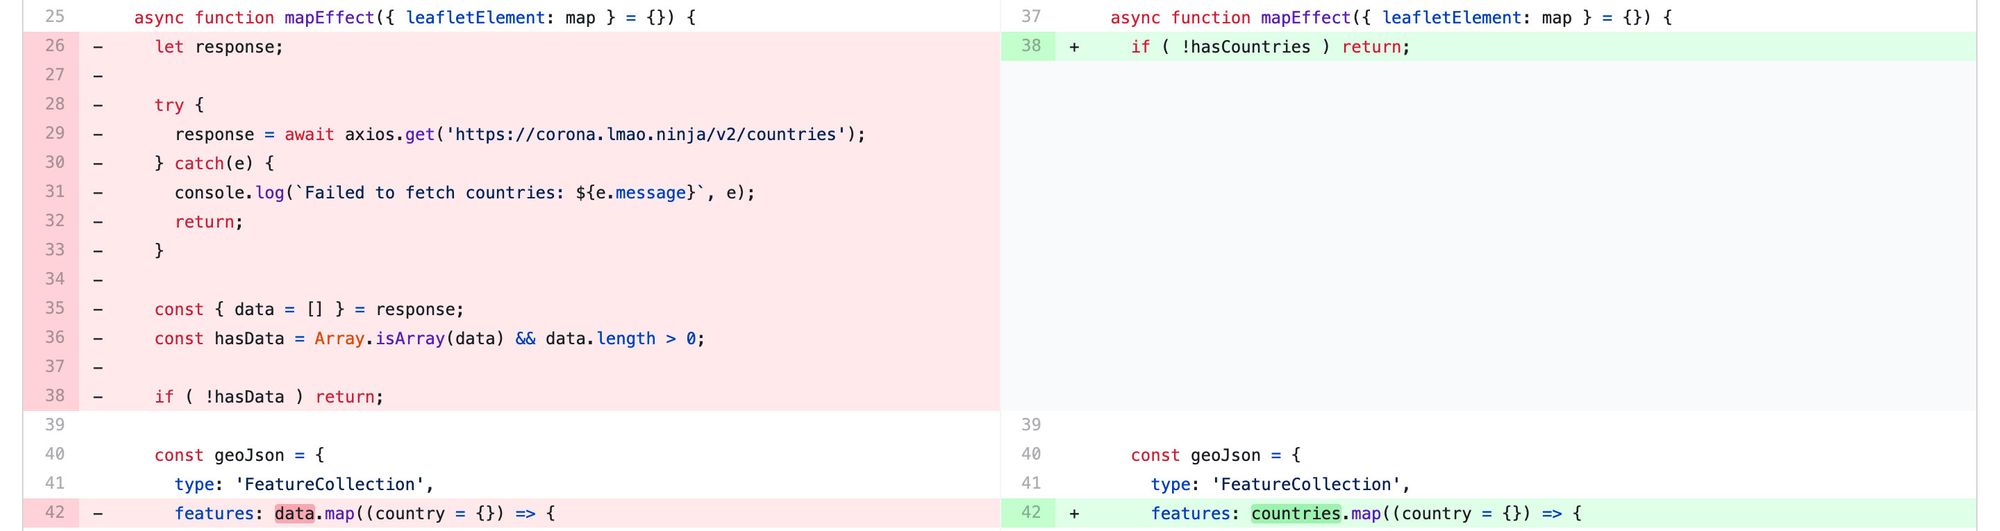 Code diff showing update to map effect
Then, replace hasData with hasCountries:
if ( !hasCountries ) return;
And replace data with countries in the geoJson object where we map our features:
features: countries.map((country = {}) => {
At this point, if you hit save and refresh, you shouldn't notice any difference to what you previously had.
Add a request for our stats
Now that we are using our useTracker hook to fetch our country data, let's also use that to fetch our stats.
Right next to where we set up our useTracker hook before, let's add another request:
const { data: stats = {} } = useTracker({
  api: 'all'
});
And if we add a console.log statement under to see what's inside stats:
console.log('stats', stats);
We should see our stats data object logged out!
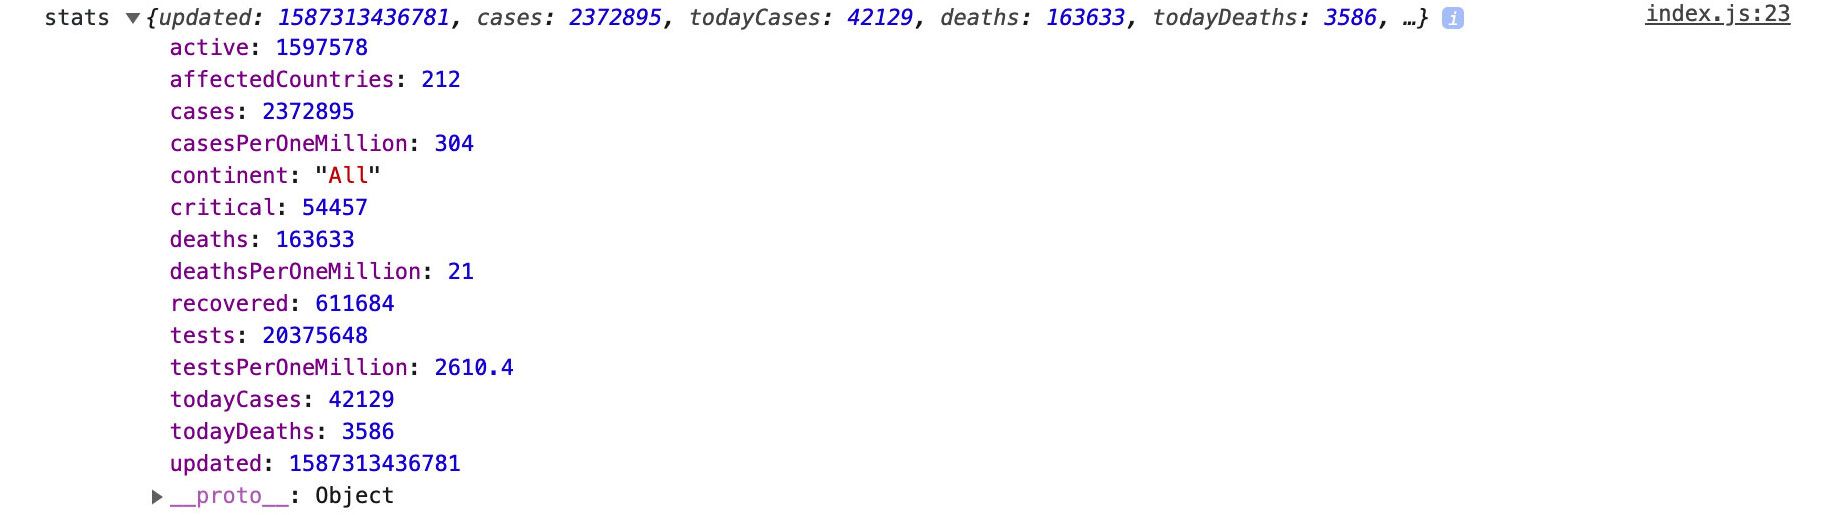 Using console.log to show Coronavirus (COVID-19) statistics
Step 2: Adding statistics to our dashboard
Now that we have our data available to use, let's use it!
To get started adding our statistics to the dashboard, let's create a data structure that will allow us to easily configure the data we want to use.
To do this, let's first create a new array called dashboardStats below hasCountries at the top of the page component:
const dashboardStats = [];
Inside this array, let's add some new objects that specify our data that we're pulling from the stats object we requested. To start, let's try to add:
const dashboardStats = [
  {
    primary: {
      label: 'Total Cases',
      value: stats?.cases
    },
    secondary: {
      label: 'Per 1 Million',
      value: stats?.casesPerOneMillion
    }
  },
  {
    primary: {
      label: 'Total Deaths',
      value: stats?.deaths
    },
    secondary: {
      label: 'Per 1 Million',
      value: stats?.deathsPerOneMillion
    }
  },
  {
    primary: {
      label: 'Total Tests',
      value: stats?.tests
    },
    secondary: {
      label: 'Per 1 Million',
      value: stats?.testsPerOneMillion
    }
  }
]
The reason we're splitting this up into primary and secondary keys, is we're going to use that to differentiate between logically similar stats that we want to style a little bit differently.
_Note: if you're not familiar with the ?. syntax, it's called Optional Chaining. This allows us to chain our properties without worrying about if the objects exist. If stats is undefined, it will simply return undefined instead of throwing an error._
With our stats data, let's add the tracker to our map. Let's remove our current <Map> component and include it nested inside our tracker div in the following:
<div className="tracker">
  <Map {...mapSettings} />
  <div className="tracker-stats">
    <ul>
      { dashboardStats.map(({ primary = {}, secondary = {} }, i) => {
        return (
          <li key={`Stat-${i}`} className="tracker-stat">
            { primary.value && (
              <p className="tracker-stat-primary">
                { primary.value }
                <strong>{ primary.label }</strong>
              </p>
            )}
            { secondary.value && (
              <p className="tracker-stat-secondary">
                { secondary.value }
                <strong>{ secondary.label }</strong>
              </p>
            )}
          </li>
        );
      })}
    </ul>
  </div>
</div>
This code should be immediately following the <Helmet> component if you're following along.
To explain what we're doing:
- We're creating a "tracker" div that will organize our stats
- We move our
<Mapcomponent inside of this tracker - We create a separate section called "tracker-stats"
- Inside of this, we create an unordered list (
ul) - Inside of our list, we loop through all of our stats inside
dashboardStats - For each stat, we create a new list element (
li) and include 2 optional paragraphs that includes our primary stat data and our secondary stat data
Once we reload our page, we should now see a few stats:
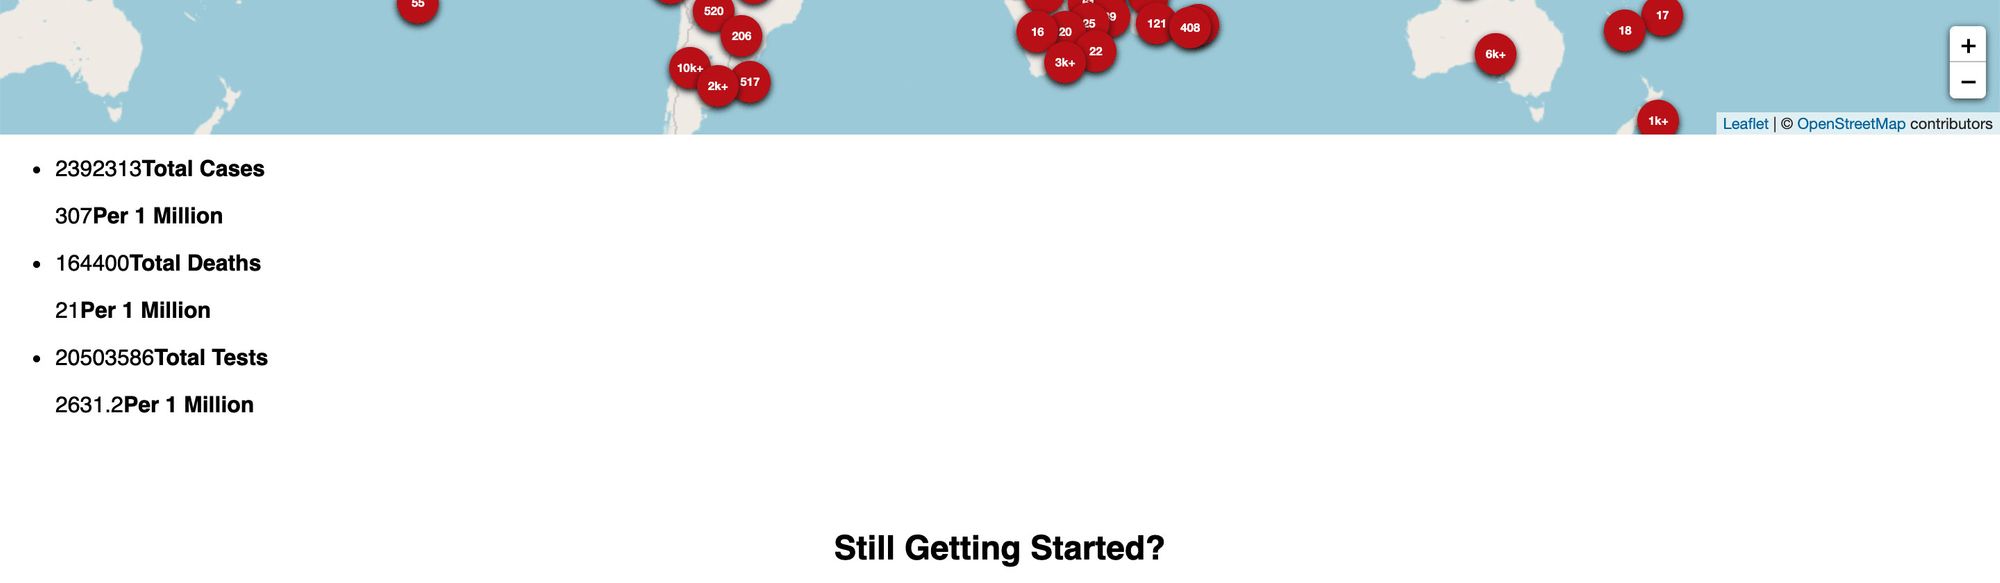 Adding the first statistics to the page
Now that we have our stats on our page, let's make them look like they're in a dashboard.
Let's create a new file called _tracker.scss inside of our src/assets/stylesheets/components directory. Once that file is created, additionally add it to the src/assets/stylesheets/components/__components.scss file:
@import "tracker";
With our new component style file ready to go, let's add some styles into _tracker.scss:
.tracker-stats {

  color: white;
  background-color: $blue-grey-900;
  border-top: solid 1px darken($blue-grey-900, 5);

  ul {
    display: grid;
    grid-template-columns: 1fr 1fr 1fr;
    list-style: none;
    padding: 0;
    margin: 0;
  }

}

.tracker-stat {

  font-size: 2em;
  text-align: center;
  padding: .5em;
  border-right: solid 1px darken($blue-grey-900, 5);
  border-bottom: solid 1px darken($blue-grey-900, 5);

  strong {
    font-weight: normal;
    color: $blue-grey-300;
  }

}

.tracker-stat-primary {

  margin: 0;

  strong {
    display: block;
    font-size: .5em;
  }

}

.tracker-stat-secondary {

  font-size: .5em;
  margin: .8em 0 0;

  strong {
    font-size: .8em;
    margin-left: .4em;
  }

}
Above – we're adding colors and organizational effects, such as using CSS Grid, to allow our data to be organized in an easy to read way and to look good! We're also making use of some pre-existing colors variables that are used within the project to keep the color use consistent.
Once you save those styles and reload the page, it should look much better:
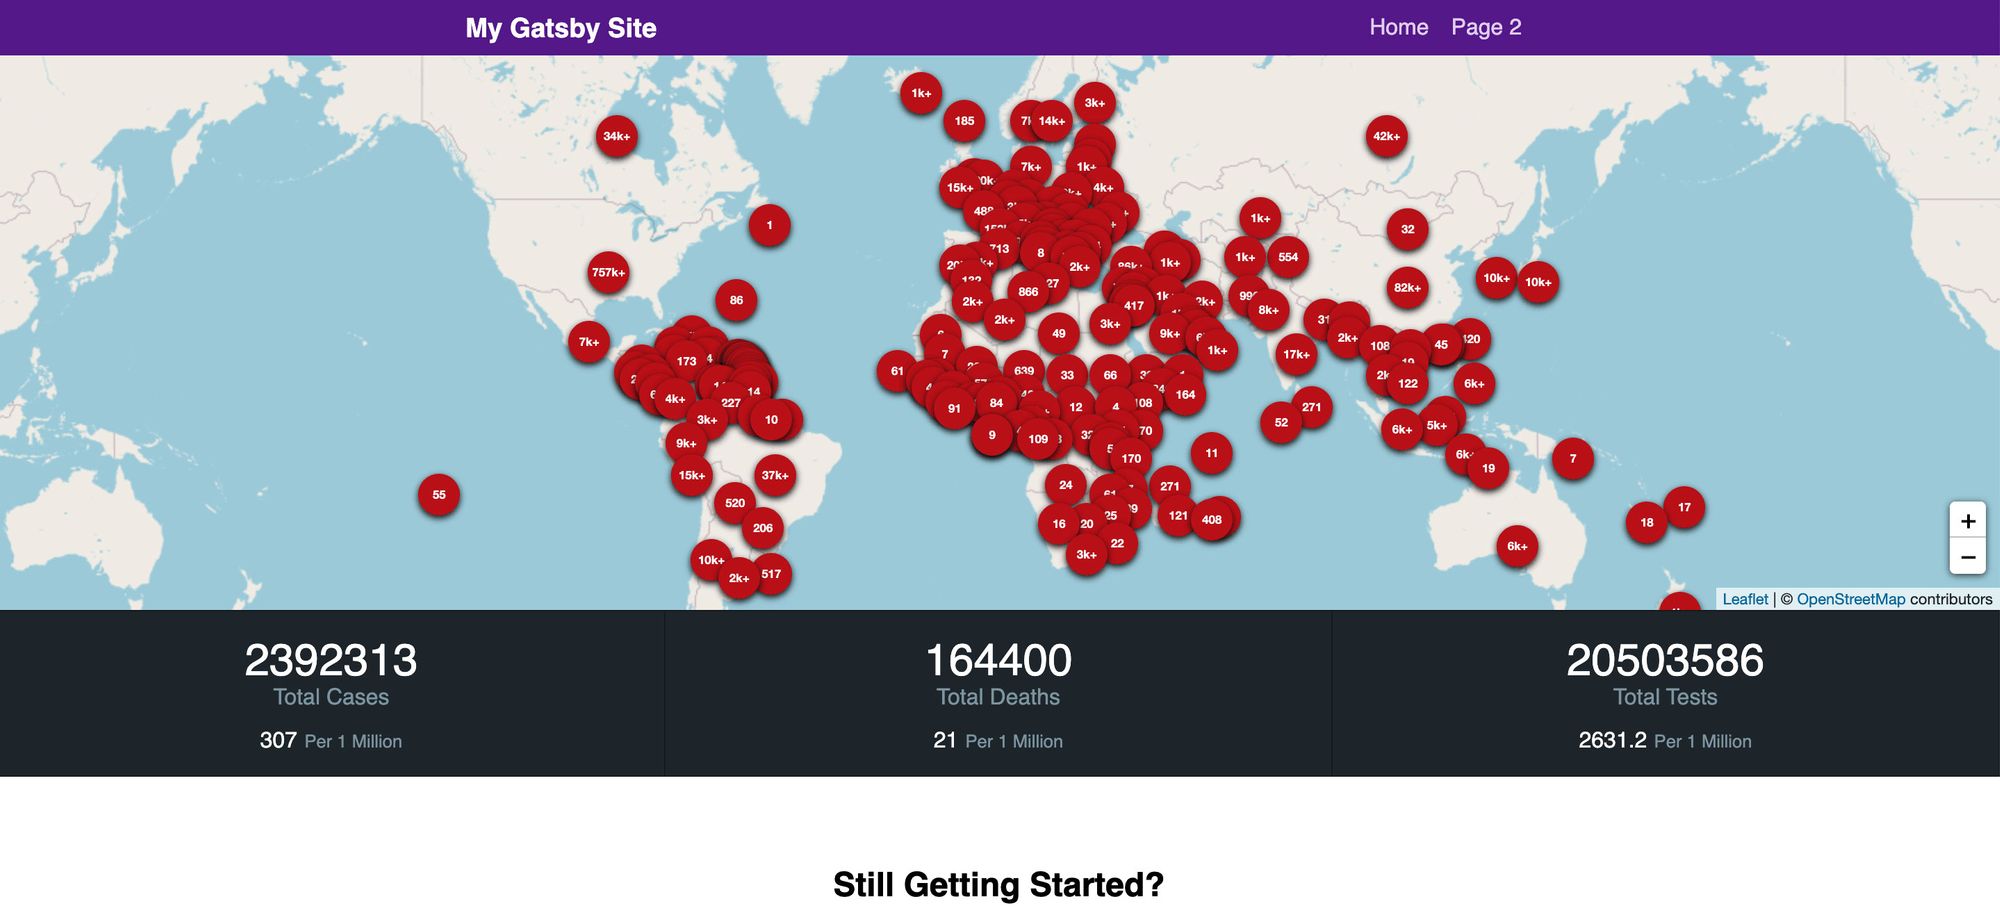 Adding case statistics to the dashboard
From here, feel free to add more stats or adjust them to your liking. In the demo I created, I added the stats for active cases, critical cases, and recovered cases. If you'd like to do the same, you can check out the commit.
Step 3: Make the data human friendly
Now the rest of this walkthrough could be considered optional, but ultimately we want people to be able to read these statistics, right? So let's make the numbers a little more easy to read.
First, let's open our src/lib/util.js file and add this function:
/**
 * commafy
 * @description Applies appropriate commas to large numbers
 */

export function commafy(value) {
  let numberString = `${value}`;

  numberString = numberString.split('');

  numberString.reverse();

  numberString = numberString.reduce((prev, current, index) => {
    const shouldComma = (index + 1) % 3 === 0 && index + 1 < numberString.length;
    let updatedValue = `${prev}${current}`;
    if ( shouldComma ) {
      updatedValue = `${updatedValue},`;
    }
    return updatedValue;
  }, '');

  numberString = numberString.split('');
  numberString.reverse()
  numberString = numberString.join('');

  return numberString;
}
This function will take a number and turn it into a string with commas. To walk through what it does:
- Takes in a value as an argument. For our use, this value will most likely be a number.
- It converts the value into a string. We'll use this to work with adding commas to our number.
- We split that string into an array and reverse it. We want to reverse it because it makes it easier to add our commas depending on the index.
- We use the javascript
reducefunction to recreate our number-string. After every 3 numbers, we want to add a comma. - Once we have our new value with the commas, we want to re-reverse it. So we split it again, reverse the array of characters, and re-join it, which is what we return
And now that we have our commafy function, let's use it. Back inside src/pages/index.js, let's import our function at the top of the page:
import { commafy } from 'lib/util';
Then, in our dashboardStats array, let's replace every number value with a ternary expression and function that will convert our number if it's available:
value: stats ? commafy(stats?.cases) : '-'
This line checks to see if stats exists. If it does, we commafy the cases value. If it doesn't exist, we return a - to show it's unavailable.
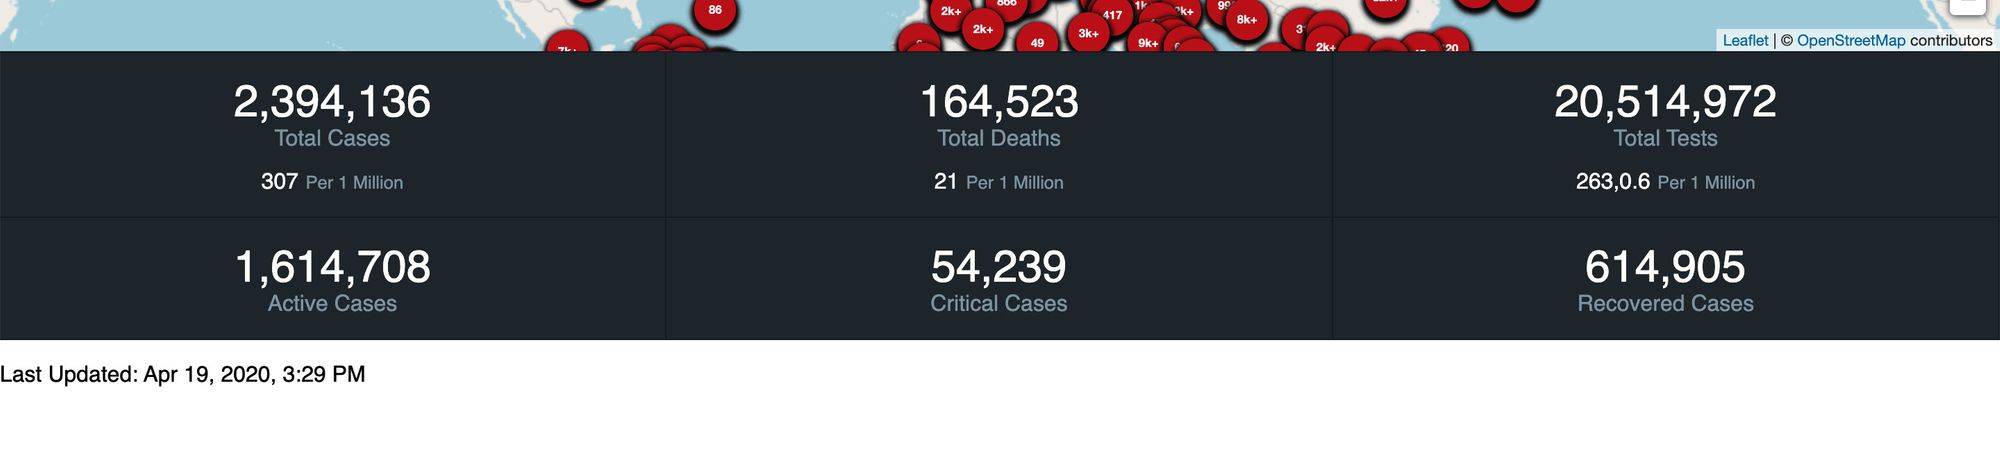
Once we repeat that process for all of our numbers, we can save, reload the page, and see our human friendly numbers!
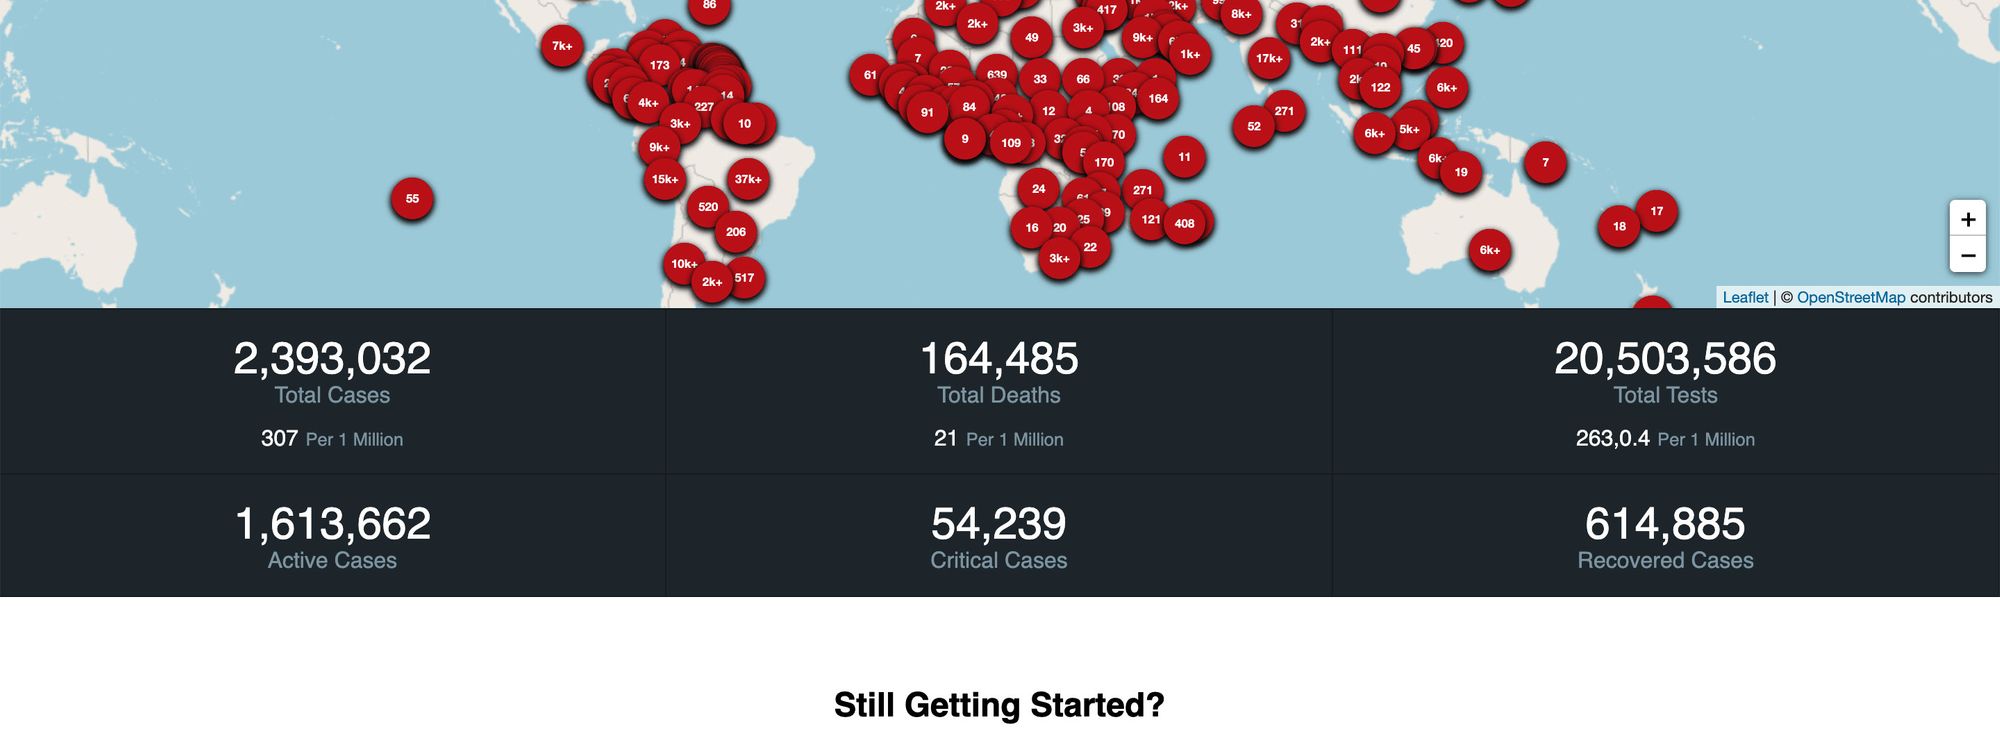 Formatting the statistics to be human readable
Step 4: Add the Last Updated date
Finally, we want to make sure people are staying informed and understand the last time this data was updated. Luckily, our API provides a Last Updated date for us, so let's use it!
At the bottom of our "tracker" div under tracker-stats, let's add the following:
<div className="tracker-last-updated">
  <p>
    Last Updated: { stats?.updated }
  </p>
</div>
This creates a new section where we simply include the updated property from our stats. And if we save and reload the page, we can see the last updated date!
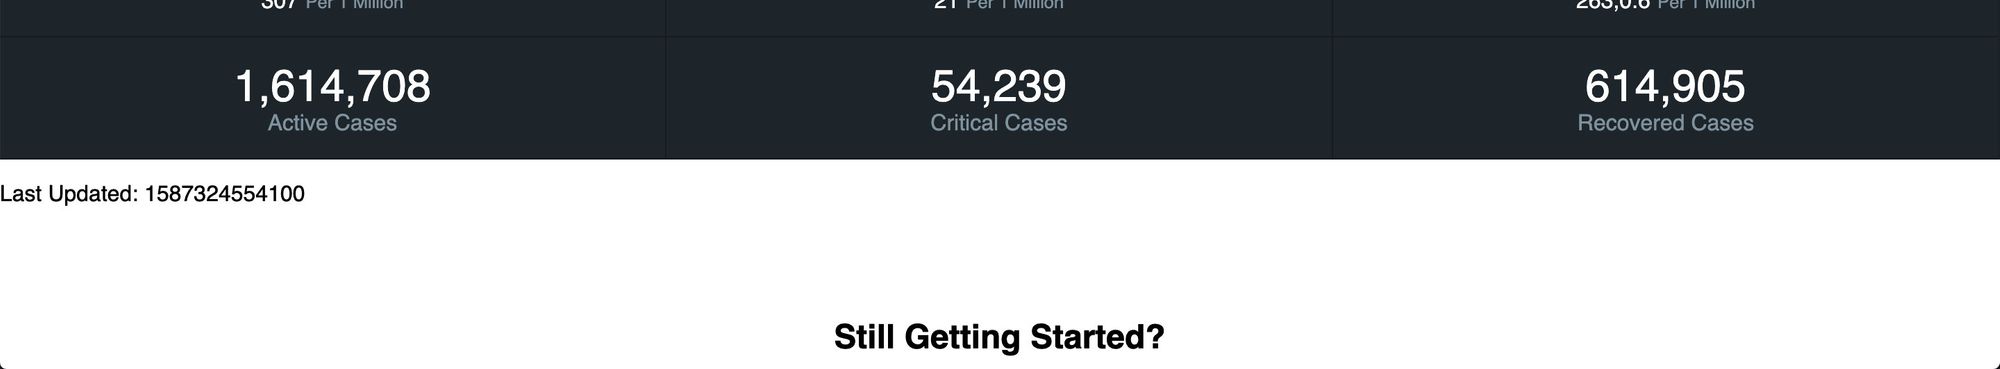 Adding last updated to the dashboard
But how could we even understand what that number is, unless you're the computer crawling this blog post? So let's change it to a human readable format like we did with our numbers.
Inside of our src/lib/util.js file, let's add another function:
/**
 * friendlyDate
 * @description Takes in a date value and returns a friendly version
 */

export function friendlyDate(value) {
  const date = new Date(value);
  return new Intl.DateTimeFormat('en', {
    year: 'numeric',
    month: 'short',
    day: '2-digit',
    hour: 'numeric',
    minute: 'numeric'
  }).format(date);
}
This function creates a new Date object, then uses the javascript International DateTimeFormat API to convert it into a friendly readable format!
Once that's saved, let's import it next to our commafy function at the top of src/pages/index.js:
import { commafy, friendlyDate } from 'lib/util';
Then we can update our code similar to how we updated our numbers:
Last Updated: { stats ? friendlyDate(stats?.updated) : '-' }
And if we save and reload, we see it in a human readable way!
 Formatting the last updated date
Finally for our "last updated" should look like it fits in with the rest of the dashboard, so let's add a few more styles. Inside of our _tracker.scss file we were working with earlier:
.tracker-last-updated {

  color: white;
  background-color: $blue-grey-900;
  padding: .8em 0;

  p {
    color: $blue-grey-300;
    font-size: .8em;
    text-align: center;
    margin: 0;
  }

}
And once we hit save and refresh the browser, we have our dashboard statistics with the last updated time! ?
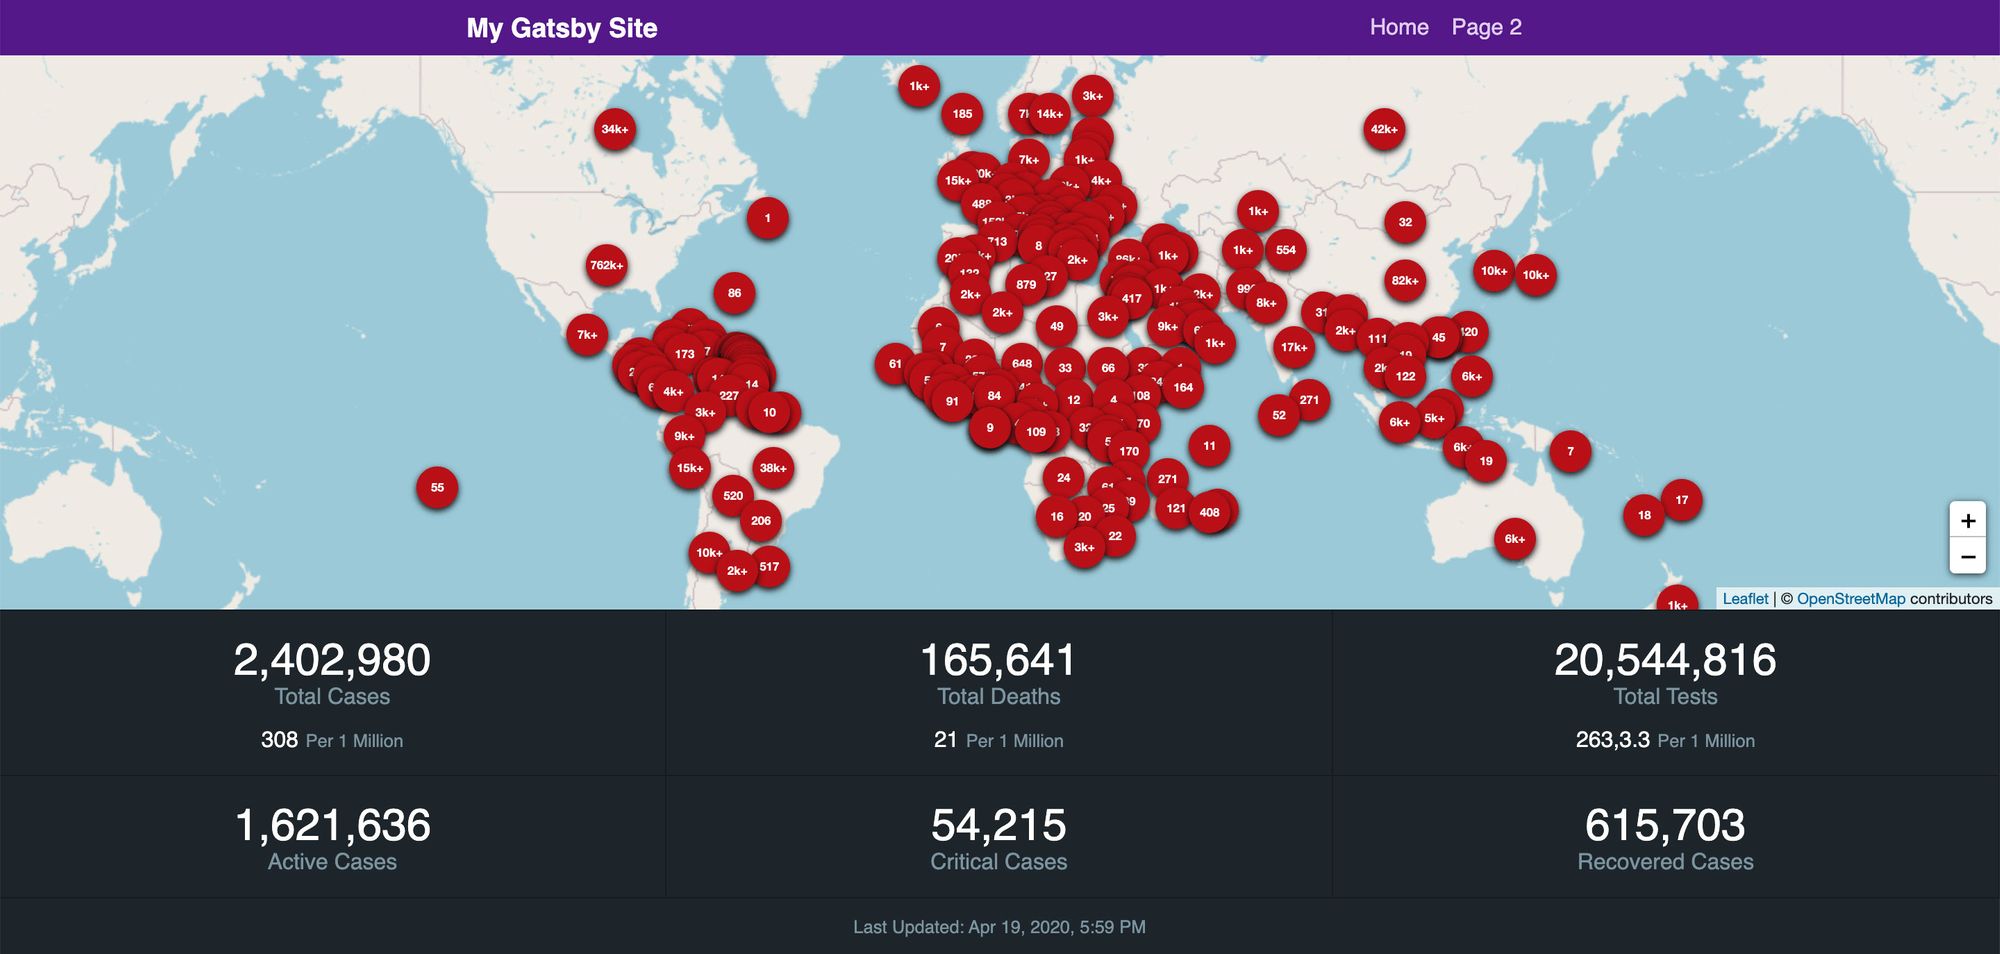 Final dashboard with formatted lasted updated date
What can I do next?
Make the marker tooltip data human friendly
Now that we have our handy commafy and friendlyDate functions, we can reuse those functions to clean up the data in our country marker popups!
Use the fetchTracker function to poll for updates
Inside of the useTracker hook we created, we exported a function called fetchTracker. This allows us to force a request to the API to fetch new data. To make sure our map stays current even when somebody doesn't refresh the page, we can create a timer in javascript to regularly invoke that function to update our dashboard data.
Clear the map layers before re-adding the new ones
One thing we're currently not doing is cleaning up old layers before adding a new one. The way the map is set up, it just keeps layering them on top. What we can do is before we add all of our new layers, we can clear out the old ones. Check out this commit to get started!
Want to learn more about maps?
You can check out a few of my other resources to get started:
- How to create a Coronavirus (COVID-19) Dashboard & Map App in React with Gatsby and Leaflet (Part 1 of this post)
- How to set up a custom Mapbox basemap style with React Leaflet and Leaflet Gatsby Starter
- Anyone Can Map! Inspiration and an introduction to the world of mapping
- How to Create a Summer Road Trip Mapping App with Gatsby and Leaflet
- How to Create your own Santa Tracker with Gatsby and React Leaflet
- How to build a mapping app in React the easy way with Leaflet