

Sentry.io is an external monitoring and logging service which can help you identify and triage errors in your code.
These logs provide information such as a trace stack, breadcrumbs, and (assuming this is a web application) browser data. This can help you triage issues and resolve bugs faster, with less investigative overhead.
How to Prepare Your Sentry Account
Begin by navigating to Sentry and clicking "Get Started". You will be taken to the account creation screen:
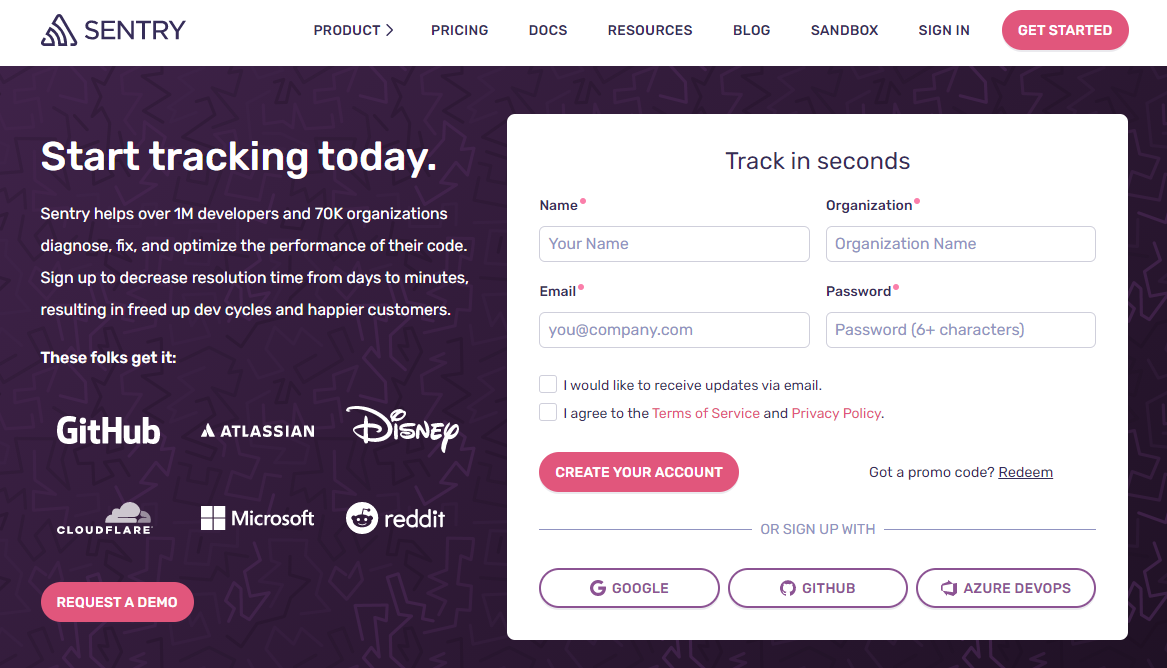
You can either sign up with OAuth or create separate credentials for Sentry. If you choose to create separate credentials, you'll need to enter an organization name now (this can be changed later). I used my username as my organization name.
Once you create your account, Sentry will take you through a tutorial to set up your first project. Click "I'm Ready" to be taken to the first step.

For our purposes, the NODE.JS option is the platform you should select. Then click "Create Project".
This takes you to the instructions for preparing the SDK to integrate with your codebase. Leave that page open as you will need your dsn value.
How to Use Sentry in Your Code
Your next step is to install the necessary Sentry packages:
npm install @sentry/node @sentry/integrations
The @sentry/node package is the core SDK for your Node.js project, and the @sentry/integrations package contains a tool you will use for mapping the file path.
Your Sentry tooling should be loaded as early as possible in your code flow. Ideally, this means you should initialize it within the entry point for your application (that is, index.ts).
Start by importing the packages:
import * as Sentry from "@sentry/node";
import { RewriteFrames } from "@sentry/integrations";
The first import pulls in the Sentry-Node tooling, and the second gives you access to the RewriteFrames integration. This integration allows you to adjust the pathing of the stack trace, which is necessary for properly pointing to your compiled JavaScript files.
Now you need to instantiate the Sentry monitor and provide the configuration:
Sentry.init({
  dsn: process.env.SENTRY_DSN,
  tracesSampleRate: 1.0,
  integrations: [
    new RewriteFrames({
      root: global.__dirname,
    }),
  ],
});
Here you have passed a configuration object to the Sentry.init() method (which is used to instantiate and initialise the Sentry process). To break these options down:
dsnis a unique URL used to connect your Sentry instance to your dashboard. We will explore this a bit later.tracesSampleRatedetermines the percent of events the monitor should send to the dashboard. A value of1.0sends 100% of the captured events – but if you find this to be too noisy you can reduce this number.integrationsloads the integrations you want to use. In this case, you are loading theRewriteFramesoption and setting therootpath for your stack traces toglobal.__dirname(which resolves to the directory you run your application from).
Then, anywhere in your code base where you are logging errors (such as a try / catch block or a .catch() chain), add Sentry.captureException(error) (replacing error with the variable that represents your error object) to pass that error off to your Sentry monitor.
How to Connect Your Code to Your Dashboard
Back on that project setup page, you'll see a URL value for the dsn option in the configuration.

Your dsn should be treated as a secret and not shared with anyone. You can achieve this by adding it to your .env file (assign it to SENTRY_DSN to match with our configuration from the previous step).
The dsn tells Sentry where to send the captured errors, and the dashboard uses it to link those errors to your new project.
A note for front end projects:
Because you do not have access to a.envon the front end, you will need to expose yourdsnpublicly. We will cover how to handle this in the next step.
Once this is set up, you can click "View a sample event for this SDK" in the small print at the bottom of the Sentry page. This will generate a fake error event and take you to the dashboard.
How to Configure Your Sentry Dashboard
The Sentry website will offer you a quick tour of the dashboard, which you can follow if you would like, or you can skip it and continue with this article.


This view shows you the specific details for a captured error event. In this case, it is the sample event generated by Sentry from the previous step.
The top half offers information such as the browser data from the user that triggered the error, the error message, and the error type. The bottom half provides the stack trace and breadcrumbs (actions that took place to trigger this error) – both helpful for reproducing this error in triage.
At the very top you should see your project's name (which defaults to your organization name) and a gear. Click that gear to be taken to your project's settings.

Here you see some configurations for your project. The "Name" determines the name of your project. Changing the "Platform" affects how stack traces are rendered. You are welcome to experiment with the other settings as desired.
For front-end projects:
As mentioned earlier, you will need to expose your DSN publicly. You can set your webpage's URL in the "Allowed Domains" to prevent data being sent from any other source.
On the side bar are a few additional options. Selecting "Client Keys(DSN)" will take you to a page where you can copy your DSN again, if needed. You can also delete and regenerate it if you accidentally exposed it.
Selecting "Alerts" will allow you to configure how you receive notifications for error events. I have mine set to send to a Discord Webhook, but you can configure a number of integration options for receiving your alerts.

Finally you have the main side bar. Here you can configure your organization settings, including renaming your organization or creating additional organizations and projects.
Conclusion
You have now successfully integrated Sentry with your Node.js-Typescript project. You are now ready to start receiving error information, triaging issues, and improving your project's stability.
Feel free to experiment with Sentry's settings and features to personalize your experience to meet your needs. Happy Coding!