
By Dzaky Widya Putra
Do you have repetitive tasks? Something that you do regularly, every week or even every day? Reporting might be one of your weekly or daily tasks. You query or ask for the data, and do some visualizations, then give it to your boss. What if, instead of doing it manually, you were to automate it so you don’t have to do the boring stuff, and you can use your precious time to do other things?
In this tutorial, we are going to make a Telegram Bot that will automate the boring parts of your job — reporting. Oh, and did I mention that it won’t take more than 50 lines of code to build it? ;)
If this is your first time building a Telegram Bot, you might want to read this post first.
Getting started
1. Install the libraries
We are going to use google-cloud-bigquery to query the data from Google BigQuery. matplotlib, numpy and pandas will help us with the data visualization. python-telegram-bot will send the visualization image through Telegram Chat.
pip3 install google-cloud-bigquery matplotlib numpy pandas python-telegram-bot
2. Enable Google BigQuery API
We need to enable the Google BigQuery API first if we want to use the service.
Go to Google Developers Console and create a new project (or select the one you have).
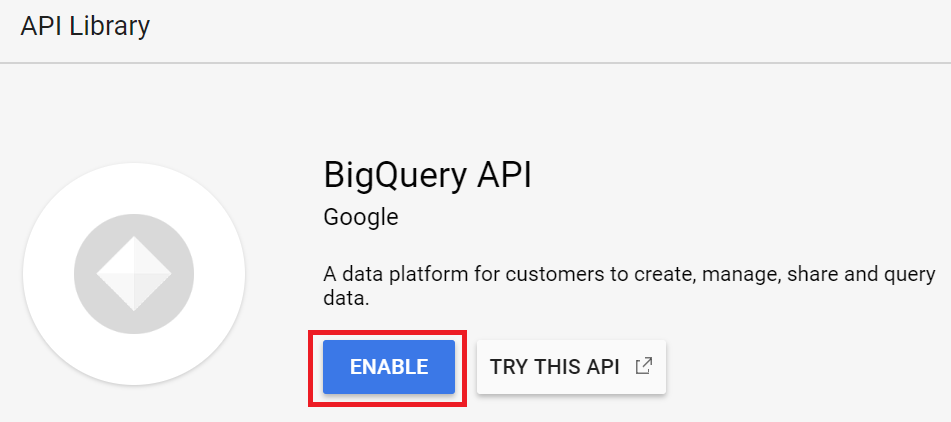
In the project dashboard, click ENABLE APIS AND SERVICES, and search for BigQuery API.
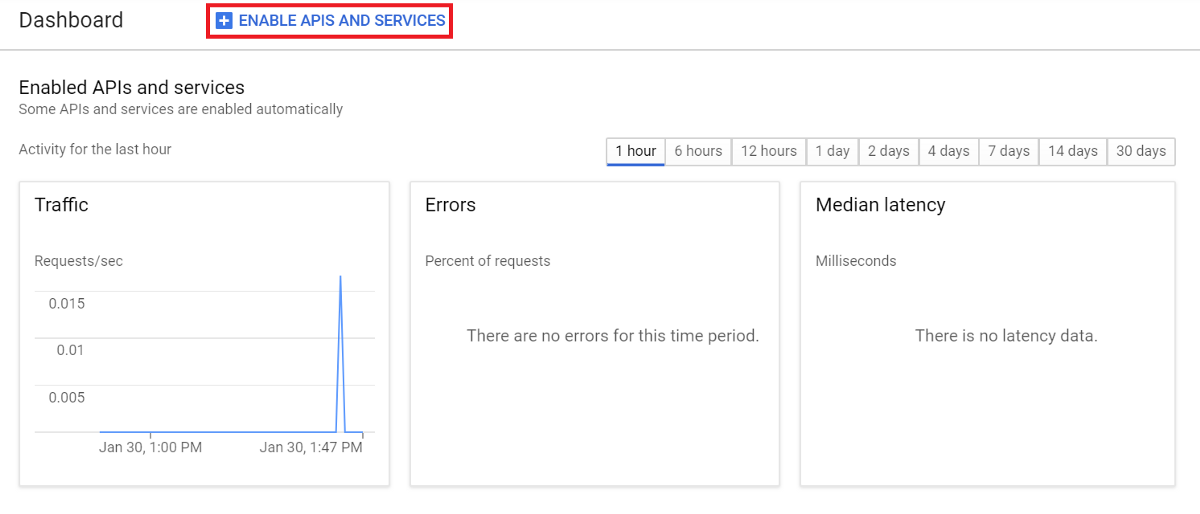
Click ENABLE to enable the API.
- Create the service account key
If we want to use Google Cloud services like Google BigQuery, we need a service account key. This is like our credentials to use Google’s services.
Go to Google Developers Console, click the Credentials tab, choose Create credentials and click Service account key.
Choose New service account, in the Service account name field, enter a name.
From the Role drop-down list, select Project > Owner, then click Create.
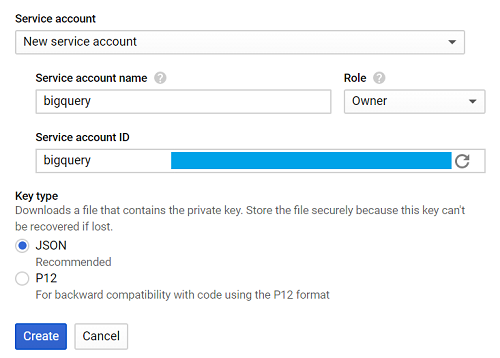
There is a .json file that will be automatically downloaded, name it creds.json.
Set the GOOGLE_APPLICATION_CREDENTIALS with the path of our creds.json file in the terminal.
export GOOGLE_APPLICATION_CREDENTIALS='[PATH_TO_CREDS.JSON]'
Everything should be good now, it is time to write our program.
Write the program
We are going to write the program that will query the data from BigQuery (we assume the data is stored there). Then we will visualize the data and save as an image. The image will then be sent through Telegram Chat.
For this tutorial, we are using the bigquery-public-data.stackoverflow dataset, and we will take the daily total posts data for our report.
The workflow of our program is pretty simple:
Query the table -> Visualize the data -> Save the visualization -> Send the image
Let’s make a single function to define each flow.
1. Query to BigQuery
Import the library first.from google.cloud import bigquery
Make a function called query_to_bigquery which takes query as the parameter.
def query_to_bigquery(query):
    client = bigquery.Client()
    query_job = client.query(query)
    result = query_job.result()
    dataframe = result.to_dataframe()
    return dataframe
This function will return the data as a dataframe.
2. Visualize the data
We are going to use matplotlib to visualize the data.
import matplotlib.pyplot as plt
We take five parameters which are x as the x-axis data, x_label as the x-axis label name, y as the y-axis data, y_label as the y-axis label name, and title as our visualization title.
def visualize_bar_chart(x, x_label, y, y_label, title):
    plt.title(title)
    plt.xlabel(x_label)
    plt.ylabel(y_label)
    index = np.arange(len(x))
    plt.xticks(index, x, fontsize=5, rotation=30)
    plt.bar(index, y)
    return plt
3. Save the image
Let’s use the two functions above to create a visualization then save the image.
Like I mentioned before, we want to send the daily total posts data. Write the query first.
query = """
            SELECT DATE(creation_date) date, COUNT(*) total_posts
            FROM `bigquery-public-data.stackoverflow.post_history`
            GROUP BY 1
            HAVING date > DATE_SUB('2018-12-02', INTERVAL 14 DAY)
            ORDER BY 1
        """
Note that in the query above, HAVING date > DATE_SUB('2018-12-02', INTERVAL 14 DAY) means we want to gather the data starting 14 days ago from 2018–12–02.
We use that date because 2018-12-02 is the last data recorded in bigquery-public-data.stackoverflow.post_history, in different cases you might want to use CURRENT_DATE() instead so you will get the newest data.
Call query_to_bigquery function to get the data.
dataframe = query_to_bigquery(query)
Take the date column as our x-axis data, and total_posts column as our y-axis data.
x = dataframe['date'].tolist()
y = dataframe['total_posts'].tolist()
Visualize the data using the visualize_bar_chart function, then save it as an image.
plt = visualize_bar_chart(x=x,
              x_label='Date',
                          y=y,
                          y_label='Total Posts',
                          title='Daily Posts')
plt.savefig('viz.png')
Wrap that code in a function called get_and_save_image.
def get_and_save_image():
    query = """
                SELECT DATE(creation_date) date, COUNT(*) total_posts
                FROM `bigquery-public-data.stackoverflow.post_history`
                GROUP BY 1
                HAVING date > DATE_SUB('2018-12-02', INTERVAL 14 DAY)
                ORDER BY 1
                """
        dataframe = query_to_bigquery(query)
        x = dataframe['date'].tolist()
        y = dataframe['total_posts'].tolist()
        plt = visualize_bar_chart(x=x,
                    x_label='Date',
                                y=y,
                                y_label='Total Posts',
                                title='Daily Posts')
        plt.savefig('viz.png')
4. Send the image
To be able to send it to the right person, we need to know their chat_idbecause that is one of the required parameters.
Go to the userinfobot then type /start. The bot will reply with our user information, and our chat_id is the number in the Id field.
Make a function called send_image. This function will call get_and_save_image function first to get and save the visualization, then send it to the person whose chat_id is declared in the chat_id variable.
def send_image(bot, update):
    get_and_save_image()
    chat_id = 'CHAT_ID_RECEIVER'
    bot.send_photo(chat_id=chat_id, photo=open('viz.png','rb'))
5. Main program
Lastly, create another function called main to run our program. Don’t forget to change YOUR_TOKEN with your bot’s token.
Remember, this program will send the image automatically based on the day and time we defined.
For example in this tutorial we will set it to 9:00 AM every day.
def main():
    updater = Updater('YOUR_TOKEN')
    updater.job_queue.run_daily(send_image, time=datetime.datetime.strptime('9:00AM', '%I:%M%p').time(),days=(0,1,2,3,4,5,6))
    updater.start_polling()
    updater.idle()

 if __name__ == '__main__':    main()
At the end your code should look like this:
from google.cloud import bigquery
from telegram.ext import Updater

import matplotlib.pyplot as plt
import numpy as np
import datetime

def query_to_bigquery(query):
    client = bigquery.Client()
    query_job = client.query(query)
    result = query_job.result()
    dataframe = result.to_dataframe()
    return dataframe

def visualize_bar_chart(x, x_label, y, y_label, title):
    plt.title(title)
    plt.xlabel(x_label)
    plt.ylabel(y_label)
    index = np.arange(len(x))
    plt.xticks(index, x, fontsize=5, rotation=30)
    plt.bar(index, y)
    return plt

def get_and_save_image():
    query = """
            SELECT DATE(creation_date) date, COUNT(*) total_posts
            FROM `bigquery-public-data.stackoverflow.post_history`
            GROUP BY 1
            HAVING date > DATE_SUB('2018-12-02', INTERVAL 14 DAY)
            ORDER BY 1
            """
    dataframe = query_to_bigquery(query)
    x = dataframe['date'].tolist()
    y = dataframe['total_posts'].tolist()
    plt = visualize_bar_chart(x=x, x_label='Date', y=y, y_label='Total Posts', title='Daily Posts')
    plt.savefig('viz.png')

def send_image(bot, update):
    get_and_save_image()
    chat_id = 'CHAT_ID_RECEIVER'
    bot.send_photo(chat_id=chat_id, photo=open('viz.png', 'rb'))

def main():
    updater = Updater('YOUR_TOKEN')
    updater.job_queue.run_daily(send_image, time=datetime.datetime.strptime('9:00AM', '%I:%M%p').time(), days=(0,1,2,3,4,5,6))
    updater.start_polling()
    updater.idle()

if __name__ == '__main__':
    main()
Save the file and name it main.py.
Run the program by typing this command in the terminal.python3 main.py
Great! Now you have an automatic report generator built with no more than 50 lines of code — pretty cool right?
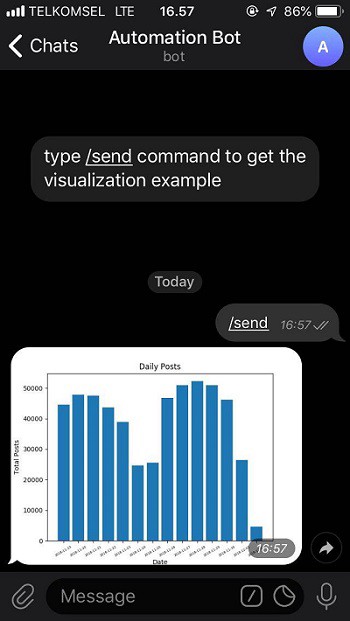
Go check the bot in here, and type the /send command to see the example of the image visualization.
The image below shows the visualization that the bot will send. Now you can just sit back, relax, and wait for the bot to send the report to you everyday :)
You can visit my GitHub to get the code, and please do not hesitate to connect and leave a message in my Linkedin profile if you want to ask about anything.
Please leave a comment if you think there are any errors in my code or writing.
If you have interest in data science or machine learning, you might want to read my post on building sentiment analyzer.
Once again, thank you and good luck! :)