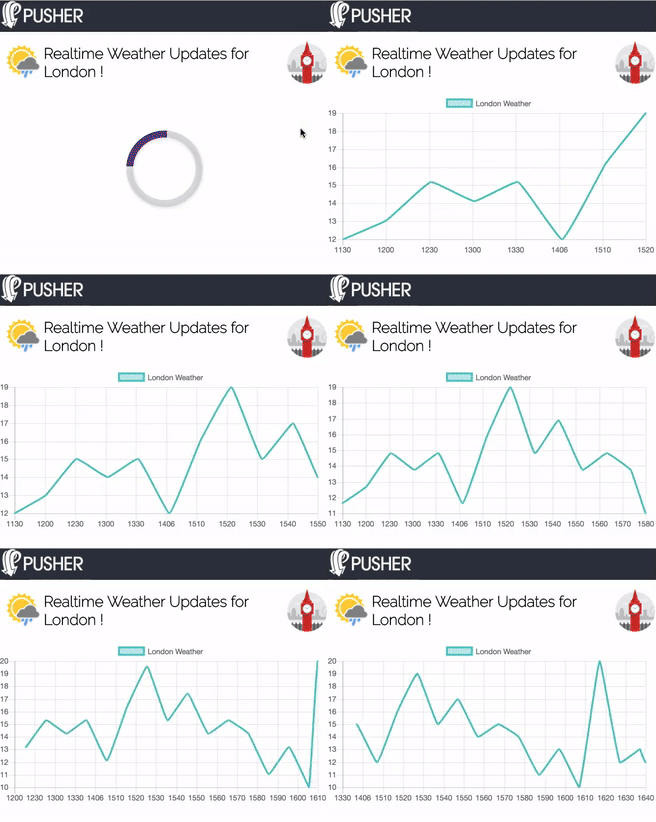
by Rahat Khanna
How to build a Realtime Graph using JavaScript and Pusher

The world needs everything uber-fast now. There are plenty of data streams being generated by different systems every day. They serve in making decisions in many industries. Realtime monitoring and analysis have become very important today. Data streams include realtime monitoring of website traffic, server performance, weather updates, and IOT sensors. It is important to analyze and interpret this burst of data, for which interactive charts and graphs are an excellent solution.
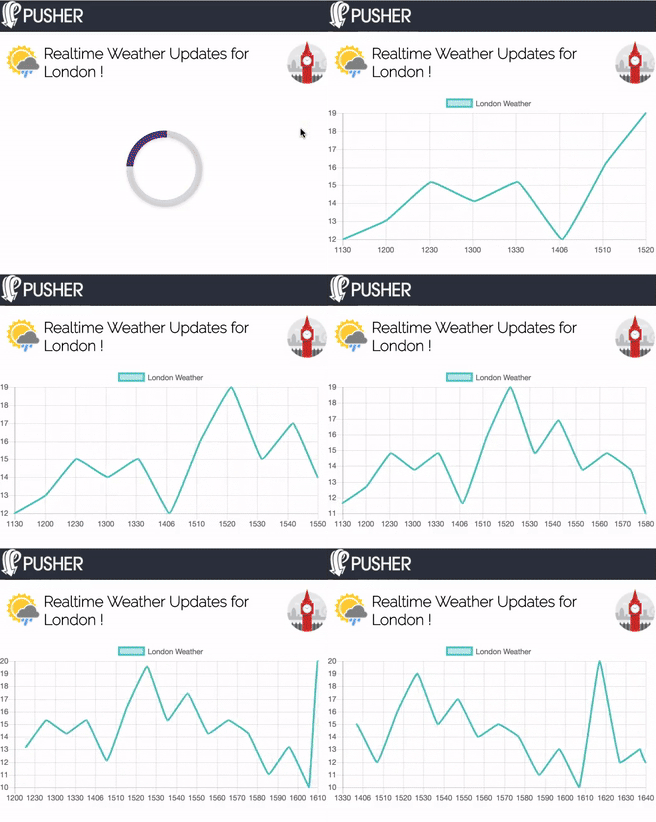
In this article, we will be building a Node.js Server to expose APIs to provide historical data for a metric (in this case, weather in London). It will also provides an API to ingest new data points. We will also be building a front-end app with a Line Chart to display the temperature changes in London weather in realtime. The application we build will look something like this:

Signup for Pusher
The first step to start this tutorial is to Signup at Pusher or login with your existing credentials if you already have an account. After logging in, you will need to create a new app and select Vanilla JavaScript for the front-end along with Node.js for the back-end. You will then be brought to a landing page containing the ‘getting started’ code for both front-end and back-end, which we will use later on in the tutorial.
Node.js Server APIs for Monitoring and Analytics System
The essential APIs for any analytics systems for any metric or entity are:
- Ingestion API — An API to ingest the new data points for any particular entity. In our server for this blog post, we will make an API to ingest new temperature data at a particular time for London. This API can be called by any global weather system or any IOT sensor.
- Historical Data API — This API will return all the data within a range from this date in time. For our server, we will create a simple API. It will return some static historical data with limited data points for London’s temperature values for any day.
Node.js Express Server Skeleton
We will create a basic Express Server along with instantiating the Pusher library server instance. We will create a new folder for our project and create a new file server.js. Add the following code to this file:
API to Get Historical Temperature Data
Now, we will add some static data regarding London’s temperature at certain times during a day and store it in any JavaScript variable. We will also expose a route to return this data whenever someone invokes it using a GET HTTP call.
API to Ingest Temperature Data Point
Now we will add the code for exposing an API to ingest the temperature at a particular time. We will expose a GET HTTP API with temperature and time as query parameters. We will validate that they are not empty parameters. We store them by pushing in the dataPoints array of our static JavaScript variable londonTempData. Please add the following code to the server.js file
In the above code, apart from storing in the data source, we will also trigger an event ‘new-temperature’ on a new channel ‘london-temp-chart’. For every unique data source or a chart, you can create a new channel.
The event triggered by our server will be processed by the front-end to update the chart/graph in realtime. The event can contain all the important data which the chart needs to display the data point correctly. In our case, we will be sending the temperature at the new time to our front-end.
Building the Front-End App using Vanilla JavaScript and Chart.js
Now, we will build the front-end application. It will display a Line Chart representing the changes in temperature for London City at different times throughout the day. The key approach for displaying realtime graphs is:
- We have to make an initial Ajax call to fetch historical data and render the graph with the existing data.
- We will subscribe to any events for new data points being stored on a particular channel.
Basic HTML Template
We will create a new folder called public in our project root and then create a new file index.html in this folder. This file will contain the basic HTML code to render a simple header and a sub-header with the app name along with few icons. We will also import the Pusher JavaScript library from its CDN URL.
Adding Charts Library
In JavaScript and HTML apps, we have to use either SVG or Canvas to build graphical components to represent mathematical graphs. There are numerous open source libraries that can help you render different chart types. These include Bar Charts, Pie Charts, Line Charts and Scatter Charts.
For our project, we will choose Chart.js as it has fairly simple API and renders robust charts using a Canvas HTML tag. You can choose any charting library but keep in mind that the library should have a means to update the chart without completely re-rendering it. Chart.js provides a method on any instantiated chart to update it.
Add the following code to your index.html file at appropriate places
Adding JavaScript File and Instantiating Pusher client-side library
Now we will create a new file app.js in our public folder and also add the following code to instantiate the Pusher client-side library.
In the above code, we have also added few utility methods to make an Ajax call and also show or hide elements from the DOM API.
Adding Code to fetch Historical Data
Now, we will add the code to fetch the historical temperature data to display the graph with the initial values. We will also instantiate a new Chart object with a specific config to render a Line Chart. You can read more about how to construct these configs at the Chart.js documentation.
Please add the following code to the app.js file:
In the above code, we have added a function named renderWeatherChart. This will be used to render the chart using latest data which is embedded in the chartConfig variable under the key datasets. If we want to draw multiple line charts on the same canvas, we can add more elements to this array.
The data key in each of the elements of the array will display the different points on the graph. We will make an ajax request to the /getTemperature api to fetch all the data points and put them into this key. We will call the rendering method to display the graph then. Now we can run the command node server.js and then go to the browser with the following URL to see the initial chart rendered using the data.
http://localhost:9000/In order to style our app properly, please add the following CSS into a new style.css file inside the public folder. Add the following code to that file:
Code to Update Graph on new event received
Now we want to subscribe to the unique channel on which our server will be sending update events for this graph. For our project, the channel is named london-temp-chart and the event is named new-temperature. Please add the following code to process the event and then update the chart in realtime:
In order to see this code in action, you have to refresh the browser and you will see the initial chart. Now we have to ingest a new data point. You would need to call the following API either by using some mock API calling tool or using the following URL with different values in the browser.
http://localhost:9000/addTemperature?temperature=17&time=1500In order to test your chart update code, you can use the following temporary code in your app.js file. It will make dummy Ajax requests to the above URL after a specific time interval.
Here is the GitHub repo for reference to the complete code.
Conclusion
Finally, our realtime analytics app is ready. We will see the weather temperature chart for London city updating in realtime.

We can use the code from this blog post for any charts library. It can also render any type of chart like Bar Chart, Scatter Chart or Pie Chart to update in realtime.
This code can also be used in multiple Enterprise Apps. For example, monitoring dashboards, analytics reports, sensor regulatory apps, and financial apps. The Pusher library helps us send realtime events to all connected client-side apps. These apps can consume the data to update the charts in realtime.
This article was originally published on Pusher’s blog.