

You can modify different properties of a plot — color, size, label, title and so on — when working with Matplotlib.
In this article, you'll learn what a legend is in Matplotlib, and how to use some of its parameters to make your plots more relatable.
You'll then learn how to change the font size of a Matplotlib legend using:
- The
fontsizeparameter. - The
propparameter.
What Is a Legend in Matplotlib?
A legend is a Matplotlib function used to describe elements that make up a graph.
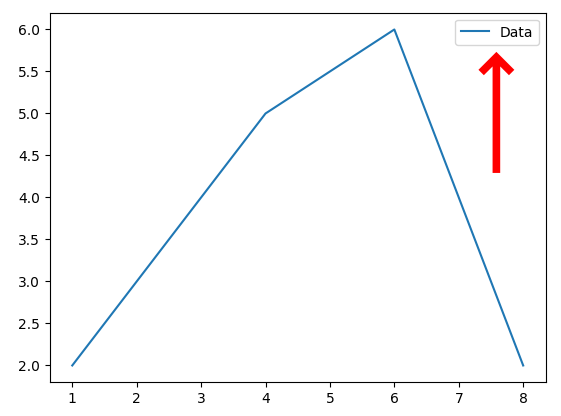
Consider the graph below:
import matplotlib.pyplot as plt

# create a plot
x = [1, 4, 6, 8]
y = [2, 5, 6, 2]

plt.plot(x, y)

plt.legend(["Data"], loc="upper right")

plt.show()
 matplotlib graph with a legend
In the graph above, we described the plot using a legend. A description of "Data" was assigned to the legend, and was placed in the upper right corner of the graph using the upper right value of the loc parameter.
With the legend function, you can assign different descriptions to each line of a graph.
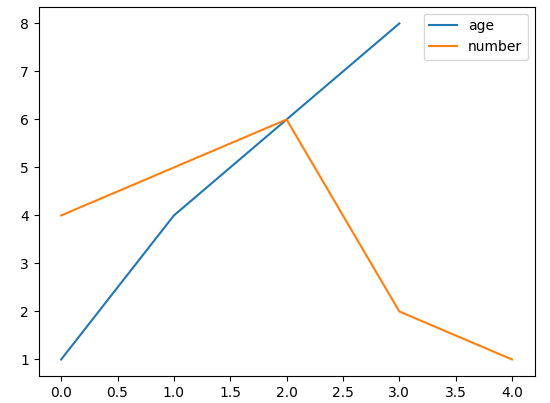
Here's an example:
import matplotlib.pyplot as plt

age = [1, 4, 6, 8]
number = [4, 5, 6, 2, 1]

plt.plot(age)
plt.plot(number)

plt.legend(["age", "number"], loc ="upper right")

plt.show()
 two line graph with different legend descriptions
In the graph above, we've used the legend function to describe each line in the plot.
This makes it easier for anyone viewing the graph to know that the blue line denotes age while the orange line denotes number in the graph.
You can change the position of the legend using the following values of the loc parameter:
bestupper rightupper leftlower leftlower rightrightcenter leftcenter rightlower centerupper centercenter
How To Change Legend Font Size in Matplotlib Using the fontsize Parameter
You can change the font size of a Matplotlib legend by specifying a font size value for the fontsize parameter.
Here's what the default legend font size looks like:
import matplotlib.pyplot as plt

age = [1, 4, 6, 8]
number = [4, 5, 6, 2, 1]

plt.plot(age)
plt.plot(number)

plt.legend(["age", "number"], loc ="upper right")

plt.show()
 matplotlib graph with default legend font size
Here's another code example with the fontsize parameter included:
import matplotlib.pyplot as plt

age = [1, 4, 6, 8]
number = [4, 5, 6, 2, 1]

plt.plot(age)
plt.plot(number)

plt.legend(["age", "number"], fontsize="20", loc ="upper left")

plt.show()
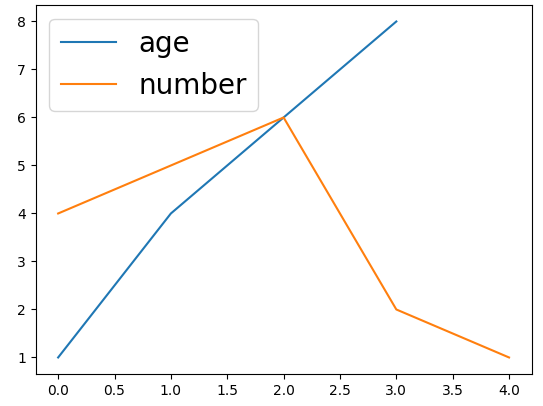
Here's what the legend would look like:
 matplotlib legend size using fontsize parameter
We assigned a font size of 20 to the fontsize parameter to get the legend size in the image above: fontsize="20".
You'd also notice the legend was placed at the upper left corner of the graph using the loc parameter.
How To Change Legend Font Size in Matplotlib Using the prop Parameter
Another way of changing the font size of a legend is by using the legend function's prop parameter.
Here's how to use it:
import matplotlib.pyplot as plt

age = [1, 4, 6, 8]
number = [4, 5, 6, 2, 1]

plt.plot(age)
plt.plot(number)

plt.legend(["age", "number"], prop = { "size": 20 }, loc ="upper left")

plt.show()
Using the prop parameter, we specified a font size of 20: prop = { "size": 20 }.
Here's the output:
 matplotlib legend size using prop parameter
Summary
In this article, we talked about the legend function in Matplotlib. It can be used to describe the elements that maker up a graph.
We first saw what a legend is in Matplotlib, and some examples to show its basic usage and parameters.
We then saw how to use the fontsize and prop parameters to change the font size of a Matplotlib legend.
Happy coding!