By Per Harald Borgen
D3.js is the most popular JavaScript library for creating visual representations of your data. However, it’s a bit tricky to learn, so I think it’s important to start softly.
In this tutorial, you’ll learn how to create your very first bar chart with D3. It’ll give you an intro to the most important concepts, while still having fun building something.
We’ve also created a free D3.js course on Scrimba. Check it out here.
Now let’s get started.
The setup
We’ll use the simplest setup possible, simply importing the D3 library from a CDN.
<html>
  <head>
    <link rel="stylesheet" href="index.css">
  </head>
  <body>
    <svg></svg>
    <script src="https://d3js.org/d3.v4.min.js"></script>
    <script></script>
  </body>
</html>
We’ll write our D3 code in the script tag. Secondly, we’ve added an <svg> element to the DOM. If you want to play around with the code as you read this tutorial, check out this Scrimba playground, which contains the final version of the code.
The first thing we’re going to do is select this element, and style it a little bit.
var svgWidth = 500;
var svgHeight = 300;

var svg = d3.select('svg')
    .attr("width", svgWidth)
    .attr("height", svgHeight)
    .attr("class", "bar-chart");
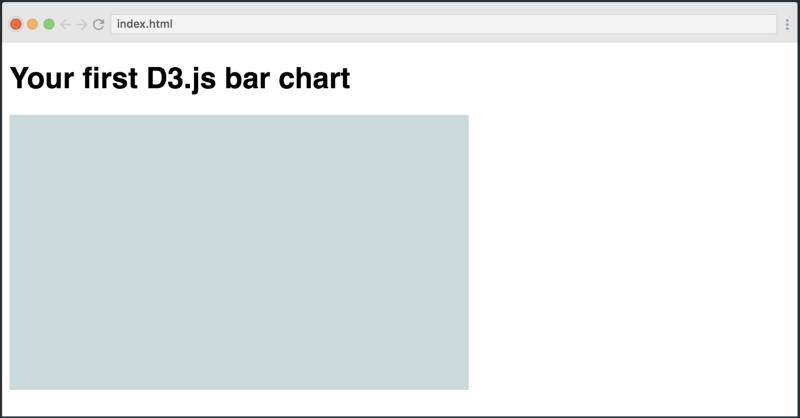
We’re giving it a width and height, plus a .bar-chart class. In our CSS, we’ve styled the class like this:
.bar-chart {
    background-color: #C7D9D9;
}
Here’s the result:
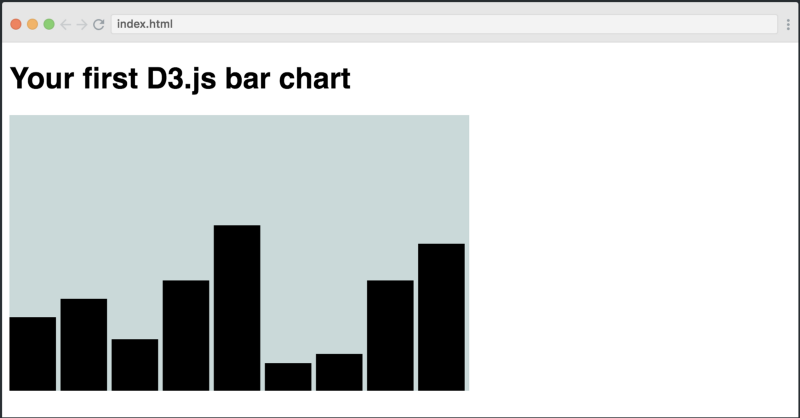
Now we have a nice SVG container where we can draw our bar chart. The code for doing so is a bit complex, so let’s first look at the entire thing and then walk through each step:
var dataset = [80, 100, 56, 120, 180, 30, 40, 120, 160];

var barPadding = 5;
var barWidth = (svgWidth / dataset.length);

var barChart = svg.selectAll("rect")
    .data(dataset)
    .enter()
    .append("rect")
    .attr("y", function(d) {
        return svgHeight - d
    })
    .attr("height", function(d) {
        return d;
    })
    .attr("width", barWidth - barPadding)
    .attr("transform", function (d, i) {
         var translate = [barWidth * i, 0];
         return "translate("+ translate +")";
    });
selectAll()
The first thing we do might seem a bit weird, we’re doing .selectAll("rect"), however, we haven’t yet created any <rect> elements yet. So this method returns an empty selection (an empty array). However, we’re going to create <rect> elements soon using enter().append().
This might seem a bit confusing. But explaining how selectAll() works in combination with enter().append() is outside of the scope of this tutorial. If you want to understand it properly, read this article very carefully.
data()
We then chain the data() method and pass in our dataset. The data will end up dictating the height of each bar.
enter()
The next step is to chain the enter() method. The enter() looks both at the dataset you passed into data() and at the selection we did with selectAll('rect'), and then it tries to look for “matches.” So it creates a mapping between your data and the DOM.
But remember, the selectAll('rect') method returned an empty selection, as there are no <rect> elements in the DOM yet. However, the dataset has nine items. So there are no “matches.”
The enter() method then allows you to create a new <rect> element in the DOM for each item in the dataset which doesn’t yet have a corresponding <rect> element.
append()
On the next line, we append a <rect> element for each of the items. As this method follows after enter(), it will actually be executed nine times, one for each data point that lacks a corresponding <rect> in the DOM.
attr()
The next step is to decide the shape of each of the rectangles (our bars). We need to give it four attributes: height, width, x-position and y-position. We’ll use the attr() method for all of these.
Let’s start with the y-position:
.attr("y", function(d) {
    return svgHeight - d
})
The first parameter dictates which attribute we want to add: in this case, the y-coordinate of the bar. In the second, we get access to a callback function in which we’re going to return the value we want our attribute to have.
Here, we get access to the data point at this step of the iteration process (remember, this method is invoked once per item in the dataset array). The data point is stored in the d argument. We’ll then subtract the given data point, d, from the height of our SVG container.
X and y-coordinates are always calculated starting from the top left corner. So when we subtract the height of the container with the d value, we get the y-coordinate for the top of the bar.
To make the bar stretch from this point and down to the bottom of the SVG container, we’ll need to give it a height equivalent to the value of the data point:
.attr("height", function(d) {
    return d;
})
The next step is to give it a width:
.attr("width", barWidth - barPadding)
Here, we’re simply passing in a simple expression as opposed to the callback function, as we don’t need access to the data point. We’re simply taking a basis in the barWidth variable which we created further up, which is the total width of the container divided by the number of bars. In order to get a small gap between each of the bars, we’ll also subtract padding, which we’ve defined as 5.
The final step is to set the x-coordinates. This expression is a bit more complex:
.attr("transform", function (d, i) {
    var xCoordinate = barWidth * i;
    return "translate("+ xCoordinate +")";
});
Here, we’re first of all taking advantage of a second parameter in the callback, i. This is the index of the given item in the array.
To set the coordinate for each of the bars, we’ll simply multiply the index with the barWidth variable. We’ll then return a string value which describes the transformation for the x-axis, for example "translate(100)". That would push the bar 100 pixels to the right.
And just like that, you have your very first bar chart in D3.js.

If you’re interested in learning more about D3.js, be sure to check out our free course on Scrimba.
Thanks for reading! My name is Per Borgen, I'm the co-founder of Scrimba – the easiest way to learn to code. You should check out our responsive web design bootcamp if want to learn to build modern website on a professional level.
 _
_