
By Ondrej Chrastina
I bet most of you have implemented a web application before. Some of you may even have created a Progressive Web App (PWA) that can act as a native app installed in a device. You’ve maybe followed my tips to make your app fully compliant with prescribed PWA rules and conventions via the Lighthouse audit tool.
Now, wouldn’t it be nice to run the audit every time some of your colleagues updates the code-base? Accidents happen, and even if you and your colleagues strive for a 100% compliant PWA, it is always great to get early warnings, immediately after each build.
In the following article, I’ll describe how to check the compliance automatically by embedding the Lighthouse PWA audit into your continuous integration pipeline.
I’ll start exactly where I left off in my previous article (that is, working with the sample travel application that lists interesting places to visit). The app stores its data in the Kentico Cloud headless CMS and it meets all the PWA requirements. Following each implementation step, I will provide a GitHub link to the code state to allow you to try the changes step by step, without the need to write the code on your own.


I will use the Lighthouse npm package. Although Lighthouse could be used directly from the command line, its programmatic form is better as it properly reports success, failure, and the audit score.
I’ll do basically two things. First, I’ll show how to use the package the from command line to emit a JSON string with the audit results into my console window. Then I will show how to use the npm package in a continuous integration pipeline.
How to use the Lighthouse package from the command line
Let’s start by installing Lighthouse as a development dependency to the project.
npm install --save-dev lighthouse
For deployment, I am using Surge service. You just have to register on its site and install the CLI tools (in the following example globally). Then, you’re able to deploy the folder into a *.surge.sh sub-domain.
npm install -g surge
surge /dist your-own-subdomain.surge.shfor example deploy the “dist” folder to the specified URL. This requires you to either log in or set the surge environment variables with the login and token.
In your package.json file, define a public URL where your app will be deployed, like so:
{..."config": { "deployUrl": "https://your-own-subdomain.surge.sh"},...}
Lighthouse will be configured to perform the audit against this URL. But, in order to do that, it needs to wait a few seconds before the app (or a new version of it) becomes publicly accessible.
Surge sometimes takes its time when publishing your app. Therefore, you should use the npm-delay package (or something similar) to wait for two seconds before performing the audit. Let’s get through it. Install the package to the development dependencies.
npm install --save-dev npm-delay
Once you’re done with installing, define the script command for deployment using Surge to your URL. Then, define the “lighthouse” script command that will build the app in production mode into the dist folder, use the “deploy” command, wait for two seconds (to make sure that last version of app is publicly accessible), and then run the PWA audit against the application’s URL.
{..."scripts": { ... "deploy": "surge dist %npm_package_config_deployUrl%", "lighthouse": "npm run build && npm run deploy && npm-delay 2000 && lighthouse --chrome-flags=\"--headless\" --quiet --output=json %npm_package_config_deployUrl%", ... }...}
Alright, let’s run the command:
npm run lighthouse
In the console, you’ll see a huge JSON string with the audit result. What you want to inspect is the reportingCategories property, its inner part (report) named “Progressive Web App” with its property called score.
{ ... "reportCategories": [ .... { "name": "Progressive Web App", ... "id": "pwa", "score": 100 } ... }

Add the Lighthouse check to the Continuous Integration pipeline
To plug the PWA audit into the CI pipeline, we can use the programmatic approach of using Lighthouse. First of all, you’ll want to define the JavaScript script that will check the score of you PWA.
The script uses the URL defined in the package.json file. In that script, there is a function used to run the Headless Chrome and perform the Lighthouse audit on it. After the audit is finished, the script will wait for two seconds to be sure that your application is deployed and accessible. Finally, the script selects the value from the audit result JSON string and checks whether it meets the defined score level — 100 in this case. Otherwise it returns the exit code 1, which will in turn cause the Travis CI build to fail.
const lighthouse = require('lighthouse');const chromeLauncher = require('chrome-launcher');const appConfig = require('./package');
const opts = { chromeFlags: ['--headless']};
function launchChromeAndRunLighthouse(url, opts, config = null) { return chromeLauncher.launch({ chromeFlags: opts.chromeFlags }).then(chrome => { opts.port = chrome.port; return lighthouse(url, opts, config).then(results => { delete results.artifacts; return chrome.kill().then(() => results); }); });}
launchChromeAndRunLighthouse(appConfig.config.deployUrl, opts).then(results => { setTimeout(() => { if (results.reportCategories.filter((item) => item.id === "pwa").length) { const score = results.reportCategories.filter((item) => item.id === "pwa")[0].score if (score >= 100) { console.info(`PWA score is 100.`); process.exit(0); } console.error(`Score is lower than 100. It is ${score}`); process.exit(1); } console.error(`No PWA score provided by lighthouse.`); process.exit(1); }, 2000); });
Let’s define the new script in the package.json file.
{... "scripts": { ... "check-pwa-score": "node checkLighthouse.js" ... }...}
Finally trigger Travis build and publish out a 100% compliant PWA!
I am using a yaml file for Travis configuration. Basically, you just sign in to this service by your GitHub account, turn on the CI to repository in the Travis UI, and then you just commit the file .travis.yml to the root of your repository.
sudo: requireddist: trustylanguage: node_jsnode_js:- "stable"before_script:- npm installbefore_deploy:- npm run builddeploy: provider: surge project: ./dist/ domain: https://kentico-cloud-sample-angular-pwa-app.surge.sh skip_cleanup: trueafter_deploy:- npm run check-pwa-score
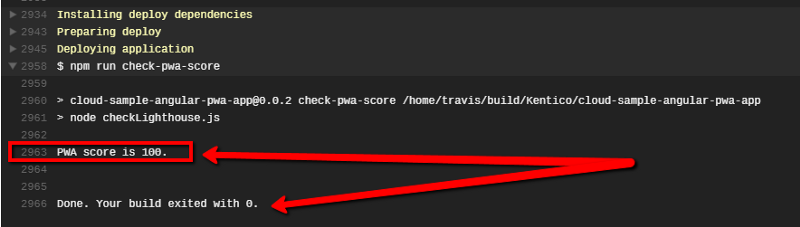
As you can see at the bottom, there is an after-deploy action that checks the PWA audit score.

Voila! Your build pipeline now automatically checks the PWA audit score.
From now on, should any of your colleagues hurt the compliance of your PWA app, they will immediately be warned by Travis.
Final words
Good job! If you’ve followed the steps, you’ve successfully added the Lighthouse npm package to get the JSON string with the results to the console.
You’ve also set things up to automatically publish your app, wait two seconds, and use the Lighthouse functionality in the Headless Chrome to check for your score in a Travis CI pipeline.
Now, you no longer have to lose sleep over your precious app!