By Umesh Yadav
Developers spend a lot of time optimizing websites to provide a better user experience. Web Vitals are a set of useful metrics that aim to capture the user's experience on a web page.
These are the important web vitals we'll consider in this article.
Time to First Byte (TTFB)
Time to first byte measures the time taken by the client's browser to receive the first byte of the page from the web server after the user sends the request.
You should aim for anything between 200-500ms. If your website takes longer than this, then you should definitely try to optimize this value.
First Contentful Paint (FCP)
First contentful paint measures the time taken to render the first image or text of the page after it has started to load.
To provide a good user experience, sites should aim for a FCP of within 1 second of the page starting to load.
In the below image, the FCP happens in the 4th image, as that's when the first text and image load.

Largest Contentful Paint (LCP)
Largest contentful paint measures the time taken to render the largest image or text of the page after it has started to load.
To provide a good user experience, the LCP should occur within 2.5 seconds of when the page first starts loading.
First Input Delay (FID)
First input delay measures any delay in the processing of the first user interaction with the page. It can be a button click, page scroll, or link click.
For example, it measures the time taken from the user clicking the button to the browser starting to process the event.
To provide a good user experience, pages should have a FID of less than 100 milliseconds.
Cumulative Layout Shift (CLS)
Cumulative layout shift measures the number of times that elements within a page shift around during loading.
In the below image, if you watch carefully the page loads all the text and boxes first. But once the image loads all the other components are pushed down to the bottom. Here CLS is the shift that happens after the image loads.
To provide a good user experience, pages should maintain a CLS of less than 0.1.
Next.js is a React framework that provides SSR and static website generation. In this blog, I will show you how can you track each of these web vitals for your Next.js application using Quickmetrics.
Create a Quickmetrics Account
Quickmetrics is a simple metrics collection provider. It has a very generous free tier which you can use to track enough user metrics to gain important insights.
To set up your account, go here. You can sign up using your email and password.
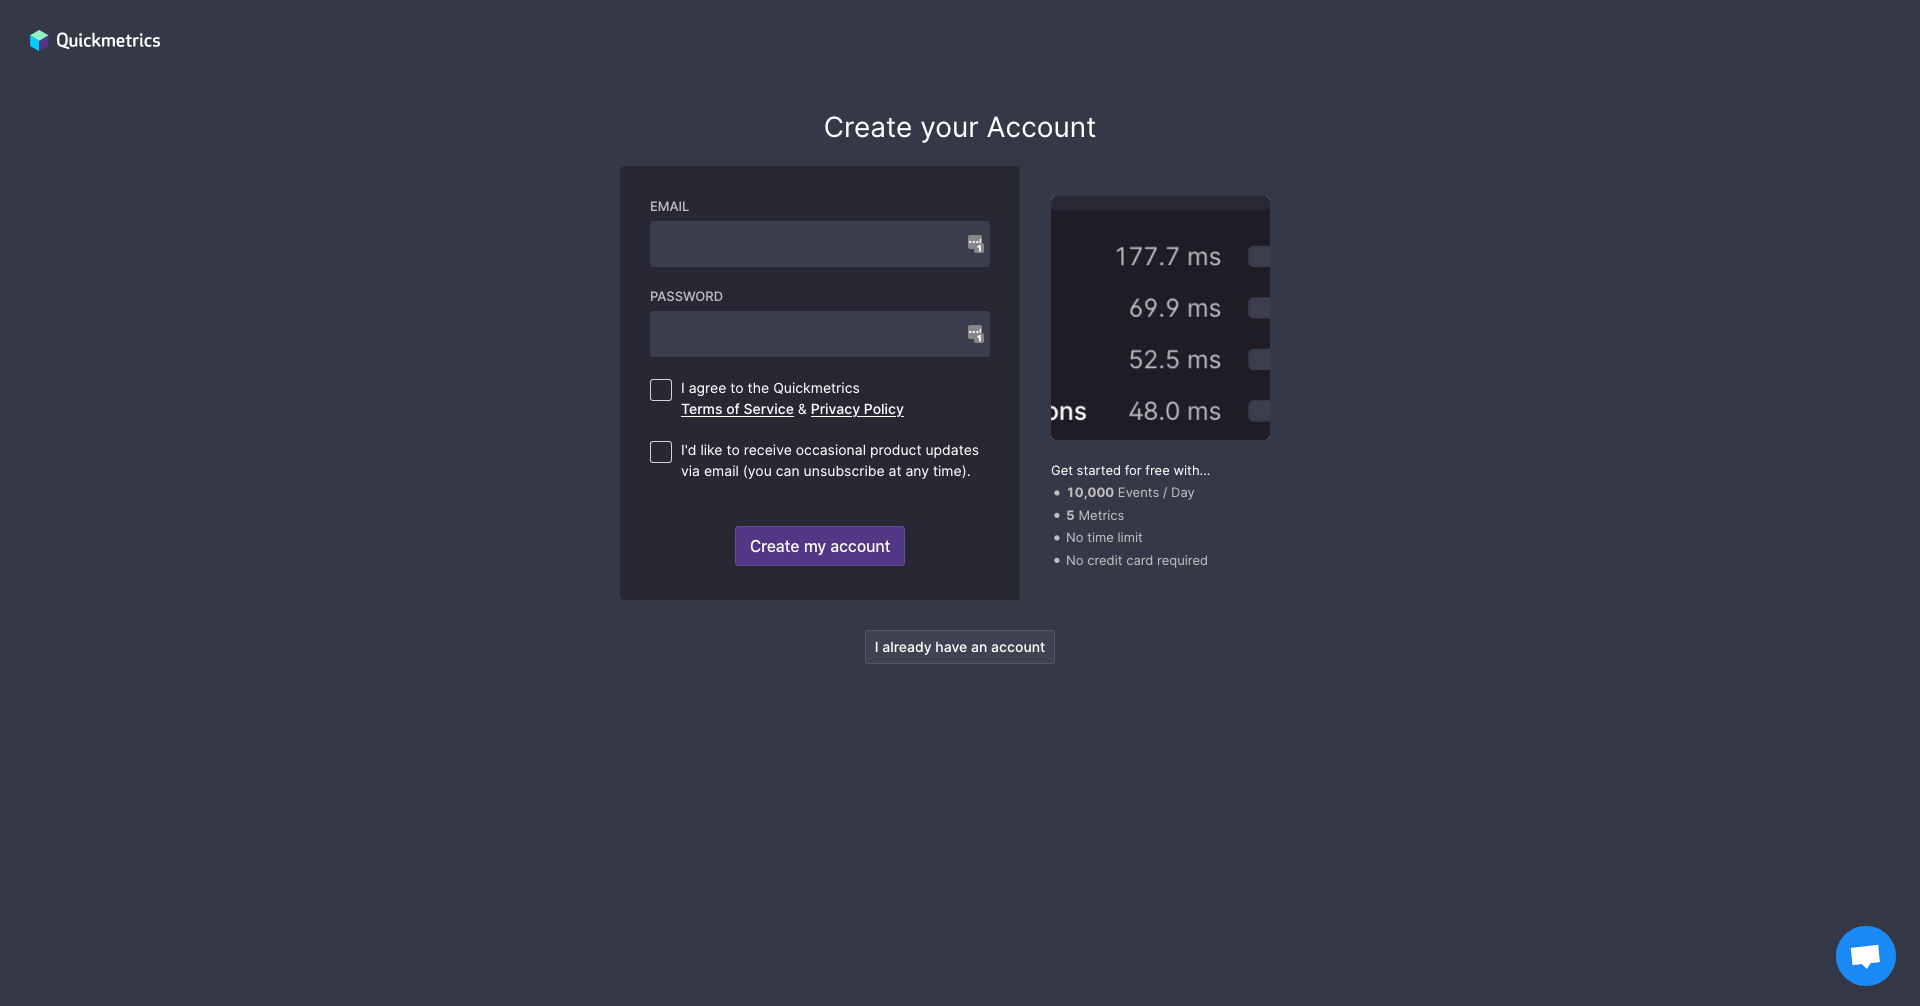 Quickmetrics Signup Page
After you have signed up successfully, you will get your API_KEY. Please store this key in a secure place so that you can use it later.
How to Measure Web Vitals in your Next.js App
Next.js provides an inbuilt way to measure various performance metrics. To measure any of the supported metrics, you will need to create a custom App component and define a reportWebVitals function.
In case you don't have an app ready, please refer to this guide to create one.
import "../styles/globals.css";

export function reportWebVitals(metric) {
  switch (metric.name) {
    case 'FCP':
      // handle FCP results
      break
    case 'LCP':
      // handle LCP results
      break
    case 'CLS':
      // handle CLS results
      break
    case 'FID':
      // handle FID results
      break
    case 'TTFB':
      // handle TTFB results
      break
    default:
      break
  }
}


function MyApp({ Component, pageProps }) {
  return <Component {...pageProps} />;
}

export default MyApp;
In the above example, we are using metric.name to filter the web vitals. Once you have filtered the metrics and have the web vital data with you, we need to send these metrics to Quickmetrics.
const sendMetric = ({ name, value }) => {
  const url = `https://qckm.io?m=${name}&v=${value}&k=${process.env.NEXT_PUBLIC_QUICK_METRICS_API_KEY}`;

  // Use `navigator.sendBeacon()` if available, falling back to `fetch()`.
  if (navigator.sendBeacon) {
    navigator.sendBeacon(url);
  } else {
    fetch(url, { method: "POST", keepalive: true });
  }
};
Now we will get the name and value from the metric object which reportWebVitals provides. We are passing this value to the sendMetric method. Inside this method, we are building the Quickmetrics URL for raising metrics (you can refer to the docs to learn more about this).
We are using sendBeacon to send the metric to Quickmetrics if it is present. If it's not, we fall back to fetch (it's provided by Next.js, you don't have install anything).
To learn more about why we are using
sendBeacon, please read this.
Now you just have to call sendMetrics from each switch case. This is how your code should look at this point:
import "../styles/globals.css";

const sendMetric = ({ name, value }) => {
  const url = `https://qckm.io?m=${name}&v=${value}&k=${process.env.NEXT_PUBLIC_QUICK_METRICS_API_KEY}`;

  // Use `navigator.sendBeacon()` if available, falling back to `fetch()`.
  if (navigator.sendBeacon) {
    navigator.sendBeacon(url);
  } else {
    fetch(url, { method: "POST", keepalive: true });
  }
};

export function reportWebVitals(metric) {
  switch (metric.name) {
    case "FCP":
      sendMetric(metric);
      break;
    case "LCP":
      sendMetric(metric);
      break;
    case "CLS":
      sendMetric(metric);
      break;
    case "FID":
      sendMetric(metric);
      break;
    case "TTFB":
      sendMetric(metric);
      break;
    default:
      break;
  }
}

function MyApp({ Component, pageProps }) {
  return <Component {...pageProps} />;
}

export default MyApp;
Here is the link to the repo in case you want to look at the entire code.
Now store your Quickmetrics API key inside .env to send the metrics.
NEXT_PUBLIC_QUICK_METRICS_API_KEY=your_key
Next, run your website using yarn dev or npm run dev. Visit your website on http://localhost:3000. Refresh it multiple times so that you generate enough data to visualize.
Visualize Metrics on Quickmetrics
Now go to the Quickmetrics metrics page. You should see metrics like this:
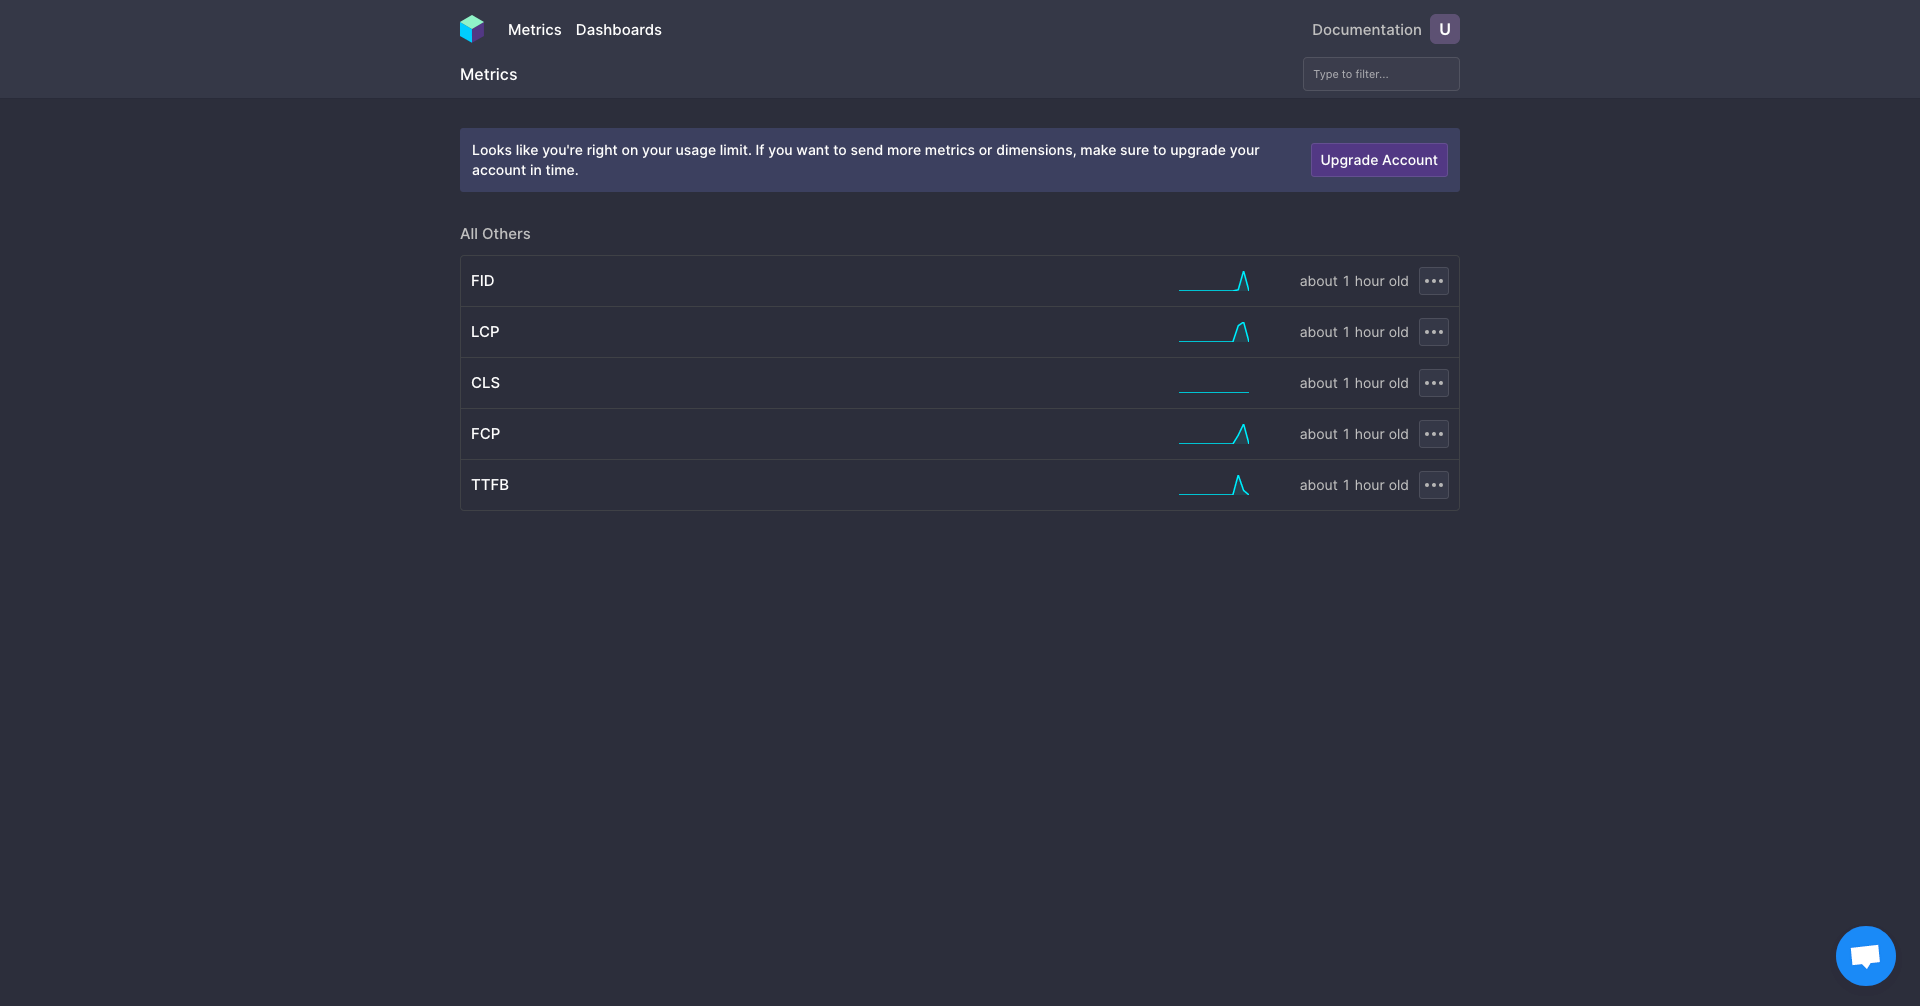 Quickmetrics Metrics Page
You can click on these individual metrics to see the data and interpret the results.
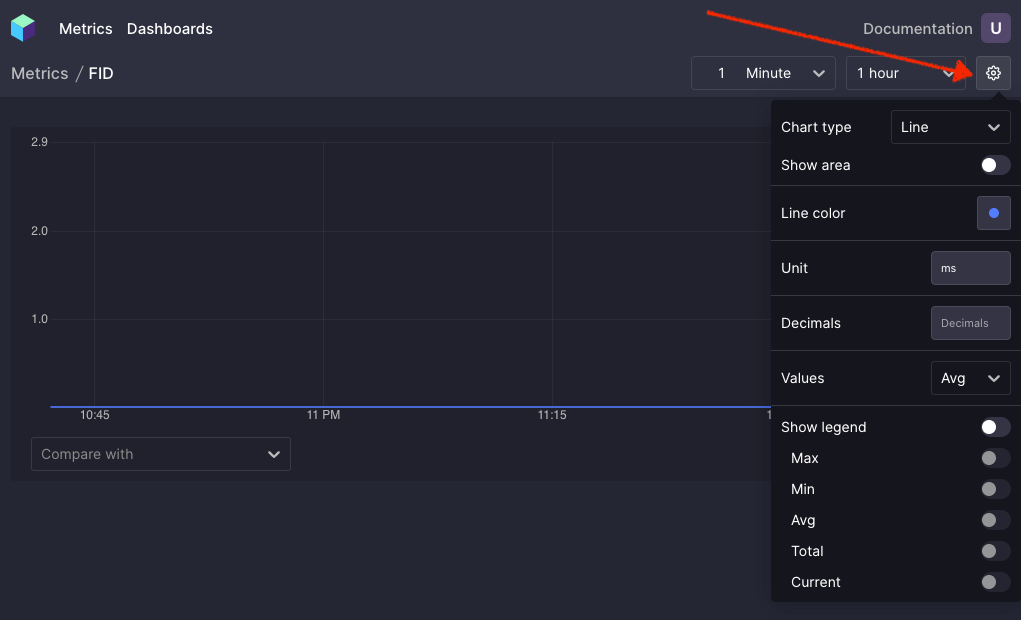 Individual Metric Panel
You can click on the settings icon as shown in the above image to customize the graphs. You can set the chart type, unit, and value operations like avg, sum, max, min, etc.
Let's take a look at these graphs to understand them in more details.
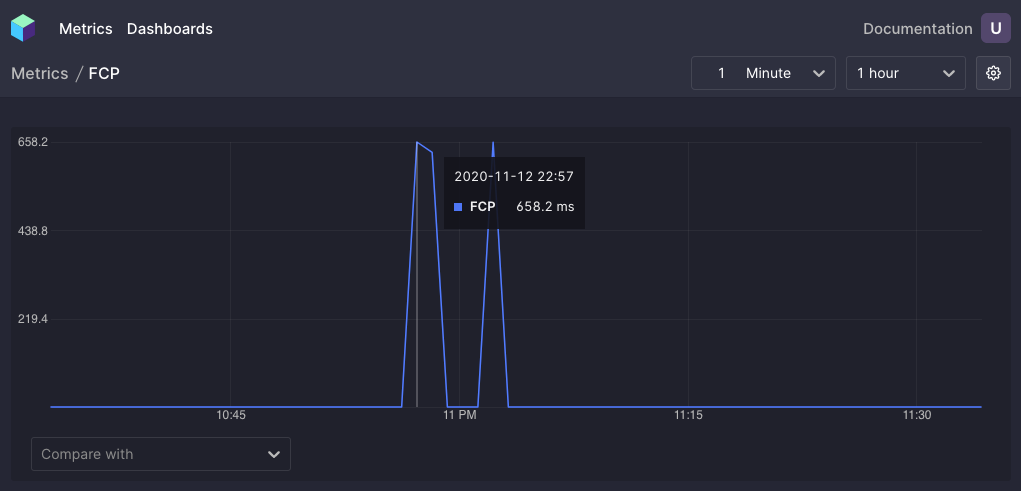 FCP Metric
The above graph represents the FCP metrics of my website. I am taking the avg here. If you look at the graph you can see that the FCP value for my website is around 600-700ms, which is quite good (as we'd expect it to be <1s).
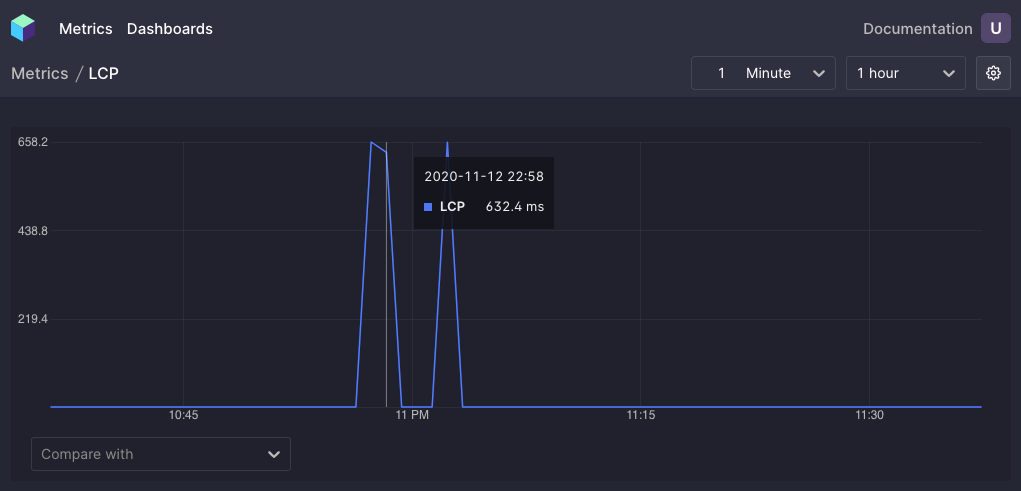 LCP metric
The above graph shows the website's LCP metric. It's around 600-700ms, which is far less than the recommended 2.5s. So that's good, too.
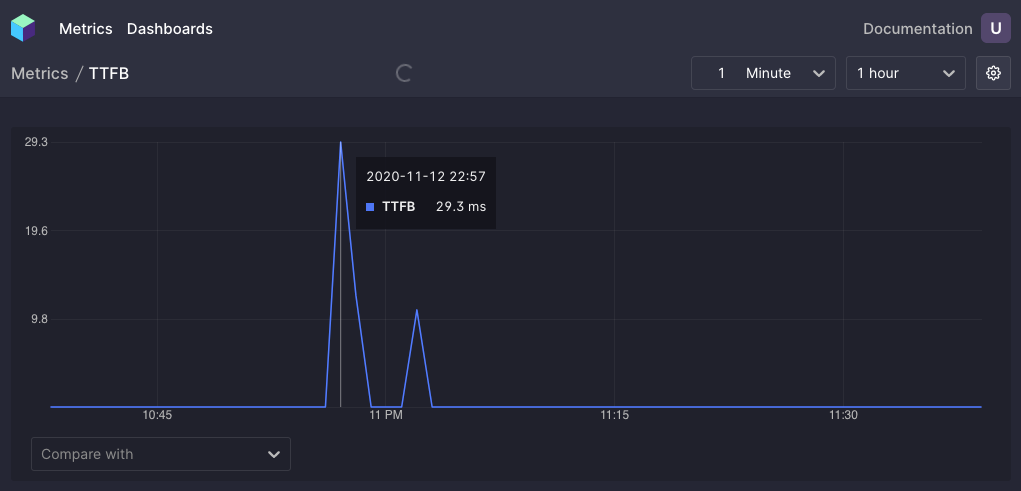 TTFB metric
This graph shows the website's TTFB metric. It's around 30ms, which is way better than the expected value of 200-300ms.
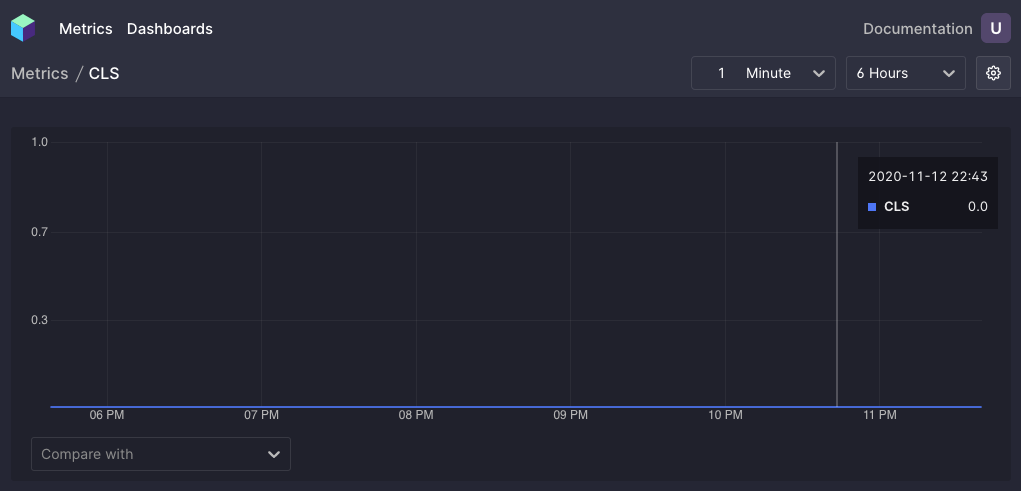 CLS metric
I am currently using the started Next.js site which has almost zero CLS. This value should always be below 0.1.
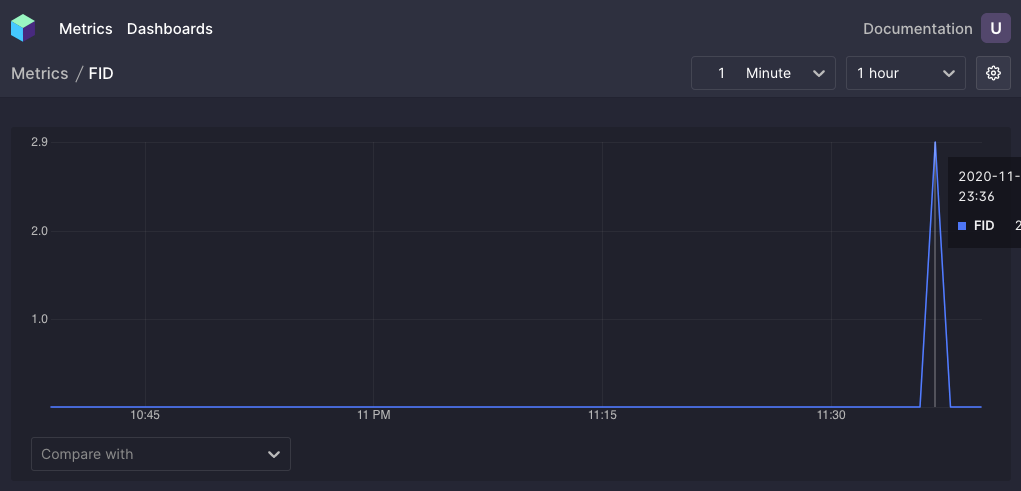 FID metric
In the above graph, the FID is 23.5ms. Again this value is under 100ms, which is far better than the recommended time of <100ms.
To view all of these metrics from a single page, you can create a dashboard and then add these metrics inside that dashboard.
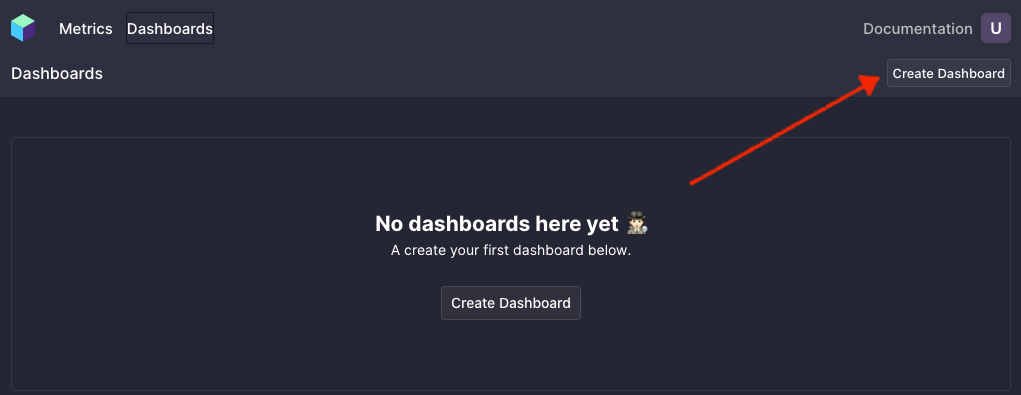 Quickmetrics Dashboard
You can click on create dashboard to create a custom dashboard. Inside the dashboard you can go ahead and click on "add charts" to create individual metric charts.
 Add charts to dashboard
Once you have clicked on add chart, you can then select the metrics you want to plot the chart for. You can also specify the value operation to plot to the charts (avg, sum, min, max).
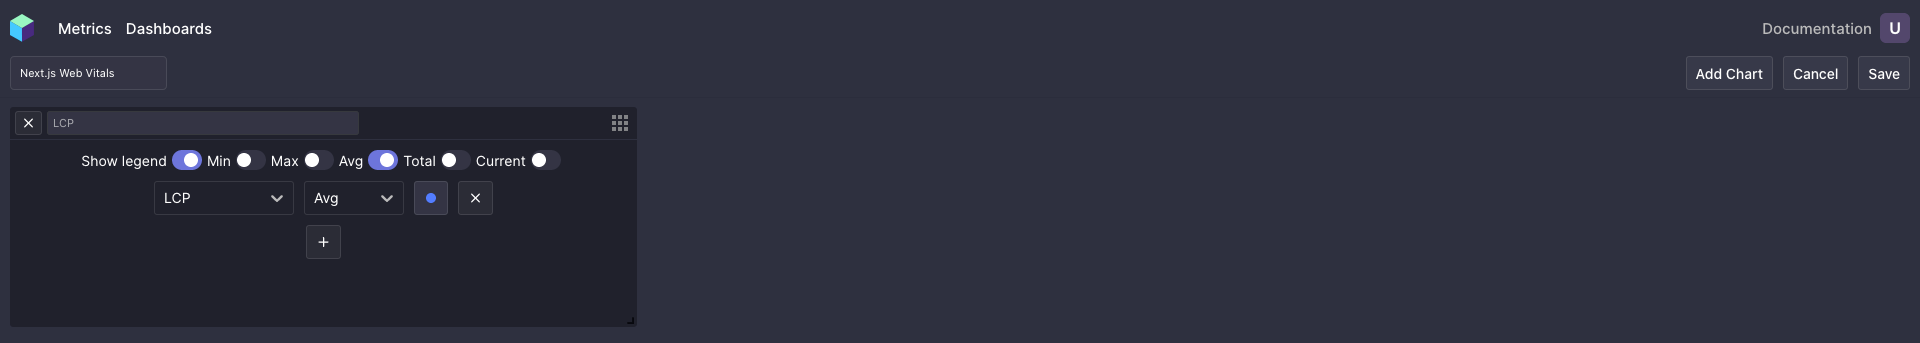 Create chart inside dashboard
Once you have created all the charts inside a dashboard, your dashboard should look like this:
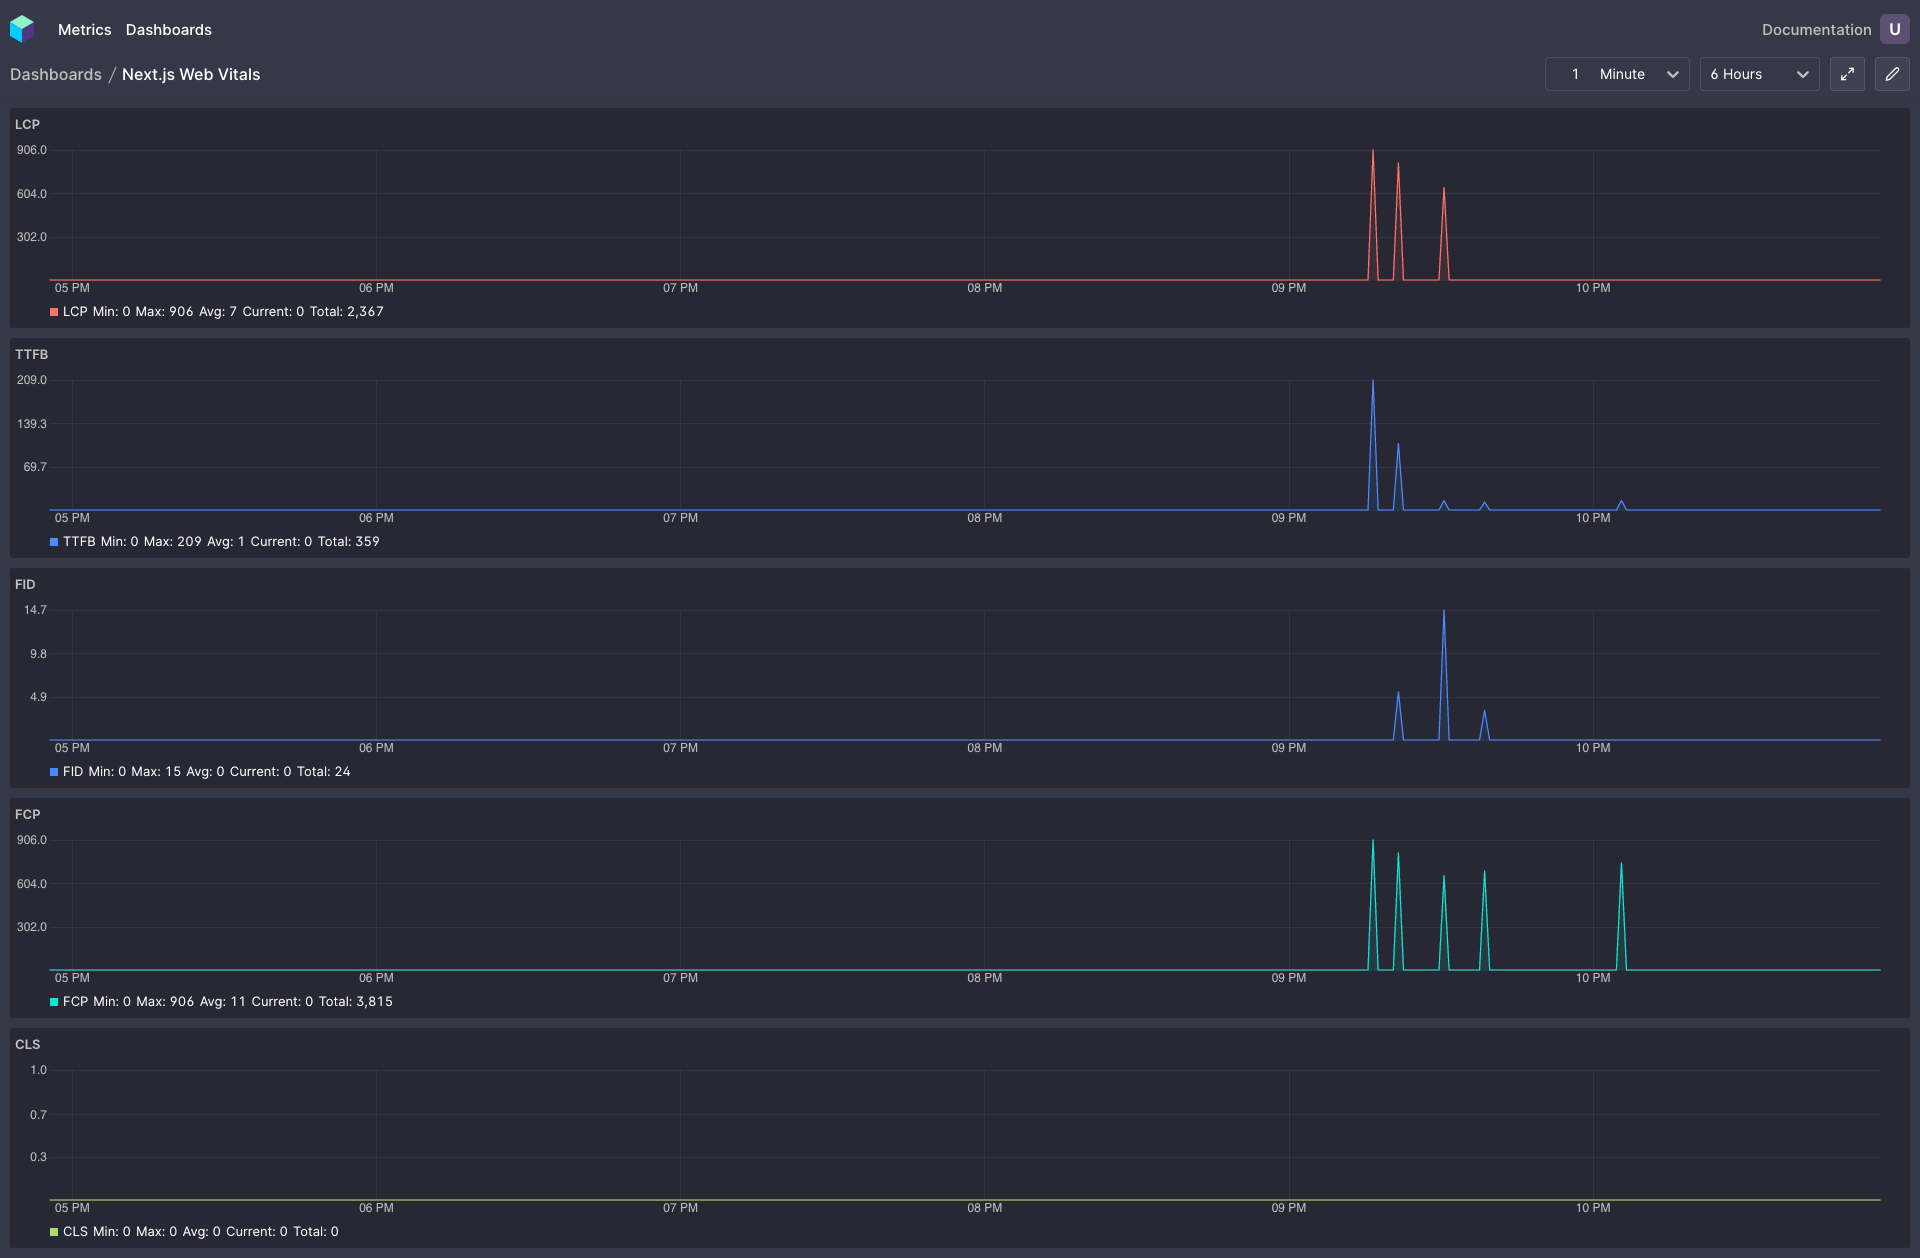 Next.js Web Vitals Dashboard
Conclusion
Web Vitals are the best available metrics that help you quantify your website experience. Collecting data from actual visitors helps you implement actionable changes to your code. Instead of measuring on your laptop, you can collect web vitals from the actual devices your visitors are using.
If you liked this article, you can head over to my personal blog to see more stuff I've written.
I regularly write about programming and software, so do subscribe to my newsletter and get the latest posts from me delivered straight into your inbox. You can also get in touch with me on Twitter.
References: