

Having problems with our computers is never fun.
And what's often worse than the problems themselves is that they seem to occur when we're in the middle of an important task that needs to get done.
The computer starts to significanlty slow down and an app we are using might freeze for a while. The computer's fan then starts to get louder and louder and that dreaded – but colorful – spinning wheel may even make an appearance.
Fortunately, there are certain steps you can take to fix different problems, get to the root of them, and see what caused them in the first place.
In this article you'll learn about the essential Task Manager tool on MacOS. You'll see how using it gives you insight to help diagnose and troubleshoot problems.
The First Step of Troubleshooting
The first action to take when an application or program you're using freezes and is no longer responsive is to use the following keyboard shortcut: Command Option Esc.
Hold down those three keys at the same time.

This will launch the Force Quit Applications Manager window:
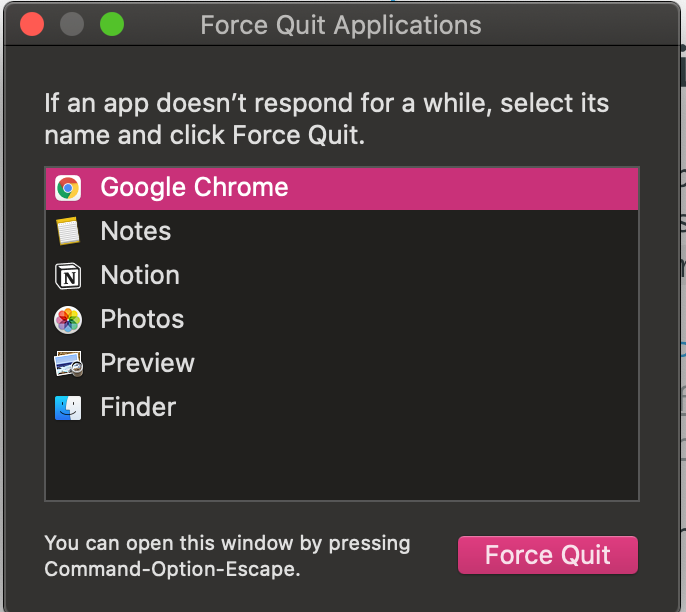
This window shows a list of all the applications that are currently open on your computer.
As the helpful instructions indicate, select the application that has frozen and is no longer responsive. Then next click the Force Quit button.
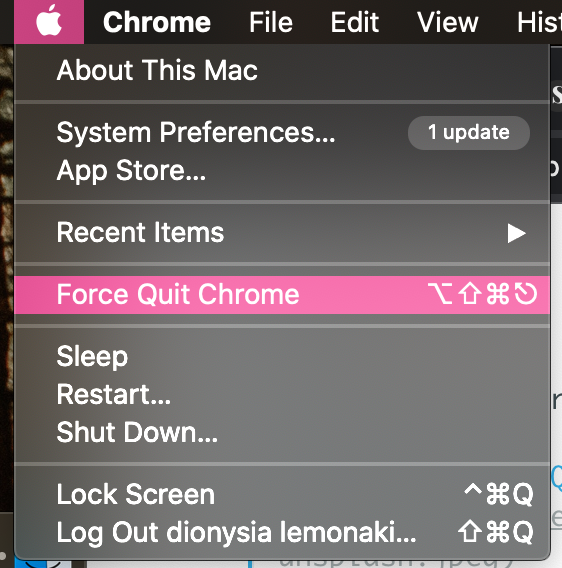
💡 Another way to access this window is by selecting the Apple icon at the top left corner of your screen by clicking on it. A dropdown menu will appear and from there select "Force Quit".
The application you selected will be closed and terminated immediately.
It's a handy and quick solution for closing a program that is not working and is unable to stop properly.
But this method doesn't give much information about what could be causing the problem. It's useful for just force-quitting an application.
MacOS Activity Monitor
If you were a Windows user in the past, you may be familiar with the Task Manager for troubleshooting problems.
The Activity Monitor is the equivalent system for measuring your computer's activity on a Mac Operating System - it is just under a different name.
It shares a lot of similarities with the Window's counterpart. It locates and shows all the processes currently running and how different applications affect the computer's performance.
So, to dig a bit deeper and gather more information on how the program that has frozen affects your computer, it's helpful to launch the Activity Monitor.
From there you can close or force quit programs, background processes which are not open and visible by default, or apps that have frozen up and are unresponsive and hanging.
How to Open the Activity Monitor
The easiest and most straightforward way to open the Activity Monitor is with the Spotlight button.
The Spotlight button is located in the menu bar at the top right corner of your Mac's screen and looks like a magnifying glass.
To access the Spotlight button you can just click on it:

💡 Another way to access Spotlight is by using the Command Spacebar keyboard shortcut.
Then, the Spotlight Search will appear. Start enetering the input for what you're looking for – in this case type the words Activity Monitor and it should come up.
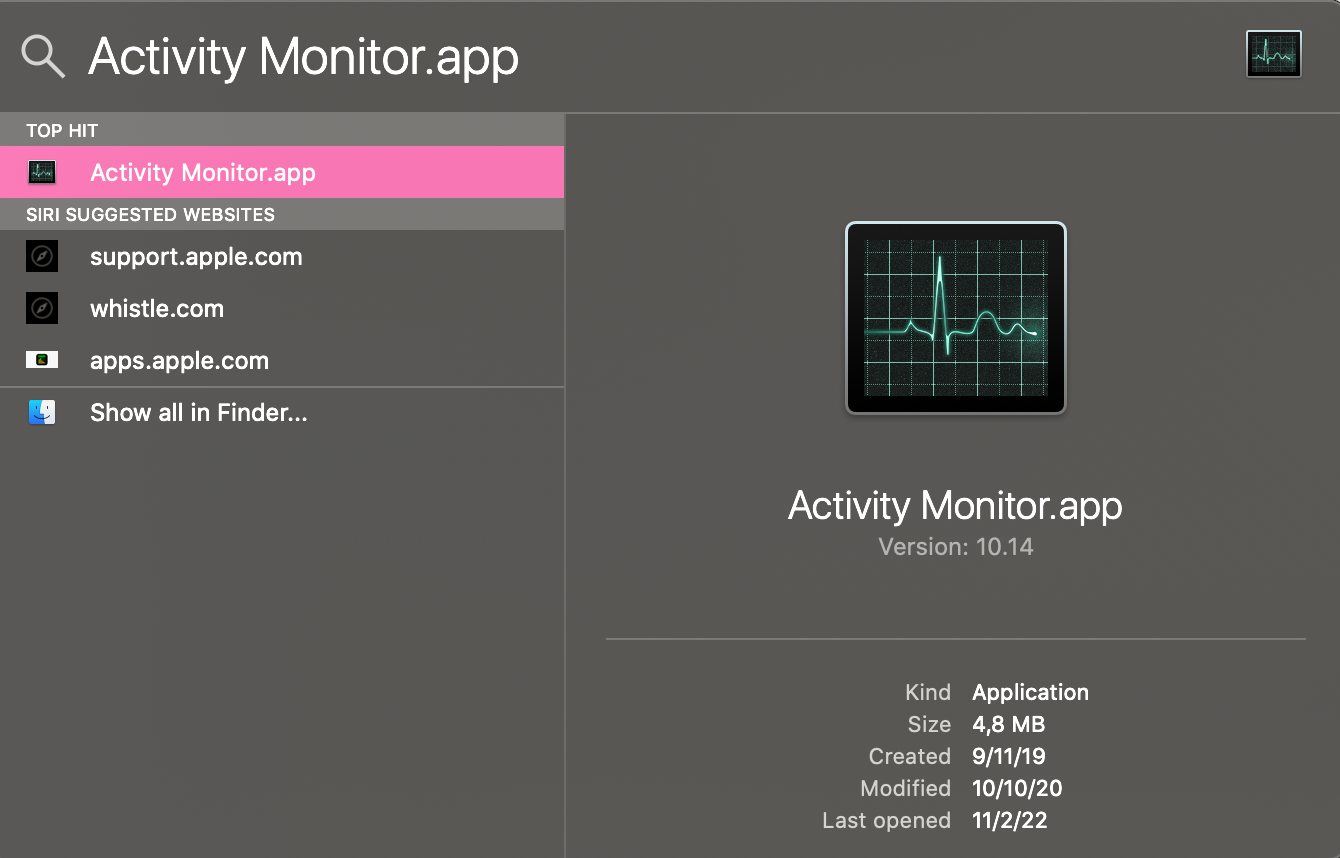
Hit Return and double click on the first option that appears.
Once you've completed those steps and opened the Activity Monitor, you can optionally keep it in the Dock for easy and fast access in the future.
Click and hold down on the application's icon. From there, once the dropdown menu appears, select Option and then Keep in Dock.
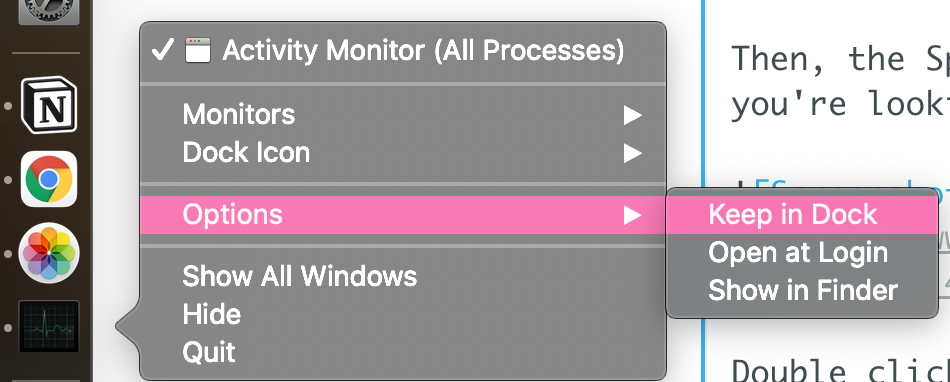
Now the application is pinned in your Dock.
How to Use the Activity Monitor
An Overview Of The Five Tabs in Activity Monitor
Once the Activity Monitor Window is open, you can take a deeper look into the current processes that are running on your computer.
There are five tabs available at the top of the window:

In the "CPU" tab which is the first one opened by default, you can see information on CPU usage.
For example, here you can see how the activities are affecting the processor's performance and how many processor resources are being used. It shows which applications are doing the heaviest work.
This is one of the two most useful tabs to check when problems occur. When the fan starts getting loud, the computer heats up and your battery starts going down fast. Check this tab to see which application is consuming most of the CPU's resources.
Quitting that app may then stop the problem.
In the "Memory" tab you can check memory usage and load. You see statistics and information on how much RAM (Random Access Memory) the different applications are consuming at the time.
This is the second most important tab to check when an application freezes. When an application freezes and your computer really slows down, it could be a sign that RAM is being overused and maxed out. It could also indicate that your computer is running out of sufficient RAM and that's why it is not functioning to the best of its abilities.
The "Energy" tab shows how much energy and power is being used by each application for each process that is running. This tab shows which applications are consuming the most energy and are draining battery life.
The "Disk Tab" shows the disk usage. It indicates how much data is being read from and written to your disk storage device. Here is also a good place to detect potential malware.
Lastly, the "Network" tab shows which applications on your Mac send and receive the most data from the network.
You can select either of these tabs to further investigate the issue you're having.
How to Search for Applications in Activity Monitor
There might be a long list of running processes.
To narrow them down and search for a specific application, use the search bar that is located at the top right hand corner of the window.

Type the name of the app you're looking for and if it is currently up and running it will appear as a result.
How to View More Information About Applications in Activity Monitor
First, select a particular application from the list of current running processeses that you're interested in learning more about by clicking on it.
Once you've selected it, that line will be highlighted.
Then, click on the i button (for Inspecting) at the top left hand corner.
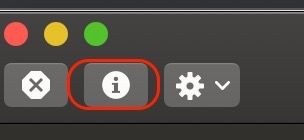
A pop-up window will appear, with additional information on the application.
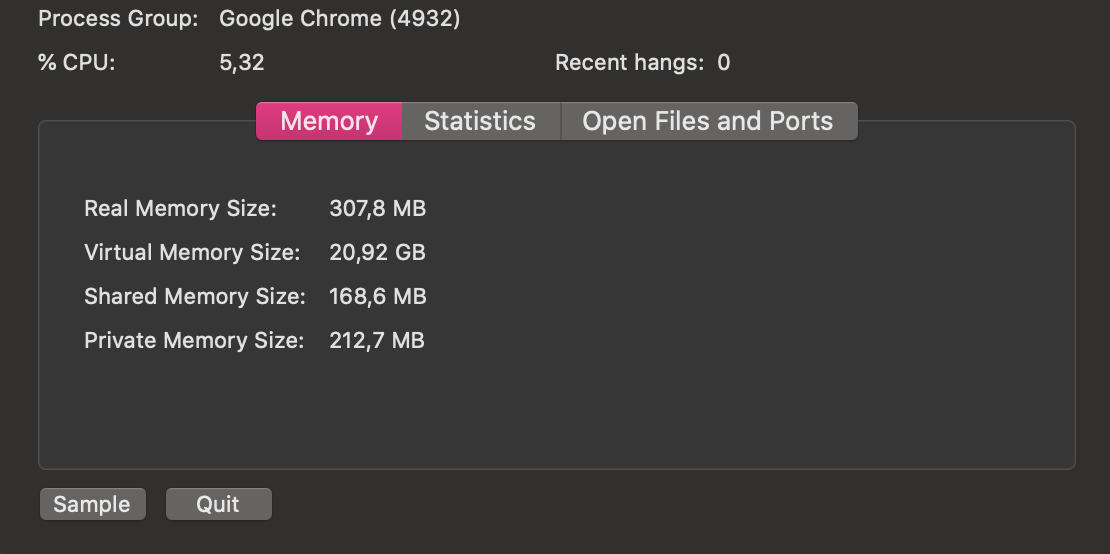
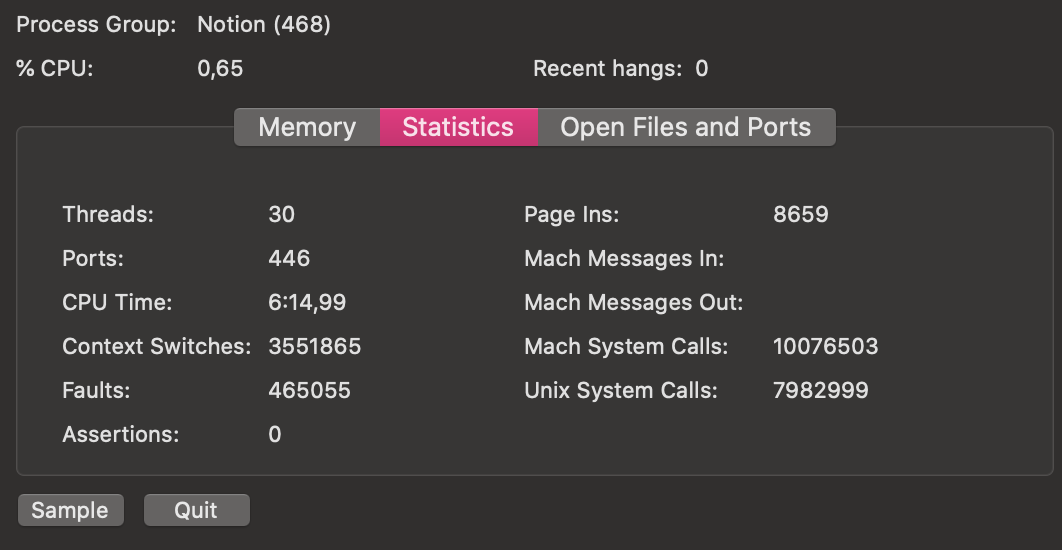
This window will have three different tabs: "Memory", "Statistics" and "Open Files and Ports".
In Memory you'll see how much RAM is running.
In the Statistis tab you can see the number of threads, the CPU time, and more technical insight.
The "Open Files and Ports" tab will show all the names of files that are currently running.
How to Force Quit an Application in Activity Monitor
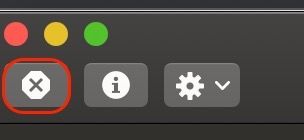
To quit or force quit any of the processes listed in the Activity Monitor, select the application you want to stop from running.
Then select the x button at the top left hand corner, which acts as the Stop button.
You'll see a pop up window appear asking you to confirm that you want to terminate the process. It will mention the name of the application you want to stop running in double quotation marks.
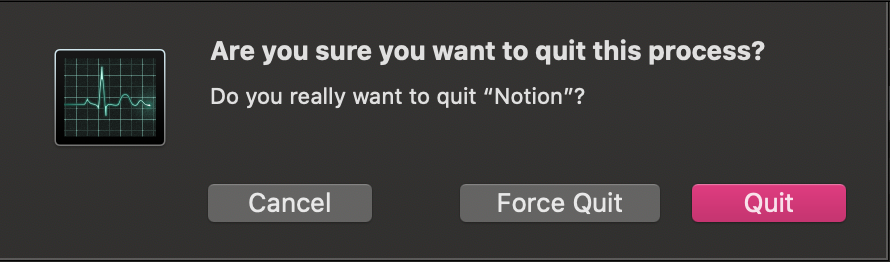
Select "Quit", and if that fails to close the app, choose "Force Quit" and the application will close immediately.
Keep in mind that you may end up losing data if the app froze and you didn't manage to save any progress or files you were using.
An Alternative to Activity Monitor
If you're a developer you may prefer working with the terminal.
Using just one command, you can see a list of the current running processes.
Navigate to spotlight again and this time type in "Terminal". The built-in terminal application for MacOS will launch.
You'll see the command prompt which is right after your computer's username.

By default, if you haven't applied any custom styles for the Zsh shell, the command prompt is a % sign.
A shell is a computer program that interacts with the underlying operating system through text-based commands it receives as input.
Zsh is one of the many different Unix shell types available. The Zsh shell is the default shell for MacOS Catalina and later.
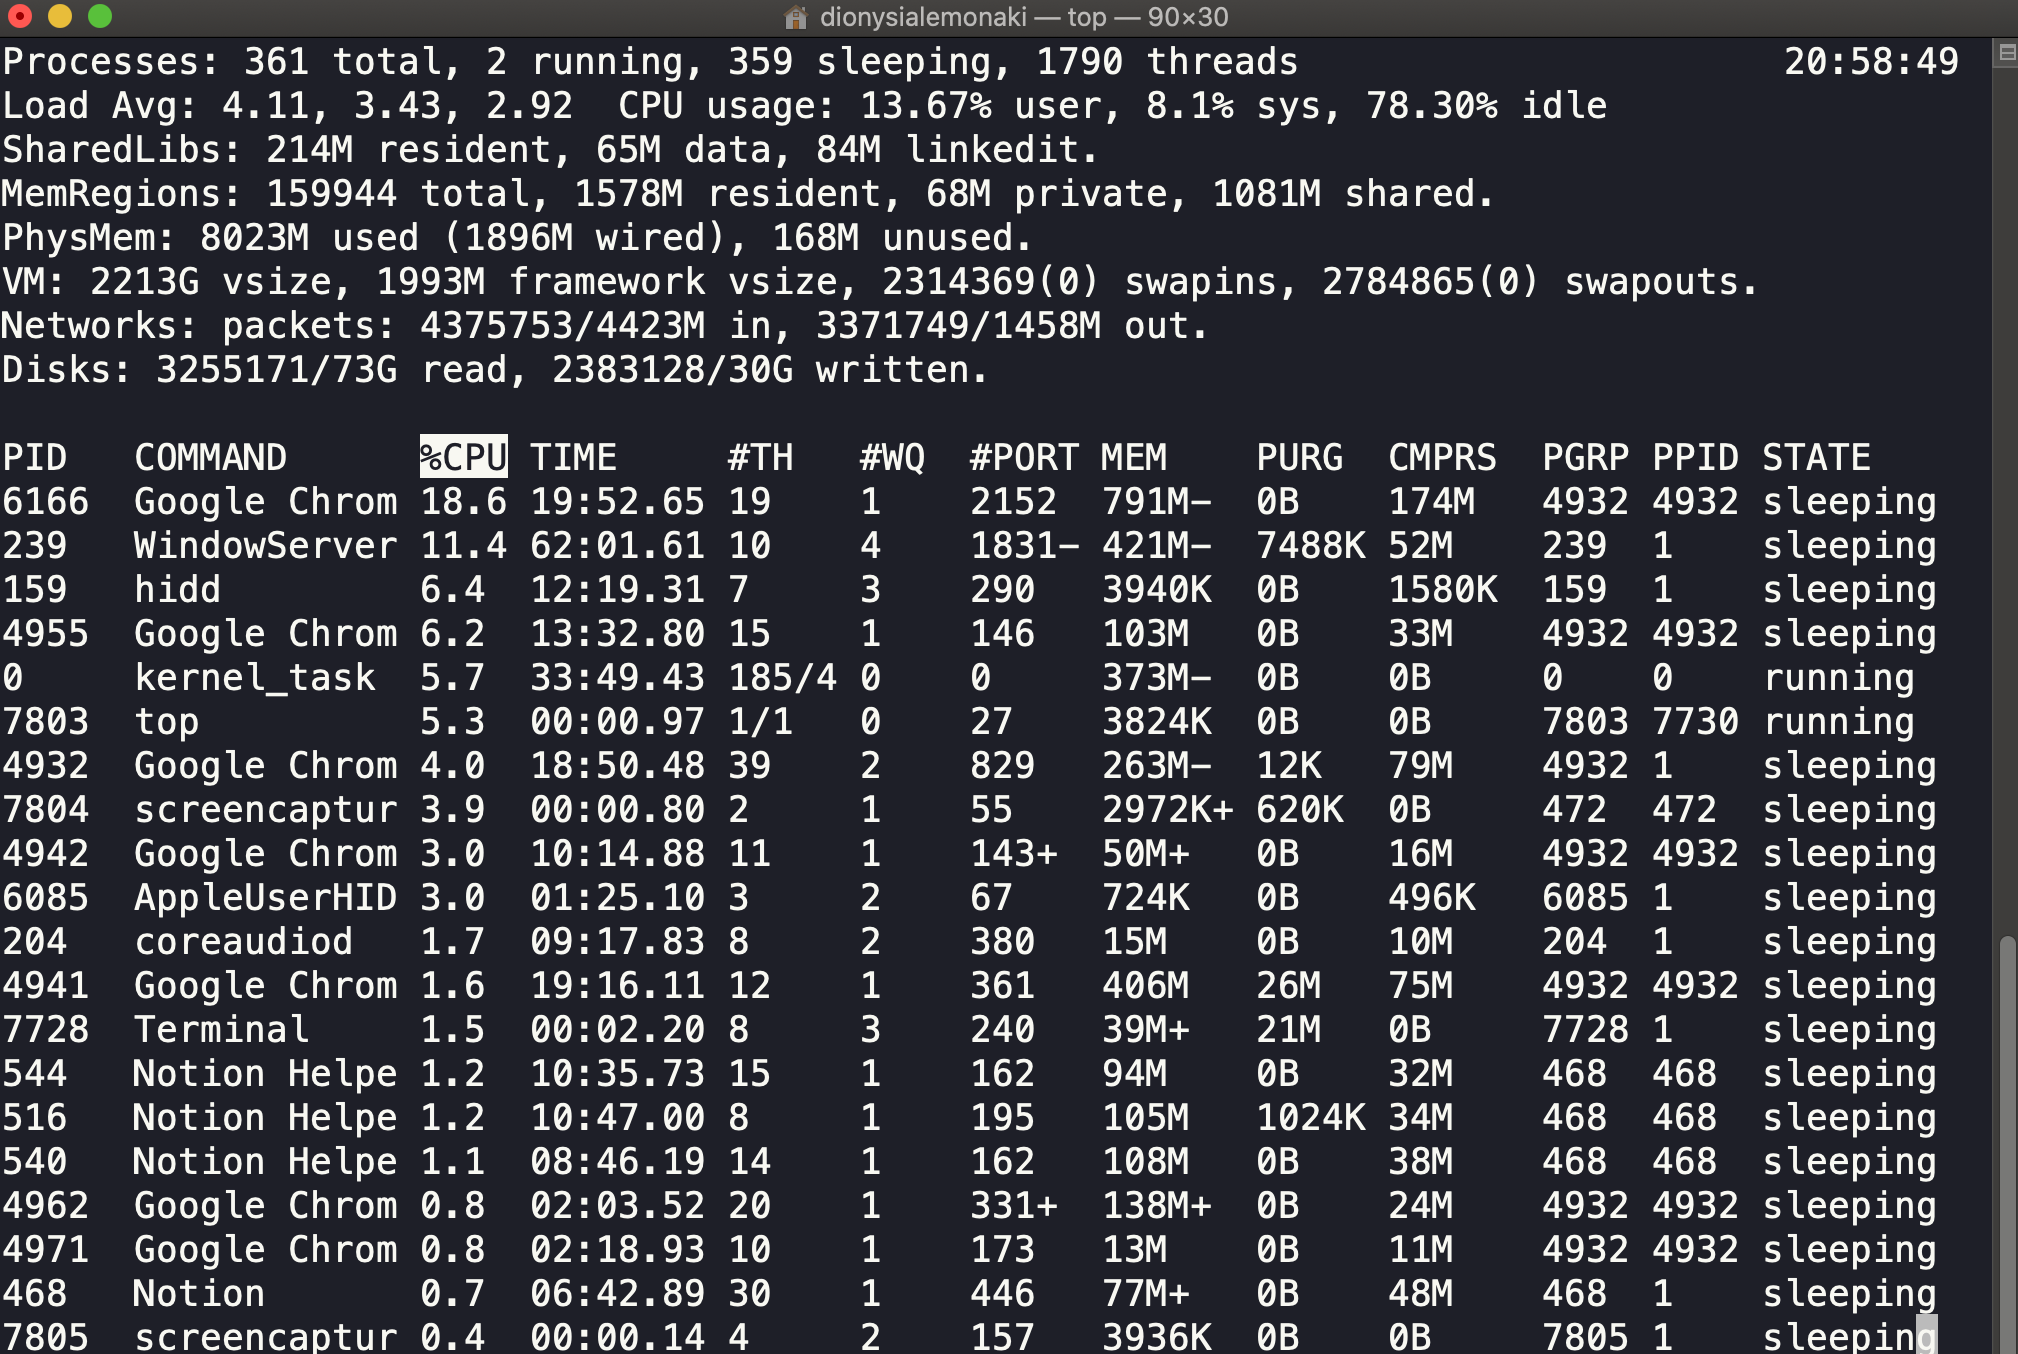
After the command prompt, enter the command top and hit return.
You'll see a list of all the current running processes:
To stop this, enter Control C which sends a signal to the command to terminate. You'll be back to the command prompt immediately.
When the top command is executing, you may see a process that is using too many resources. It may be a good idea to kill it, which is another word for terminating a process.
To do so, first locate the PID (Process ID). This number is located in the first column at the left hand corner when the top command is executed.
To continue, make sure you are at the command prompt.
Then, type the kill -9 PID, where PID the number of the process you want to terminate.
For example, if I wanted to force quit the terminal application I am currently using which has a PID of 7728, I would write the following: kill -9 7728.
The application will then close immediately.
Conclusion
Thanks for making it to the end. Hopefully you found this helpful and were able to troubleshoot any problems you were facing with your Mac computer.
You learned about the Activity Monitor which is the equivalent of the Task Manager available on Windows PCs. You also leared how to use the command line to terminate processes that use too many of the computer's resources.
Thanks for reading!