By Ben Edelstein
You may already be familiar with the basic features of the Chrome Developer Tools: the DOM inspector, styles panel, and JavaScript console. But there are a number of lesser-known features that can dramatically improve your debugging or app creation workflows.
Dark Theme
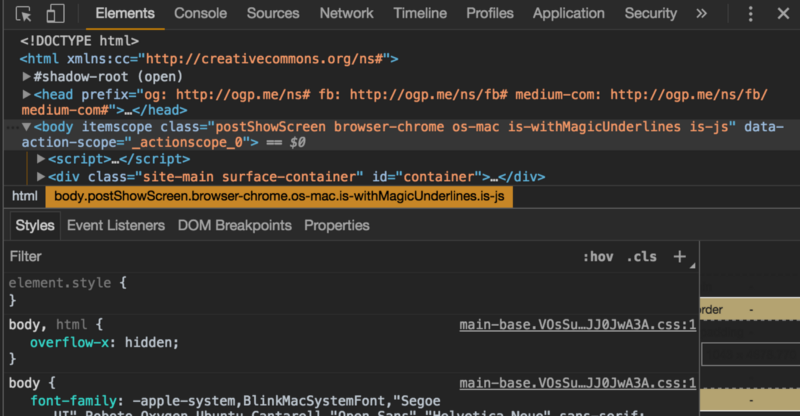
Chrome comes with a built-in dark theme for the dev tools. You can enable it by clicking the three dots icon in the upper right of the dev tools pane, clicking “settings”, and then toggling the theme.
I sometimes find this easier on my eyes, and, obviously, it looks much cooler :)
Selection Mode
Chrome Developer Tools (DevTools) offer a number of ways to select elements — the most convenient of which is the selection mode.
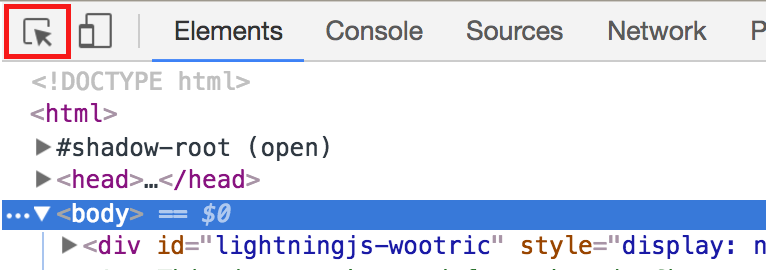
This tool, activated by pressing the mouse icon in the upper-left corner of the dev tools panel (or with cmd + shift + c), lets you select elements on the page simply by clicking on them.
Once activated, you can move your mouse around the page and preview selection, then click to select an element to inspect.
This tool is great for quickly selecting an element on the page since hitting cmd + shift + c will open the dev tools and go straight into selection mode.
Store as global variable
Inspecting complicated objects that are logged to the console can sometimes be tricky if they have many keys, or contain values that are hard to parse manually. Luckily, Chrome makes it easy to inspect such objects with JavaScript.
To do so, right click on an object in the console and press “store as global variable”. This stores the object as a global variable accessible in the console called temp1 which you can then work with using JavaScript.
Animation Tools
Recently, the Chrome team added a number of new features for debugging and for creating animations.
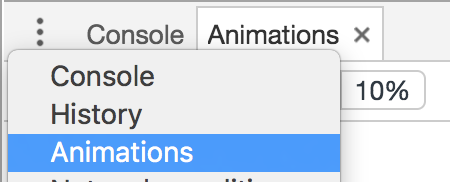
Clicking the dropdown in the upper-left corner of the console reveals an “Animations” pane that lets you limit the speed for all animations on a site.
You can also pause all animations. This is particularly useful for a site that is buzzing with animated content.
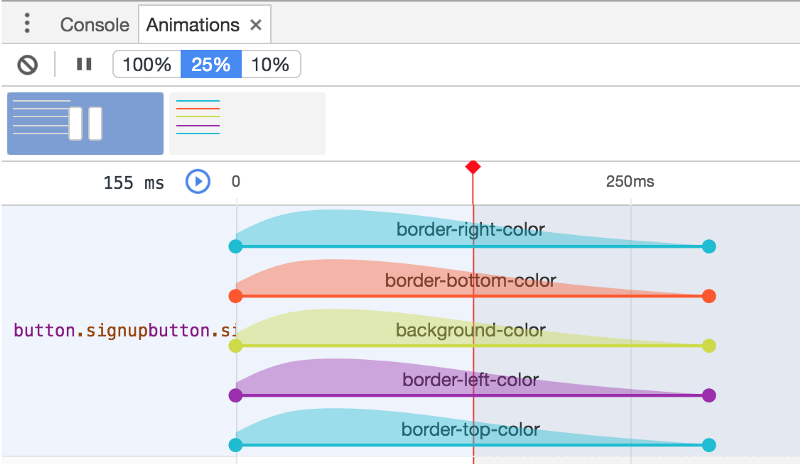
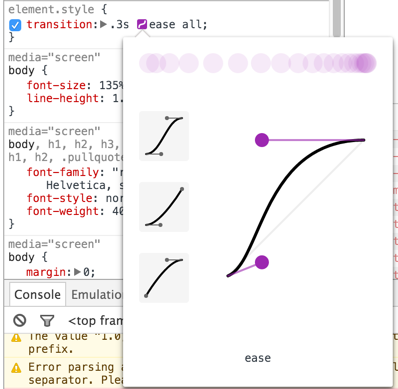
Clicking on the purple curve icon in an element’s transition property lets you view the motion curve for an animation, and fine-tune its properties. In addition, you can use the arrow icons to scroll through a list of preset animations to apply to your element.
Simulate Element Pseudo State
Another handy tool for styling elements is the element state simulator, which is accessed by clicking the :hov icon in the upper-right corner of the Styles panel.
This tool lets you simulate the element pseudo states of hover, active, focused, and visited and view styles that are associated with those selectors.
To add styles for those pseudo states, add a new selector (with the + icon) and add :<state> to the end of the selector string.
For example, to add a hover rule to an li with class logo, make a new selector, li.logo:hover, and add styles there.
You can then test your styles by checking the :hover element state to simulate hovering on the element.
Prettify CSS and JavaScript
Debugging or viewing minified JavaScript and CSS is very difficult. But luckily DevTools provides a tool that makes doing this a bit easier.
After opening a minified file in the “Sources” tab, you can click the brackets logo in the lower left corner of the file, and DevTools will “prettify” the code.
This works quite well with CSS files, and does a decent job with JavaScript, though some information (like variable names) is lost in the minification process.
Alt + Up / Alt + Down
When debugging CSS, you can select a property and use the up/down keys to tweak it’s value. By default, the arrow keys adjust values by +/- 1. However, by holding the alt key, you can use the arrow keys to adjust values finely in steps of 0.1, which is particularly useful when working with fractional values.
Conversely, you can hold shift to adjust values in steps of 10.
Preserve Log
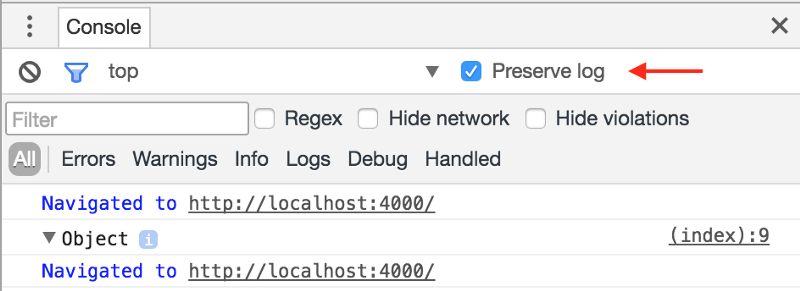
Preserve log is a checkbox that lets you persist logs between page refreshes. This is useful when debugging website issues that require you to refresh the page, since all console output is otherwise cleared.
When this option is enabled, a new type of “Navigation” log appears in the console to show page refreshes or navigation events to different pages.
Network + Log Filters
When debugging an app that has a lot of network requests or console logs, it can be useful to filter for particular types of events.
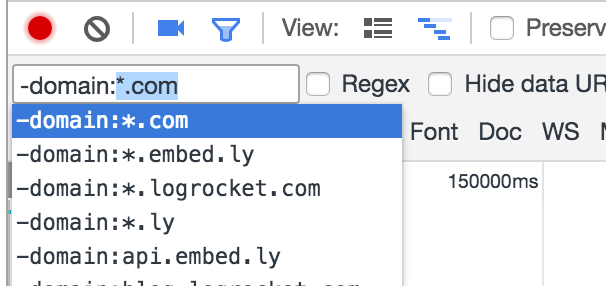
Chrome has a filtering language that supports many different properties, as well as operators like * to do wildcard matches.
If you type “-”, Chrome will expose a typeahead that shows the various properties you can filter for. You can also toggle on “regex” mode to do a regex match on the data shown in each row.
Code Coverage
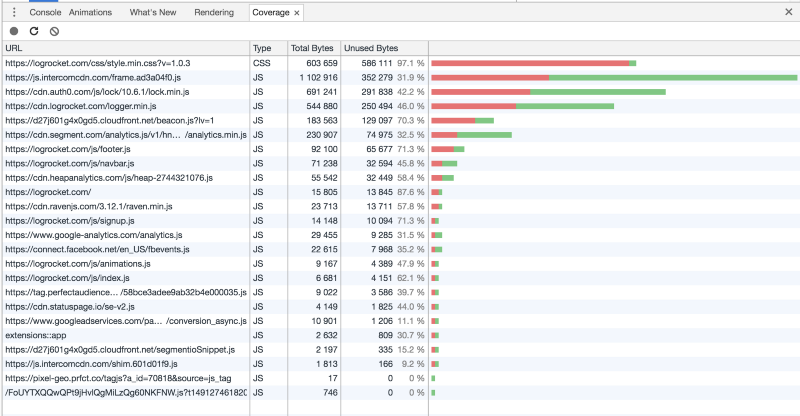
Code coverage lets you run your web app, then for each JavaScript and CSS file, see which lines of code ran and which didn’t. This is helpful since when working on a complex or long-term project, it is easy to accumulate dead code.
To use it, make sure you have Chrome 59 or higher, and go to the “Coverage” tab. Press “record” and then start using your app. When you’re done, Chrome will show you the exact code that ran during your session.
Debugging Issues in Production
DevTools only works if you’re running your app on your own machine. If you’re interested in understanding bugs and performance issues that users see in production, try LogRocket.
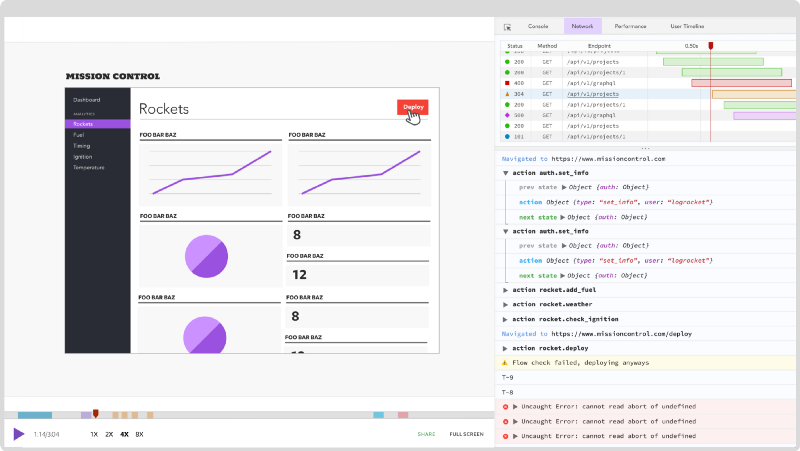
LogRocket is a front-end logging tool that lets you replay problems as if they happened in your own browser. Instead of guessing why errors happen, or asking users for screenshots and log dumps, LogRocket lets you replay the session to quickly understand what went wrong. It works perfectly with any app, regardless of framework, and has plugins to log additional context from React, Angular, and Vue.js.
LogRocket instruments your app to record console logs, network requests/responses with headers + bodies, browser metadata, Redux actions/state, and performance timings. It also records the HTML and CSS on the page, recreating pixel-perfect videos of even the most complex single-page apps.
You can check out LogRocket here.
LogRocket | Logging and Session Replay for JavaScript Apps
_LogRocket helps you understand problems affecting your users, so that you can get back to building great software._logrocket.com
Thanks for reading. I hope these advanced DevTools techniques help you build better apps with less stress.
