
By David Venturi
Free Code Camp asked 15,000 people who they are, and how they’re learning to code. I separated them by gender, continent, and whether they’re ethnic minorities, then explored their differences.
 _Image by [me](http://davidventuri.com/" rel="noopener" target="blank" title=").
More than 15,000 people responded to Free Code Camp’s 2016 New Coder Survey, granting researchers (like me!) an unprecedented glimpse into how people are learning to code. The entire dataset was released on Kaggle.
Here is how new coders of different genders, ethnicities, and continents vary by wage, age, and hours dedicated to learning.
The demographic distributions for the 15,620 new coders who responded to the survey are as follows:
Gender
- 21% (2,840) are women
- 78% (10,766) are men
Ethnic Minority vs. Majority
- 24% (3,253) are ethnic minorities in their country
- 76% (10,392) are not
Citizenship by Continent
Does expected next salary vary by demographic?
This next salary is their first one after advertising their new coding skills. Expected next salary is one of two main questions in the Free Code Camp survey whose answers depend on the quality of coding resources.
Post-coding skills acquisition, North Americans expect the highest salaries and Europeans expect the lowest. Expectations in Asia are all over the board.
The 25th percentile North American expects the same as the 75th percentile European: $50k. The median North American expects $60k per year.
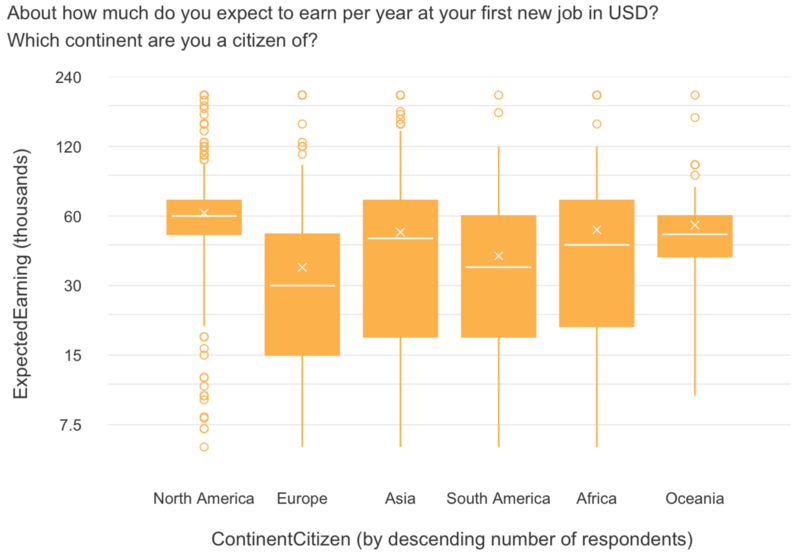
I wonder if some Europeans forgot to convert from pounds, euros, or any of the other European currencies to US dollars.
By the way, here’s how to read this chart (and the other box plots in this article): the “x” is the mean. The horizontal line is the median (a.k.a. the 50th percentile). The bottom of the box is the 25th percentile, and the top of the box is the 75th percentile. Whisker length is 1.5 times the height of the box. The circles are outliers. All y-axes are on a logarithmic scale to better visualize the outlier-heavy data.
Females actually expect higher next salaries than males.
The median female expects $9k more than the median male. The 25th percentile female expects $14k (!) more than her male equivalent. Female new coders appear optimistic about the changing diversity landscape in the workplace.
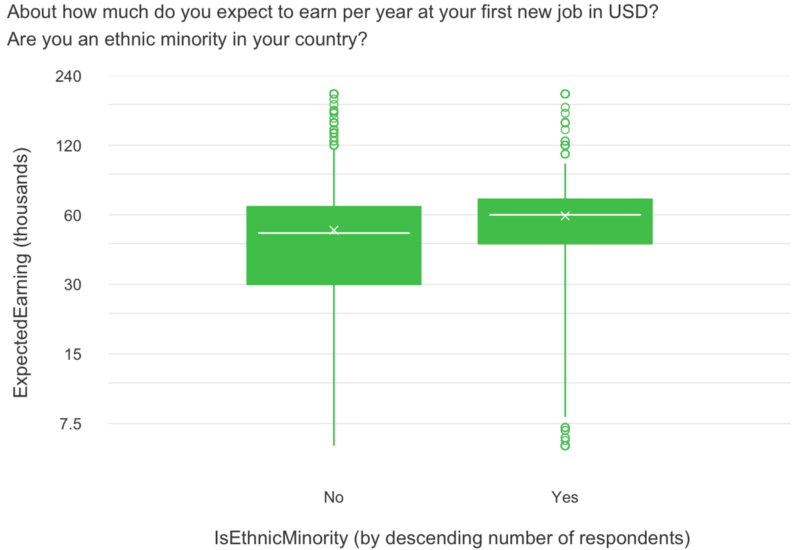
Like gender, minorities expect higher next salaries than the majority demographic.
The gap in medians is $10k. The gap in first quartiles is $15k. Minorities also appear optimistic about the changing diversity landscape in the workplace.
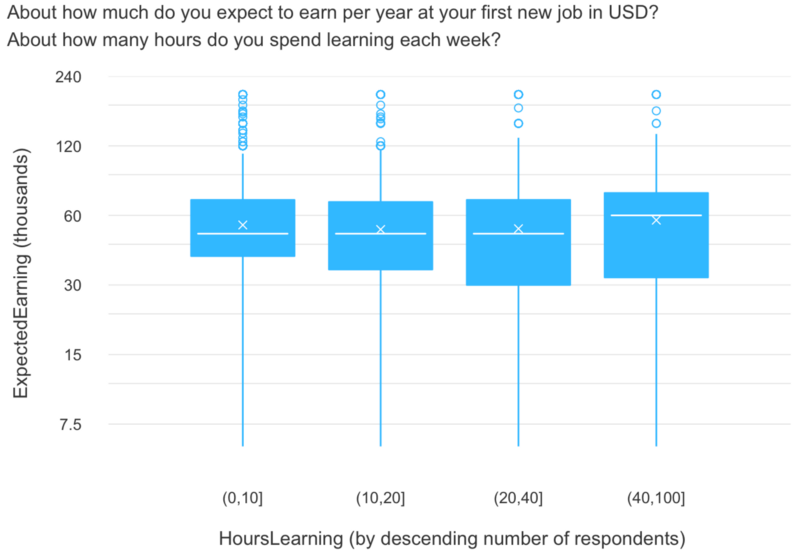
Expected salary is about the same, whether you dedicate less than 10 or up to 40 hours per week.
Those who dedicate 40+ hours per week have a mean expected salary that is $3k to 5k higher than the others, but this could be caused by random chance. Only 694 of the 15,000+ respondents spend this much time learning.
So expected next salary varies wildly by continent. There appears to be a reverse wage gap trend going on with gender and ethnic minority status.
Less than 5% of new coders are dedicating 40+ hours to learning each week.
Most of these respondents are in their early twenties and have a bachelor’s degree, which suggests that some are forgoing traditional forms of higher education (like master’s and professional degrees) and using those 40+ hour weeks to learn code.
By the way, this is the situation I myself am in with my personalized data science master’s degree.
As the awareness of the quality and affordability of online education rises, I expect more people to join the higher brackets.
Do hours dedicated to learning per week vary by demographic?
The hours dedicated to learning question is another one whose answer depends on the quality of coding resources.
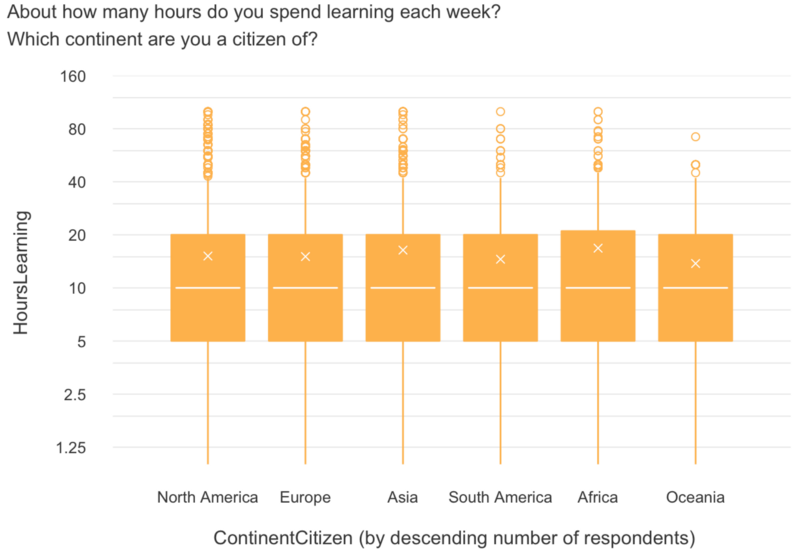
Time spent learning to code is pretty much identical across continents. A median of 10 hours per week is standard.
Same thing across genders.
(Note that for trans people, the difference was not statistically significant.)
And same thing for ethnic majorities vs. minorities.
So unlike expected next salary, hours dedicated to learning doesn’t vary much by demographic. The bulk of each spends between 5 to 20 hours learning weekly.
Let’s dig deeper into the wage gaps.
For both males vs. females and ethnic majorities vs. minorities, two grouped scatter plots follow:
- Current salary (before advertising their new coding skills) vs. age
- Expected next salary (after advertising their new coding skills) vs. age
Each has a best-fit line labeled with its correlation, as well as dashed lines representing the median for each axis variable. I removed new coders that are 65+ years old since they are statistical outliers.
Wages Across Ages
Female new coders have higher median current salaries than males (by $2k), but the higher female salaries are concentrated in millennials.
Note the current salary vs. age correlations of 0.267 and 0.192.
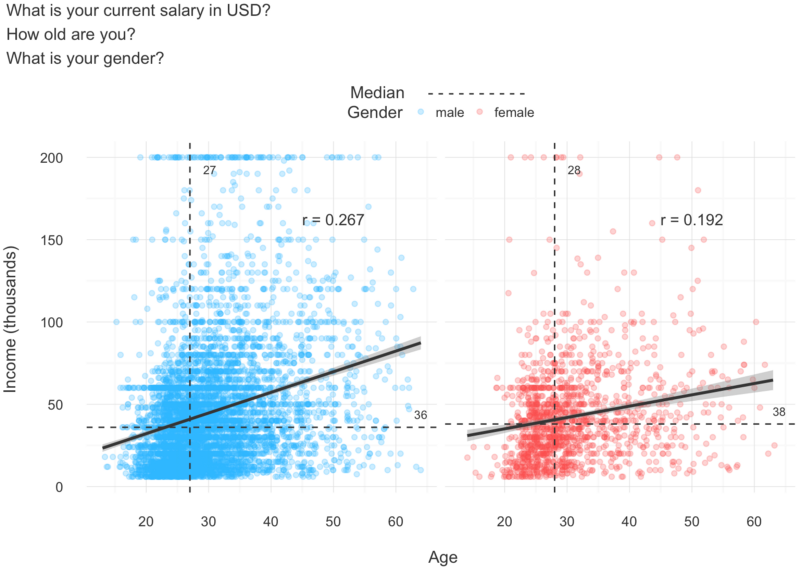
Male new coders do have an above average proportion of very high ($150k+) current salaries, which corresponds to a slightly higher mean (not plotted).
For gender, the above relationship between age and wage isn’t maintained when new coders project their next salary.
The correlations are much lower, with both near 0.1. Again, we see the huge gap in medians: $59k for females and $50k for males. These are both higher than each gender’s current salary median.
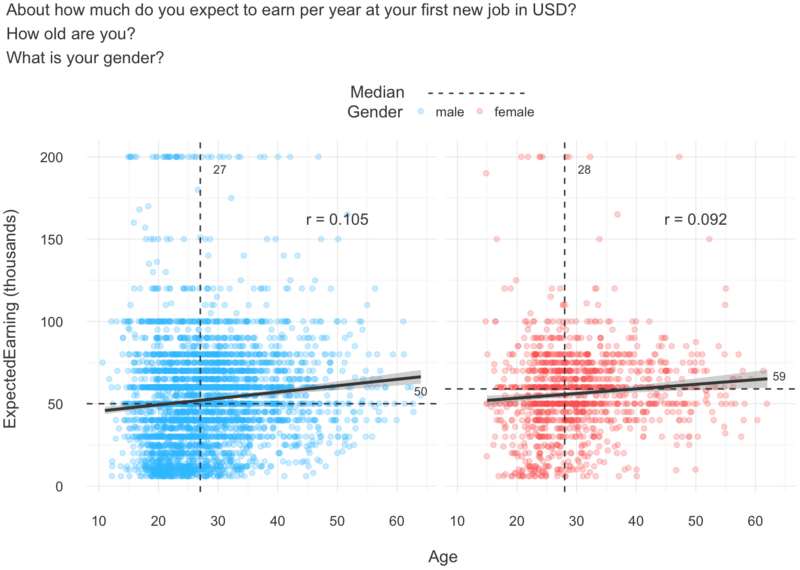
_Photo via [KuniakiIGARASHI](https://www.flickr.com/photos/igaiga/8524166440/in/photolist-dZfzGU-dBG6fK-mavikK-dZ9LET-dBG7yK-dZ9PFK-dBMupE-dZfzLo-dZ9RUR-mavkDx-dAQVYu-dBG8M4-dBG5Qt-dZ9SCi-dfRvyL-maw2Za-dBG5Wc-dBG8Ec-dBMx5J-dBMxcY-dBMwXy-fwy6Vc-rtdj7S-re4gSB-rtdmmG-rvpEFE-rtdfs7-rvuWeM-rvp4kt-qyvqtw-dZ9Tcn-dBG6uX-mawZrJ-dC4z8C-kRyZsZ-dZ9Npa-dBY8CZ-dfRPuf-dZfvtq-dBG5zK-dfRMHK-dBG79V-dBMvY7-mavZxM-dZfwpE-dZfviC-dZfx9d-maw2ap-dZfwnf-dZ9PSR#undefined" rel="noopener" target="blank" title=")
Minorities have a higher median current salary than majorities by $4k. Unlike gender, the spread of current wages over age is about even.
Note the current salary vs. age correlations of 0.253 and 0.243.
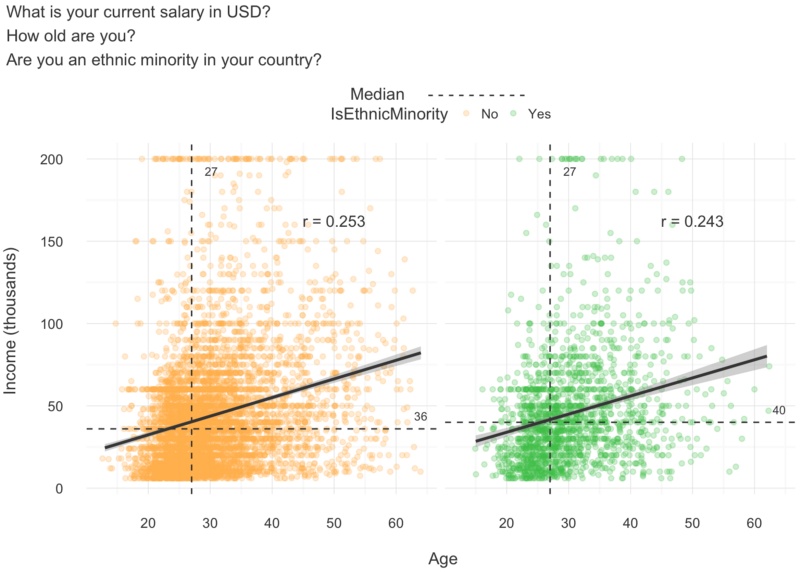
Ethnic majorities do have an above average proportion of $150k+ current salaries, but it doesn’t correspond to a higher mean (not plotted) this time.
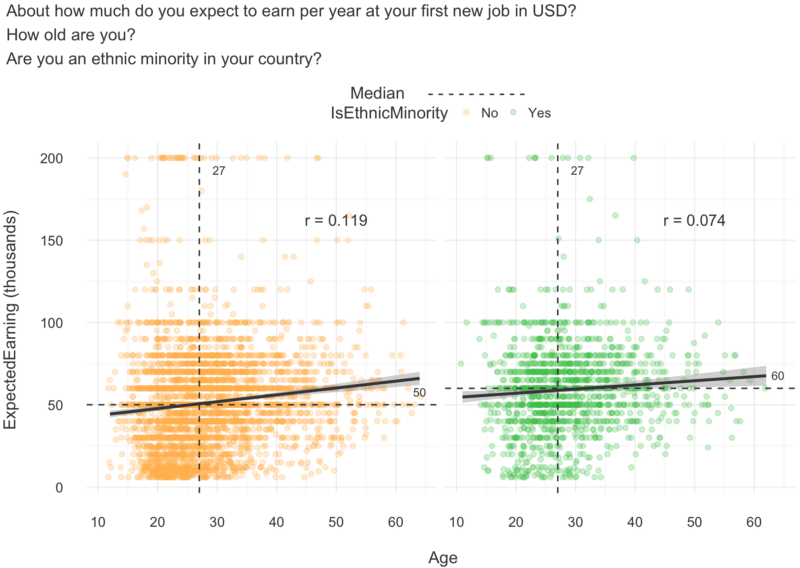
For ethnic minority status, like gender, the relationship between age and wage isn’t maintained when new coders project their next salary.
Both of the correlations are much lower, near 0.1, again. The $10k gap in median expected next salary is striking: $60k for ethnic minorities and $50k for ethnic majorities. As with gender, these are both higher than their current salary median.
_Photos via [Black Girls Code](https://www.flickr.com/photos/perkinsy/9537573288/in/photolist-fwNyfL-dBMuTu-mavjWa-dZfxz5-mawXAj-max12m-dBMuVd-dfRvWf-kRyigi-dBG5UV-dZfwJW-dBMwDd-dBY7QM-dBG874-dZ9Ric-dZfu75-maviov-dBMwjw-dZfv8Y-dBMwfm-dC4xFW-dfRN4K-dZ9MoD-dZfzm1-dBMwSU-dC4z2u-dZfynG-dBMxBw-dBMun7-dZftHJ-dBMv89-dBMwHQ-dAKsMH-dZfvB9-dZ9RBD-dZfvES-dBMvzj-dZfz1J-mawYim-dZ9QqX-maw34D-dZfvwA-kRyhGc-dZfy53-dfRMcx-dBG7ua-dBG7Va-dZ9TgD-dBY93c-mawZv1#undefined" rel="noopener" target="_blank" title="">Yvonne Perkins and <a href="http://precollegeblog.flatironschool.com/post/121194821475/black-girls-code-and-flatiron-school-partner-for" rel="noopener" target="blank" title=")
So, like expected next salaries, female new coders have higher median current salaries than male new coders. So do ethnic minorities vs. ethnic majorities.
Older females don’t do as well as older males, however, which is the only hint of a wage gap that I could find in the entire dataset.
For both gender and ethnic minority status, it appears that older new coders are willing to take a pay cut when transitioning to a job where they advertise their new coding skills, while younger individuals intend to capitalize on coding demand with a hefty salary early in their career.
What did we learn?
Hours dedicated to learning to code is pretty much constant across gender, ethnic minority status, and continent. Most people spend between 5–20 hours each week.
Expected next salary (post-c0ding skills acquisition) varies wildly by continent. The lowest median is $30k (Europe) and the highest is $60k (North America).
Older new coders appear willing to take a pay cut in their new job where they advertise their new coding skills, while younger new coders look to start their careers with substantial salaries with their in-demand skill.
The traditional gender and ethnic minority wage gaps aren’t prevalent in the 2016 New Coder Survey. In fact, they are reversed. Perhaps new coders aren’t reflective of the working population in general, where data suggests that both wage gaps still exist in 2016.
_Photo via [SHRCC](https://www.flickr.com/photos/shrcc/4535210853/in/photolist-7UL9bz-jXi8bu-drKeWS-EH6mXe-cCoTSN-8xcfPC-6aoYyA-nRkbdo-dVH1tJ-8p5VgK-cEZjtj-soV5rS-spfY1q-efBP6h-axL5Wm-aKypuc-7KmDRt-8mnyNH-4uCYto-RapM6-fNunxg-9cNj9r-cqeakC-oXqXpL-2uPztV-5hWNCu-9TV2wn-9TSDDG-iUMeZi-ouFdL9-brensu-4ETTCT-5QnPiV-5hPTqV-bCVbLW-ecDZDm-dVvEo9-8WqgrX-fiA5cJ-6H6ebv-axL639-a5v941-8zGdQ7-9cauL6-nM7B44-9cTmCG-3KBVk4-nNCjMj-f6UVnA-5FSSKq#undefined" rel="noopener" target="blank" title=")
What’s next?
Do you have a hunch as to why the ethnic minority status and gender wage gaps might not apply to new coders? Please share anything relevant (or contradictory!) in the responses.
You can find a more detailed version of this analysis on Kaggle, where you’ll find statistical tests supporting the inferences in this article.
Be sure to check out my other pieces exploring Free Code Camp’s 2016 New Coder Survey:
Developing Data Scientists and Engineers
_Free Code Camp asked 15,000 people who they are, and how they’re learning to code. I isolated those focused on data…_medium.comThe 6 most desirable coding jobs (and the types of people drawn to each)
_Free Code Camp asked 15,000 people who they are, and how they’re learning to code. I separated them by their job…_medium.freecodecamp.com
If you have questions or concerns about this series or the R code that generated it, don’t hesitate to let me know.
David Venturi (@venturidb) | Twitter
_The latest Tweets from David Venturi (@venturidb). Creating my own data science master's degree. @queensu chem eng/econ…_twitter.com