By Konrad Dzwinel
12 years ago web development had almost no tooling. There was no easy way to inspect the DOM, monitor the network or even console.log things.
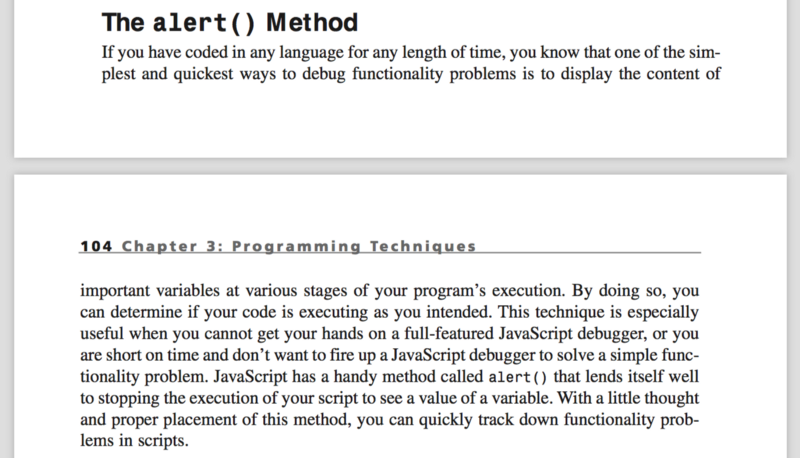 Web development in 2002 — debugging with alerts. From “Pure JavaScript” (ISBN 0672321416)
These dark times can be summed up by this quote from Joe Hewitt, creator of Firebug and the Console API:
“I’m always surprised to hear people call FireBug ‘innovative.’ It shows just how weak the web developer’s toolbox has become that something as old school as a console would be considered novel.”
The creation of Firebug in 2006 marked the beginning of modern web development tooling. Today, each major browser ships with fantastic built-in tools for web developers. Behind each DevTools there is a dedicated team of developers, designers and product managers pushing it forward.
As DevTools became important, they started competing with one another and gaining tons of new capabilities while trying to keep up with the evolving platform.
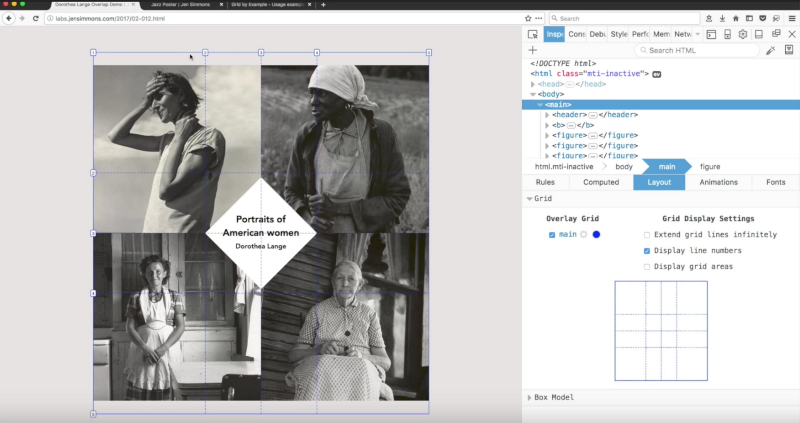 _Firefox DevTools were first to feature a grid inspector — [https://youtu.be/dU7xtnzfqxQ](https://youtu.be/dU7xtnzfqxQ" rel="noopener" target="blank" title=")
Firebug’s legacy
I believe that nowadays, we are blessed to have one of the best tools in the industry. In fact, our tooling got so good that it is constantly forked and adapted to work with other platforms.
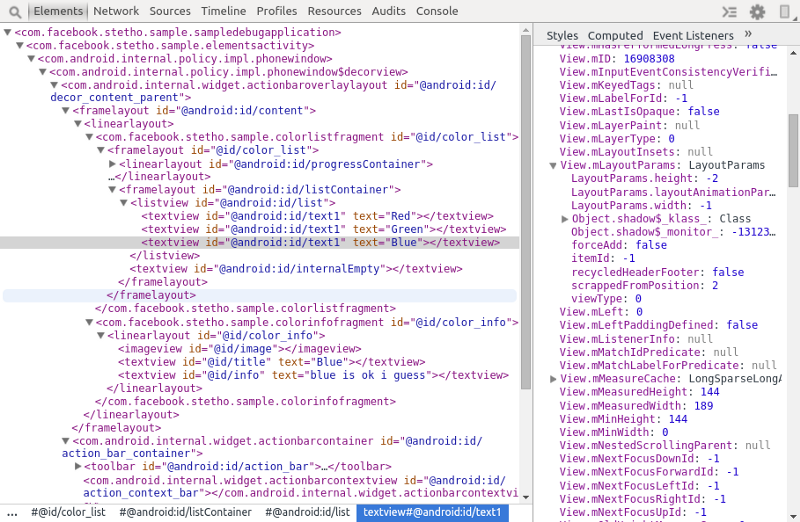 _Stetho — Chrome DevTools fork for debugging Android applications — [https://facebook.github.io/stetho/](https://facebook.github.io/stetho/" rel="noopener" target="blank" title=")
One thing that always struck me though is how the original concepts introduced by Joe in Firebug still live on, almost unchanged, in today’s DevTools.
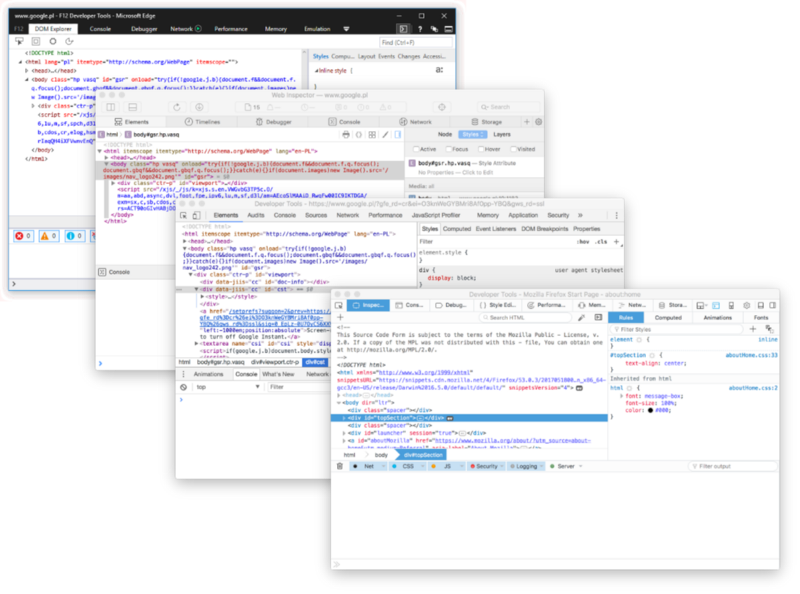 Elements panel in Edge, Safari, Chrome, and Firefox DevTools.
These similarities sure make our lives much easier when switching between the browsers, but I always wondered — were these concepts ever challenged? Or were they just copied over without much thought? And if they were, can I somehow challenge them myself?
Getting inspired
Motivated by the invitation to speak at Front-Trends, I decided to build a couple of prototypes showing some alternative paths that our tooling could follow in the future. In a search for inspiration, I thought about getting to know applications used in other professions. I hoped to identify some patterns and ideas worth borrowing.
Going through the manuals of random tools, without understanding the context, didn’t sound like a good plan though. Thankfully, I have a couple of good friends who are not web developers and agreed to introduce me to their tooling. And so, I met with: Kasia — a structural engineer, Bolko — photographer and a filmmaker, Ola — scientist and measurement and control systems designer, Kuba — game designer and programmer and Patrycja who is a graphic designer. I asked them to walk me through their usual workflow, talk about what they like and dislike about their tooling and how they learn about new features.
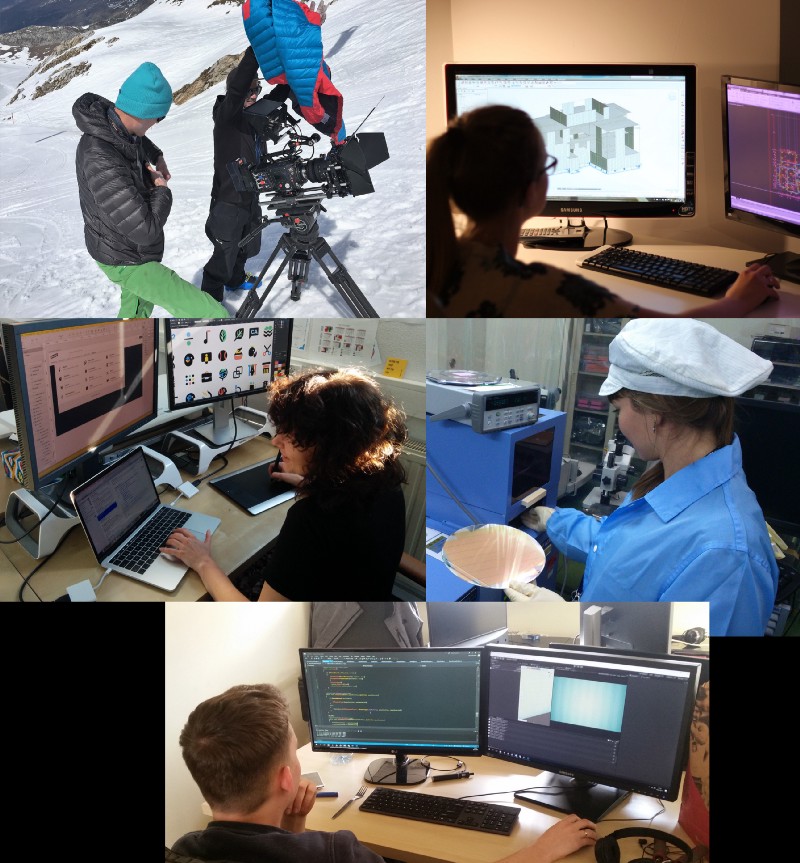 My friends at work.
These interviews brought some intriguing insight into how others work. Here are some of the ideas I gathered that could be brought to browser DevTools.
Imagining the future
Flexibility
All the applications that I was introduced to (DaVinci Resolve, Autocad, Sketch, LabView, Unity) have much more flexible layouts than our DevTools. Each panel, tab, and window can be moved around, closed and resized. This is something that helps personalize the tool and fit it to your needs. Unity even allows you to save and manage multiple layouts with ease. Meanwhile, in our DevTools, it’s impossible to have Performance and Sources panels side by side.
To show how a flexible layout would look like in Chrome DevTools I build a prototype based on the golden-layout:
Building from blocks
One thing that I loved about Sketch and LabView is how they allow you to build bigger blocks out of smaller ones. In Sketch, you can create a library of symbols (e.g. buttons, labels, inputs) from which you can then build a complete design of a webpage. If you decide you want to change how a button looks, you can quickly go from a “webpage” view to editing a specific “symbol”. And when you are done, all buttons on your design are updated accordingly.
If you had a chance to build an app or a website using modern framework, all this talk about “symbols” probably rang a bell. With so many new apps built with web/react/etc. components I believe that we could greatly improve our DevTools by making them understand these concepts better.
To show what a better integration with components could look like, I created a prototype that allows the developer to seamlessly switch between working on a particular page/screen and a single component:
Context aware inspector
Unity has a very neat inspector tool that presents you with different options depending on the element being inspected (3d model, sound file, scene). You don’t have to change tools whenever you switch from modifying a 3d model to modifying a sound file — inspector just adapts itself based on the context.
In our DevTools, we get the same “Styles” panel no matter what node in the DOM tree we are currently inspecting. For some things, like a META tag, SVG path, script tag etc. “Styles” panel is not that useful, so in my next prototype I tried to address that:
Timeline
When editing a video, e.g. using DaVinci Resolve, you operate on a timeline that allows you to easily jump between various parts of your project. This ease of going back and forth got me thinking how incredibly useful that feature would be to have in our tooling.
Animation finished before you managed to inspect it? You clicked “Next” in the debugger too many times and missed the code that you wanted to debug? Right now you have to reload the page and try again, but with a timeline tool it would be a breeze:
If this prototype seems a bit too futuristic to you, you should know that we already made a step to make it possible —Edge’s JavaScript engine supports Time Travel Debugging.
Infinite canvas
Almost every tool that I was introduced to implemented an idea of an “infinite canvas”. The idea is to give you a space on which you can freely arrange your drawings, designs, components, etc. And if you want to focus on any of those things everything is just a scroll and zoom away.
A developer working on a website is definitely not interacting with it in the same way as a regular user does. Maybe it’s time to rethink how the main browser window could be improved to better accommodate needs of developers. I believe that “infinite canvas” idea fits here perfectly. What if you could keep multiple devices, browsers and screen sizes all on the same canvas? How nice it would be to be able to quickly preview all pages of your application? What about dumping browser tabs all together and switching completely to the scroll and zoom navigation?
Turning ideas into reality
Hopefully, you liked some of the ideas presented above, and agree with me that they would make our tooling even better. I’m sure you have some good ideas of your own to. But now what? Should we just wait and hope for these ideas to be implemented?
If you don’t want to wait, I have some good news. Firefox and Chrome DevTools can be easily extended via browser extensions. It’s also possible to contribute to Firefox DevTools, Chrome DevTools or Safari Web Inspector directly as all of them are open source. Finally, if you’d like to create a tool that integrates with a browser, but is separate from it (just like VS Code), you can build it on the top of the DevTools Protocol. For more inspiration and examples of what's possible, I suggest checking awesome-chrome-devtools.
(Big thanks to Kenneth Auchenberg, Jonathan Garbee, Umar Hansa and Jason Laster and for reviewing this post)