
By Yannawut Kimnaruk
Microsoft Power BI is a business analytics tool which allows users to gain insight from their data.
You can easily create an interactive dashboard by just dragging and dropping data columns into the visualization plane.
In this article, I'll show you how to use Python to help you leverage the capabilities of Power BI.
Why Use Python and Power BI Together?
Many data analysts and data scientists are already familiar with Python programming. So they can easily pick up Power BI to use in the EDA (Exploratory Data Analysis) process. Data analysts can also tell a story from the data with a dashboard created from Power BI.
I like Power BI because it is easy to drill down the data and find insights. When I filter features/columns in a visualization, it will also affect others visualizations. Then, I can focus on one category before moving to others.
Microsoft Power BI already supports two different languages: the M language and DAX (Data Analysis Expression). But it's sometimes more convenient to use Python for the data preparation process. This is because it gives you access to various Python libraries, a set of useful functions that eliminate the need for writing code from scratch.
By implementing Python in Power BI, you can benefit from both Python and Power BI. You can easily perform EDA and create presentations using Power BI's interactive dashboard. You also have the flexibility to write Python code for the dashboard.
What We'll Cover:
- How to install Python
- How to set up Python in Power BI
- How to use Python to get data
- How to use Python to transform data
- How to use Python to visualize data
How to Install Python 📥
Before using Python in Power BI, you have to install Python. I recommend installing Anaconda since it is a useful tool to manage Python libraries and environments.
Step 1: Install Anaconda

Go to https://www.anaconda.com/products/distribution and download and install Anaconda on your computer.
Step 2: Open Anaconda Prompt
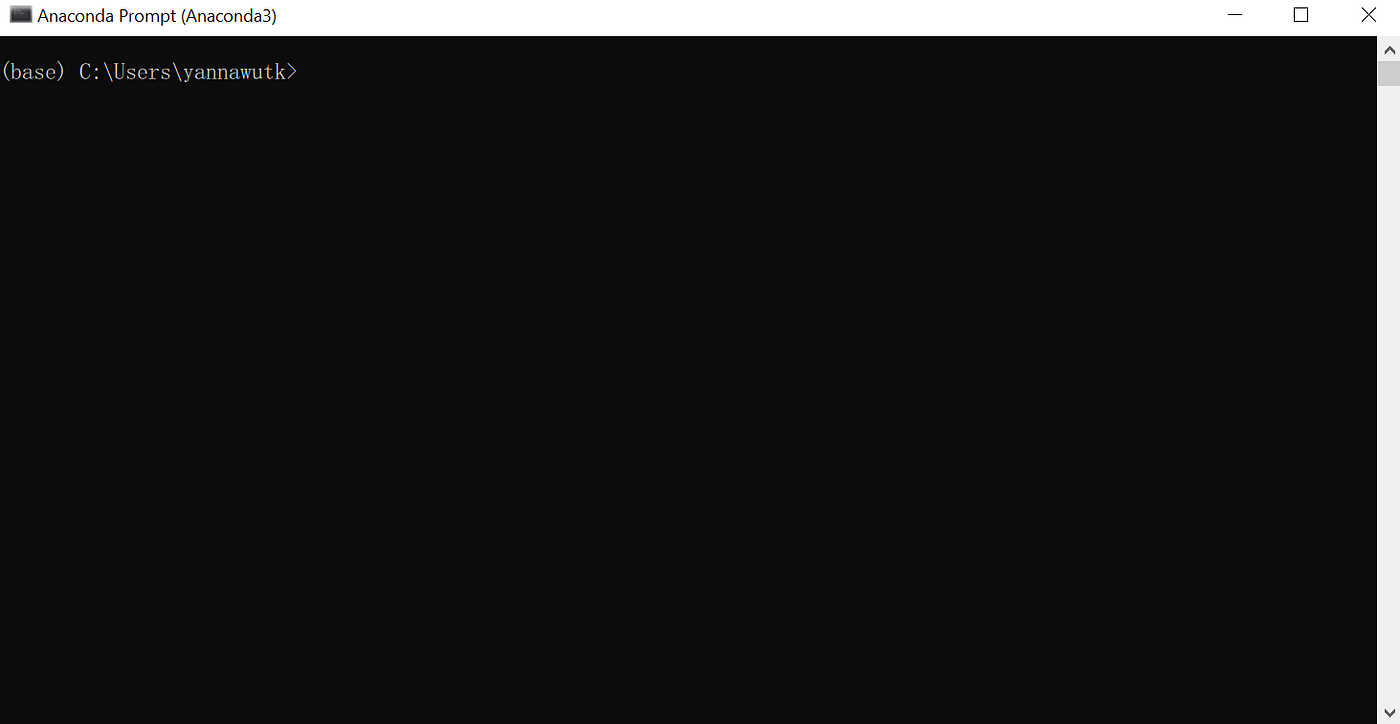
Search for the Anaconda Prompt and click to open.

You will see a black screen pop-up. Make sure that the title bar is Anaconda Prompt.
Step 3: Create a Python 3.6 Environment
Power BI may have issues when working with high-version Python (as of writing this article, the latest Python version is 3.9). To avoid technical issues, I created a new Python 3.6 environment and I didn't have any problems with it.
You can downgrade your Python version directly, but this isn't recommended since it may affect other projects. You can think of the Anaconda environment as a working box containing a specific Python package collection. When you work in this environment, it will not affect other projects.
In the Anaconda Prompt, create a new environment by typing the following code
(just replace with the name of your environment such as python36):
conda create --name <env_name> python=3.6
Then, when you see Proceed ([y]/n)?, type y and Enter.

Wait until it finishes running.
Check that a new environment was created successfully by typing this command:
conda env list
You will see a list of Anaconda environments. If you see a new environment, you are ready to proceed to the next step.

Step 4: Install Useful Python Libraries
Before installing any Python packages, make sure that you are in the environment you just created by typing the following command in the Anaconda prompt:
conda activate <env_name>

Then, you will observe the change of environment name in the parenthesis.
You can install Python libraries/packages that you are going to use in Power BI by typing the following command (just replace with the name of the package you want to install, such as pandas, numpy, matplotlib, and so on):
pip install <package_name>
How to Set Up Python in Power BI ⚙️
After you finish the Python installation, it's time for Power BI!
Step 1: Install Power BI
Go to https://www.microsoft.com/en-us/download/details.aspx?id=58494.
Download and install Power BI on your computer.
Then open Power BI.
Step 2: Click 'File' in the upper left corner.

Step 3: Click 'Option and settings'. Click 'Options'.

Step 4: Click 'Python scripting'

Step 5: Change Directories and Navigate to Your Python Environment
Change the detected Python home directory to "Other" and browse for your Python environment created in the previous step.

Tip on how to find the Python environment directory:
Open Anaconda Prompt and type in the below code:
conda env list
You will see a list of Anaconda environments.

Copy the path after the environment name such as C:\Users\yannawutk.conda\envs\python36
Now, you are ready to use Python in Power BI.
You can use Python in three important ways: to get data, transform data, and visualize data.
If you want to follow the code in this article, you can download the sample data from this Kaggle dataset.
How to Use Python to get Data 🧺
You can use Python to get data. This is helpful in web scraping (getting data from a website) and pulling data from an API (Application Program Interface). For example if you wanted to gather data from Twitter or Trello.
These data acquisition methods aren't necessarily available in Power BI without Python.
In this example, I will create a Python file to get data from two sources: a CSV file (download it from the link provided above) and a created dataframe (a table with rows and columns).
Step 1: Click Get data

Step 2: Search for Python Script and Click to Open a New Coding Window.

Step 3: Type in the Below Code and Click Ok
The df1 is data from the CSV file and df2 is a created dataframe with two columns, A and B. You must change the directory of df1 to the downloaded CSV file location.
import pandas as pd

df1 = pd.read_csv("C:/Corona_NLP_train.csv", encoding = "ISO-8859-1")
df2 = pd.DataFrame({'A': [1, 3, 6, 8],'B': [10, 30, 50, 90]})

Step 4: Load the Data
You will see a Navigator plane showing data (like in other data fetching methods.). Click the checkbox of the data you want to load and click 'Load'.

And there you have it! Now let's see how we can transform the data.
How to Use Python to Transform Data 🔄
You can also use Python to transform your data. Mostly, I use it with regular expressions. For example, you can use it to extract sub-strings from another column that match defined patterns (such as getting hashtags from Twitter text).
In this example, I will find text length using the len() function in Python.
Step 1: Click Transform Data

Step 2: Select the Query you Want to Transform

Step 3: In the Transform Tab, Click Run Python Script

You will see a new Run Python script window. Write your code here and click ok.
dataset['Count'] = dataset['OriginalTweet'].str.len()

Key concept: the data will be a ‘dataset’ DataFrame, so you can manipulate it with Pandas functions.
Step 4: Expand the Table
The result will be a table. Click to expand the table. Make sure that ‘Use original column name as prefix’ is not checked.

You will see the result of the data transformation and the steps are added in the APPLIED STEPS plane.


How to Use Python to Visualize Data 📊
Creating a plot using visualization from Power BI alone may have some limitations and some plots may not available in Power BI.
Python comes in handy since there are many libraries in Python that can generate any visualization you wish.
Python libraries for Data Visualization that are commonly used these days include Matplotlib, Plotly, Seaborn, and ggplot.
Although writing code in Python to create a plot may be more difficult than the drag-and-drop concept of Power BI, there are many more plot customization and code examples (to use as references).
Let's see how it works now, step by step.
Step 1: In the Visualizations Plane, Click the Py Icon (Abbreviation for Python)

You will see an empty Python script editor area.
Step 2: Select the Columns You Want to Visualize.

You will see an empty coding area.
Step 3: Write the code
Now it's time to write your code. Don’t forget to add plt.show() to show the graphs. Click the run icon and wait for the result. And you're done!
import seaborn as sns
import matplotlib.pyplot as plt
import re

def find_hash(text):
    line=re.findall(r'(?<=#)\w+',text)
    return " ".join(line)

dataset['hash'] = dataset['OriginalTweet'].apply(lambda x:find_hash(x))
temp = dataset['hash'].value_counts()[:][1:11]
temp = temp.to_frame().reset_index().rename(columns={'index':'Hashtag','hash':'count'})

plt.figure(figsize=(20, 15))
sns.barplot(x="Hashtag",y="count", data = temp)
plt.show()

Note: If it shows an error after running the code, take a deep breath and read the error message. :)
Conclusion
This article showed you how to use Python in Power BI step by step, so you can get the advantages of both the Power BI interactive dashboard and Python's flexibility.
You can apply Python code in many ways including data acquisition, transformation, and visualization.