by Sacha Greif

The State Of JavaScript 2016: Results
The Wait Is Over
I just looked through my inbox, and found a receipt for the awesome React for Beginners course dated November 4, 2015. So it’s been almost one full year since I ventured into the Wild West of modern JavaScript development.
I’m now fairly confident in my React skills, but it seems like as soon as I master one challenge, another one pops up: should I use Redux? Or maybe look into Vue instead? Or go full-functional and jump on the Elm bandwagon?
I knew I couldn’t be the only one with these question, so I decided to launch the State of JavaScript survey to get a more general picture of the ecosystem. Turns out I hit a nerve: within a week, I had accumulated over 9000 responses (no meme intended)!
It took me a while to go through the data, but the results are finally live!
Check out the survey results here
And if you’d like to know a little bit more about the whole enterprise, just read on.
Analyzing the Data
You might be wondering why it took me so long to analyze and publish the data. Hopefully this will become clear when you read through the report.
I didn’t want to simply publish a bunch of charts with no context. Raw stats are great if you already know what you’re looking for, but if you’re looking for guidance then they can just as well add to the overall noise.
Instead, I decided to use these stats as a basis for a detailed report on the current state of JavaScript.
The Authors
I was originally planning on writing the whole thing myself, but I quickly realized that A) this would be a lot of work and B) I didn’t want the report to be too biased by my own preconceptions.
So I asked a few developer friends to pitch in and write the various sections of the report. Not only is the overall report a lot more objective –and interesting– as a result, but I was also able to get experts for each topic (I’ll be the first to admit that there are entire swathes of the JavaScript world I know little about).
So a huge thank to all the authors who contributed to the report: Tom Coleman, Michael Rambeau, Michael Shilman, Arunoda Susiripala, Jennifer Wong, and Josh Owens.

The Charts
Here’s a little more info about the main types of chart you’ll see throughout the survey.
Stacked Bar Chart

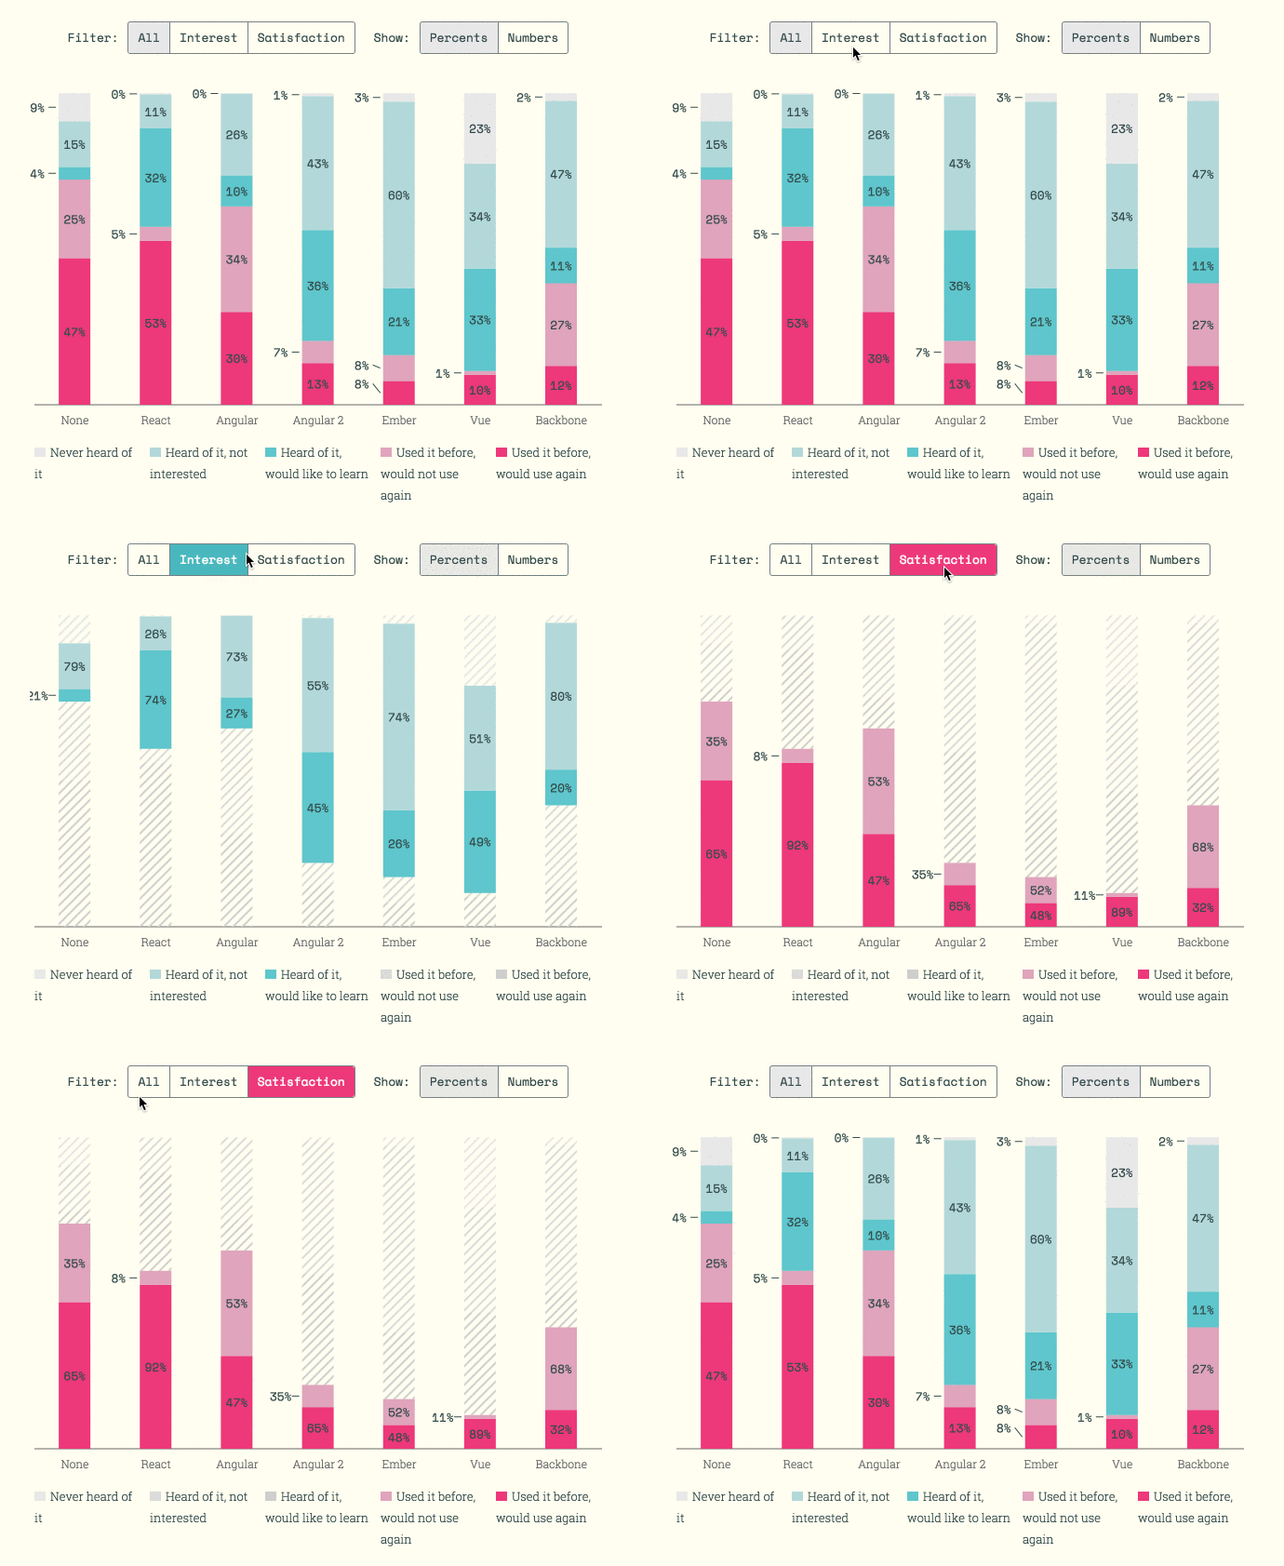
This is the main chart for each section. For each technology, it shows the breakdown of developers who have never heard of it, have heard of it but aren’t interested/want to learn it, and have used it and would not/would use it again.
You can toggle between percents and absolute numbers as well as filter by interest or satisfaction. But note that when filtering, the percentages are relative to the currently selected value pair (in other words both numbers total 100%).
Heatmap
I also wanted to explore the correlations between each technology.

The heatmap charts achieve this by showing you how likely someone who uses one technology (defined as having selected “I have used X and would use it again”) is to use another technology, compared to the average.
Pink means very likely, blue means very unlikely. In other words, a deep pink tile in the React row and Redux column means “React users are a lot more likely than average to also use Redux”.
Built With
I decided to practice what I preached and build the survey app itself using modern JavaScript tools, namely React powered by the excellent Gatsby static site generator.
It might seem weird at first to use React for what is essentially a static HTML page, but it turns out this brings a ton of advantages: for example, you’re able to use React’s vast ecosystem of modules such as the great Recharts library.
In fact I believe this may just prove to be a new, better approach for developing static sites, and I hope to write a more detailed post about it soon.
Partners
Finally, I wouldn’t have been able to take a month off to work on this without financial support from some really cool people.
Both Wes Bos (who has put out the afore-mentioned React for Beginners as well as the new ES6 for Everybody) and egghead.io (which in my opinion is the single best resource out there for learning cutting-edge JavaScript development) accepted to sponsor the project. Thanks guys!
Support the Project
If you think what I’ve done here is valuable and would like to support the project, a tweet or share would be much appreciated!
Additionally, you can also contribute a donation to get access to the raw anonymized data (or just enter “0” to get it for free).
What’s Next
Now that the survey is over and we all know what the best technologies are, hopefully we can put any talks of “JavaScript fatigue” or “endless churn” to rest and move on with our programming lives.
Haha, as if!
If one thing has become clear to me, it’s that the growing pains that JavaScript is going through right now are only the beginning. While React has barely emerged as the victor of the Front-End Wars of 2015, some developers are already decrying React for not being functional enough, and embracing Elm or ClojureScript instead.
In other words, my job here isn’t done, and I fully intend to do this survey again next year! If you want to be notified when that happens, I encourage you to leave me your email here.
Until then, I can only hope these survey results will provide a little clarity in our never-ending quest to make sense of the JavaScript ecosystem!
