
By Anuj Pahade
Dash is an open source library for creating reactive apps in Python. You can create amazing dashboards in your browser using Dash.
The Iris data set can be called the ‘hello world’ of data sets. In this article, we’ll learn how to build a simple Dash app in which we’ll use the Iris data set. This data set is clean, which is good for us so that we can focus on dashing instead of cleaning the data.
Dash setup
To build cool apps, you need hot libraries.
If you have not already installed Dash, then run these commands in your terminal :
pip install dash==0.21.1 # The core dash backendpip install dash-renderer==0.12.1 # The dash front-endpip install dash-html-components==0.10.1 # HTML componentspip install dash-core-components==0.22.1 # Supercharged componentspip install plotly --upgrade
Run your app as :
python helloiris.py
Be clear with your Python versions.
App layout
We can build the layout with the dash_html_components library and the dash_core_components library. I have imported them as shown above. The dash_html_components is for all HTML tags, whereas the latter one is for interactive components built with React.js. Having said that, let’s write something in our browser using Dash:
app.layout = html.Div(children=[ html.H1(children='Iris visualization'), html.Div( ''' Built with Dash: A web application framework for Python. ''')])
Yes! That’s how easy it is. The equivalent HTML code would look like this:
<div> <h1> Iris visualization </h1> <div> Built with Dash: A web application framework for Python. </div></div>
Notice the children attribute in the first Div . It is used to define the list of elements enclosed in that tag. This is a positional argument (always comes first) and can be skipped as you can see in the next H1 and Div shown above.
Can we style it? I hear you ask. Well, of course! Dash allows you to write style dictionaries as you would write in a <style> tag in HTML. It also lets you write inline CSS and link external CSS files. Here is how we can do it.
Style dictionaries
Let’s create a dictionary called colors.
colors = { 'background': '#0000FF', 'color': '#FFA500'}
It can be attached with an element using the style attribute as shown.
app.layout = html.Div(style=colors,children=[ html.H1(children='Iris visualization'), html.Div( ''' Built with Dash: A web application framework for Python. ''')])
Inline CSS
In Dash, the keys of dictionaries are camelCased . So instead of text-align we use textAlign . Also the class attribute of HTML tags is className as you might know if you use React.
app.layout = html.Div(style=colors,children=[ html.H1(children='Iris visualization',style = {'textAlign':'center'}),
html.Div(style={'textAlign':'center'},children=''' Built with Dash: A web application framework for Python. ''')])
External CSS
We can create a list of URLs or paths to CSS files we want to include in our Dash app, and then use app.css.append_css to include them.
external_css = ["https://maxcdn.bootstrapcdn.com/font-awesome/4.7.0/css/font-awesome.min.css", "https://maxcdn.bootstrapcdn.com/bootstrap/4.0.0/css/bootstrap.min.css" ]
for css in external_css: app.css.append_css({"external_url": css})
We can include JavaScript in the exact same way by using app.scripts.append_script
I hope you’re with me till now! This is how our helloiris.py file looks:
import dashimport dash_core_components as dccimport dash_html_components as html
app = dash.Dash()
#External CSSexternal_css = ["https://maxcdn.bootstrapcdn.com/font-awesome/4.7.0/css/font-awesome.min.css", "https://maxcdn.bootstrapcdn.com/bootstrap/4.0.0/css/bootstrap.min.css", ]
for css in external_css: app.css.append_css({"external_url": css})
#External JavaScriptexternal_js = ["http://code.jquery.com/jquery-3.3.1.min.js", "https://maxcdn.bootstrapcdn.com/bootstrap/4.0.0/js/bootstrap.min.js"]
for js in external_js: app.scripts.append_script({"external_url": js})
#Internal CSScolors = { 'background': '#0000FF', 'color': '#FFA500'}
#Our app's Layoutapp.layout = html.Div(style=colors,children=[ html.H1(children='Iris visualization',style={'textAlign':'center'}),
html.Div(style={'textAlign':'center'},children=''' Built with Dash: A web application framework for Python. ''')])
if __name__ == '__main__': app.run_server(debug=True)
Let’s get some data
Assuming you’re familiar with pandas, we’ll use this Python library to import the iris.csv file in our app. If you don’t know what this dataset is about, then I recommend that you read and download it from here.
import pandas as pd
header_names =[ 'sepal_length', 'sepal_width', 'petal_length', 'petal_width', 'class']
df = pd.read_csv('path/to/Iris.csv',names=header_names)
Now that our data is loaded into the df dataframe, it’s time for visualisation.
Data visualization
Remember the interactive components I told you about? The dash_core_components library? Well that’s what we are going to use here.
import plotly.graph_objs as go
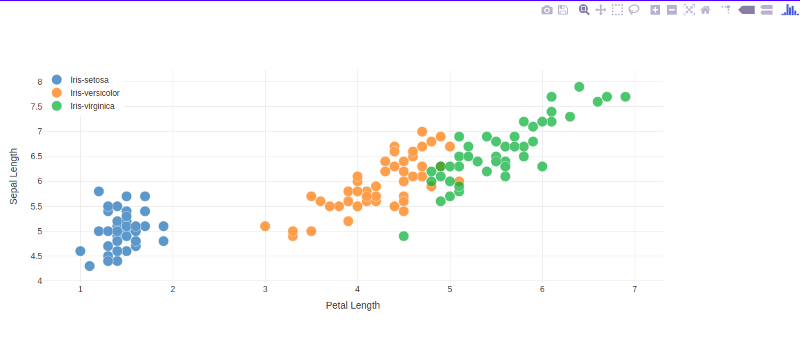
Let’s add a new component to our app.layout . This time it’s not an HTML tag but an interactive graph. Dash uses Plotly to plot graphs.
dcc.Graph( id='Iris Viz', figure={ 'data': [ go.Scatter( x=df[df['class'] == i]['petal_length'], y=df[df['class'] == i]['sepal_length'], mode='markers', opacity=0.7, marker={ 'size': 15, 'line': {'width': 0.5, 'color': 'white'} }, name=i ) for i in df['class'].unique() ], 'layout': go.Layout( xaxis={'title': 'Petal Length'}, yaxis={'title': 'Sepal Length'}, margin={'l': 200, 'b': 40, 't': 100, 'r': 200}, legend={'x': 0, 'y': 1}, hovermode='closest' ) } )
Whoa! A whole paragraph in Python! Don’t worry. It’s not difficult to understand. Let’s go over it piece by piece:
The dcc.Graph has an id argument which is used to reference the graph in the future for deleting or overlaying or any other purposes.
The figure argument is the same as the one used in plotly.py. It takes in two arguments, data and layout.
In data we can specify which columns of the dataframe to plot on which axis. We can also specify the mode, for example: marker and then the properties of marker such as width and line (meaning border).
In layout we define the axes labels, legend position, graph margins (left, top, bottom, right) and much more.
This isn’t it. These graphs are interactive and can be manipulated by user inputs.
Ok, so let’s go build some cool DashApps this summer!
Stay tuned for my next posts. This is not my first time coding or making an app, but it’s my first article on Medium! I think claps and recommendations will motivate me :)
Don’t hesitate to contact me via email: anujp5678[at]gmail[dot]com
Or connect with me on LinkedIn https://www.linkedin.com/in/anuj-pahade/
Keep dashing and happy coding!