By Sacha Greif
We gave the community access to our data. Here’s the result
Last month we announced the State of JavaScript Dataviz Contest: we gave the JavaScript community access to the State of JavaScript 2018 survey data (you can find it here), and we asked you to share any new visualizations you created with us in return.
We judged the entries according to three main criteria:
- Effort: how much time and care you put into your visualization.
- Usefulness: how insightful or useful your work is.
- Originality: for works that show out-of-the-box thinking or are just plain fun!
So without further ado, here are the three contest winners who won a very exclusive State of JS x DotJS t-shirt!
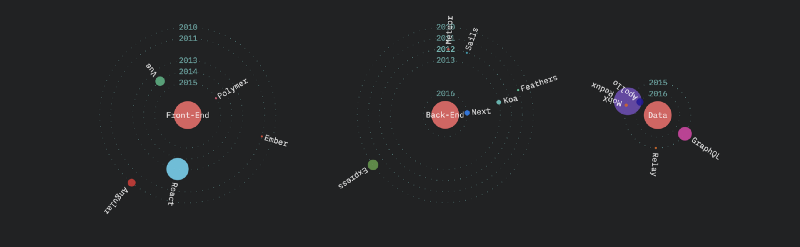
State of JS: Galactic Edition by Gregory King
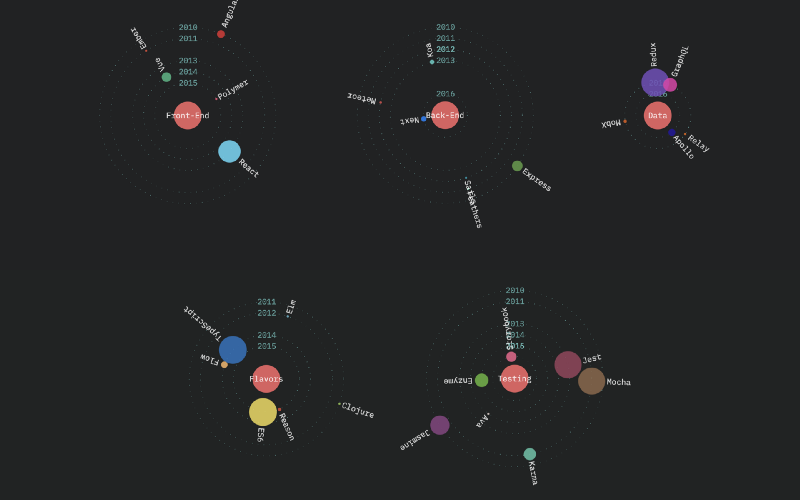
Greg’s State of JS: Galactic Edition ticks all three boxes: it clearly took some effort to come up with that concept and add some visual polish; it’s useful as it surfaces some information that wasn’t even available in the survey (when each library was first released); and it’s certainly creative!
What I particularly like about this visualization is that it uses movement speed as a meaningful indicator to communicate the amount of interest in a technology.
I don’t think I’ve ever seen a data visualization make use of this dimension, and it certainly opens up a lot of possibilities that are unique to digital media!
State of JS Periodic Table by Thomas Heyenbrock
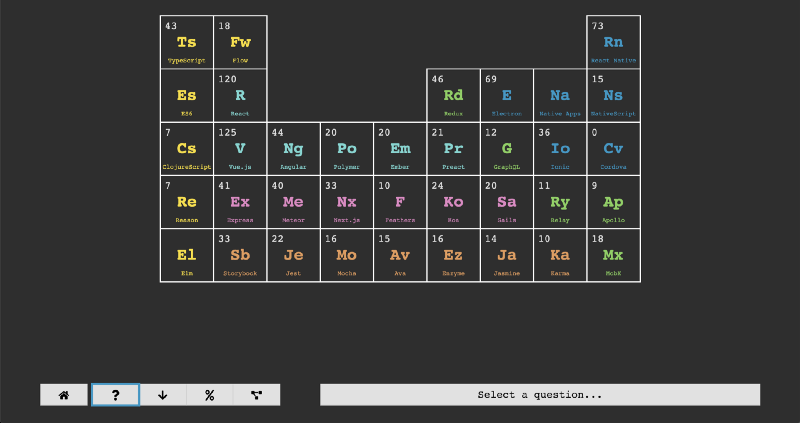
Thomas took our periodic table theme and just ran with it. His own take on the JavaScript periodic table is fully animated, and surfaces very interesting datapoints, such as:
- which technology has the best documentation?
- what technologies are the easiest to learn?
- what technology has the highest momentum?
And not only that, but you can even plot one of these questions against people’s opinions of the overall JavaScript ecosystem!
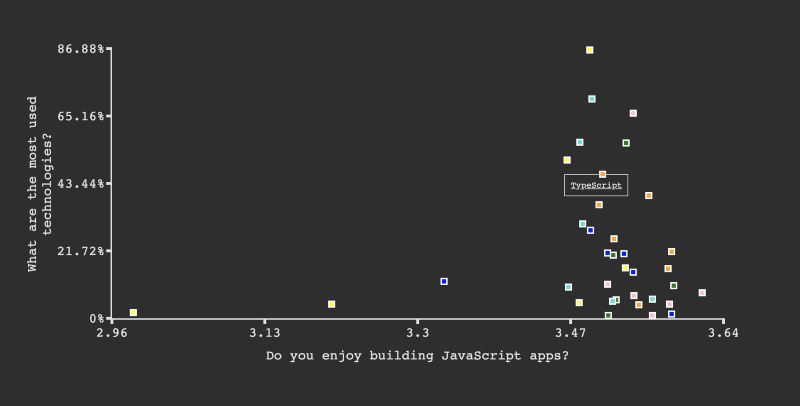
If you’ve ever wondered what technologies are used most commonly by developers who don’t enjoy using JavaScript, now you can find out!
Demographic Data Exploration by Rubén Valseca
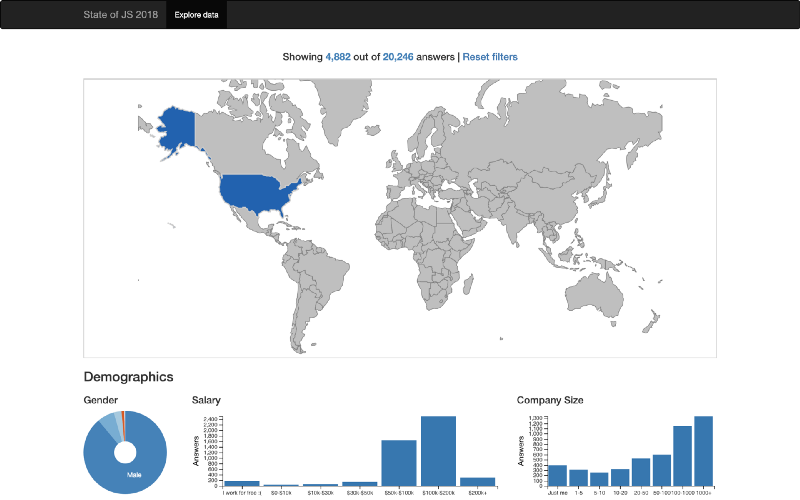
Ruben’s data visualization provides a detailed country-by-country breakdown of our results.
Do female JavaScript developers in Norway earn more than their Japanese counterparts? Answer: yes, they do! And thanks to Ruben we’ve now got the data to prove it.
Congrats to our three winners, and thanks to everybody who participated! You can check out the full list of submissions in this GitHub thread, and stay tuned for more State of JS news coming soon!