By Gautham Koorma
In 2003, Rolling Stones Magazine polled musicians, producers, and industry executives about their favorite albums. The result was a special issue titled “The 500 Greatest Albums of All Time.”
The list — which they revised in 2012 — mainly features American and British music from the 1960s and the 1970s.
As an ardent music fan and an aspiring music producer, I listen to a wide variety of genres. The Rolling Stones list served as an introduction to rock music for me back in the day.
One day I while browsing through Kaggle to pick up a simple data set and test my newly acquired data visualization skills, I stumbled upon the list uploaded as a CSV dataset. I decided to get my hands dirty by using pandas to explore the data and bokeh to visualize the results.
Bokeh is a Python library for interactive visualization. It features a powerful interface that supports high-level charting, intermediate-level plotting, and lower-level modeling.
The complete code I used for reading, refining, exploring, and visualizing the data can be found on my GitHub page, and also in this notebook submitted on Kaggle.
This post will describe the approaches I took, complete with my visualizations and the insight I gained from building them.
Getting and Structuring the Data
Getting the data was simple, since it was in a 500 x 6 excel spreadsheet. All I had to do was read it into a pandas data frame directly by using the [read_excel()](http://pandas.pydata.org/pandas-docs/stable/api.html#input-output) function.
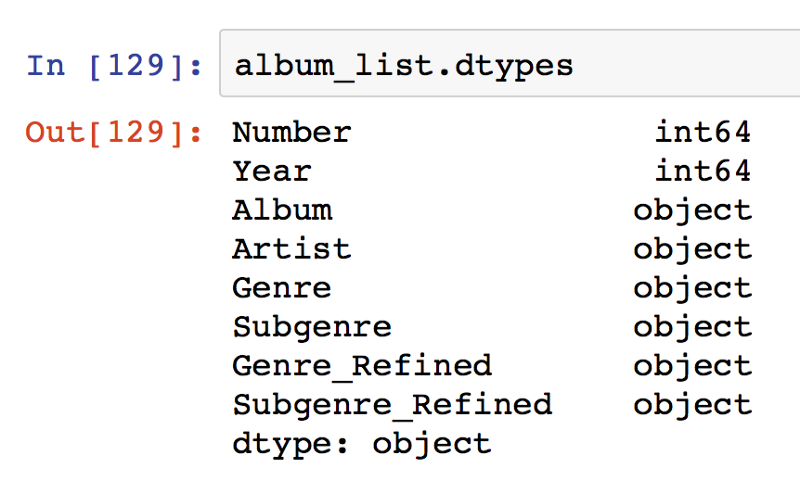
The data frame had 500 rows, one for each album listing the Chart Number, Year, Album, Artist, Genre, and Subgenre. The Genre and Subgenre columns had multiple comma separated values in a string, so I had to split the string at the first comma and keep just the first value in new columns as the most relevant categorization of the album’s Genre and Subgenre.
The master data frame became 500 x 8 after the Genres_Refined and Subgenres_Refined columns were added.
I used a Python 3.5.2 kernel (Anaconda 4.2.0 distribution) on a Jupyter notebook.
Exploring the Data and Gaining Insights
I adopted the split-apply-combine strategy using pandas inbuilt [groupby()](http://pandas.pydata.org/pandas-docs/stable/groupby.html) function in most cases and the reshaping strategy using pandas inbuilt [pivot_table()](http://pandas.pydata.org/pandas-docs/stable/reshaping.html) function for a single case. I fed the resulting data frames into bokeh charts and figures.
Here are the questions I posed and their resulting visualizations.
The top-10 artists who have the most albums on the list
To get the top 10 artists, I used groupby() on the artists column, took a count, and sorted the resulting data frame to get the top 10 artists having the most number of albums.
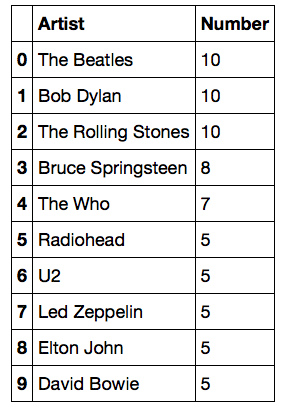
To visualize the results, I used the a figure object from the bokeh.plotting library and drew black circles using the circle() method.

Clearly, the Beatles, Bob Dylan, and the Rolling Stones topped the list with 10 albums apiece.
Year-wise count of the number of albums in the list
To get this, I used groupby() on the year column and took a count following which I sorted the data by year and plotted the resulting data frame using a line chart from bokeh.charts.
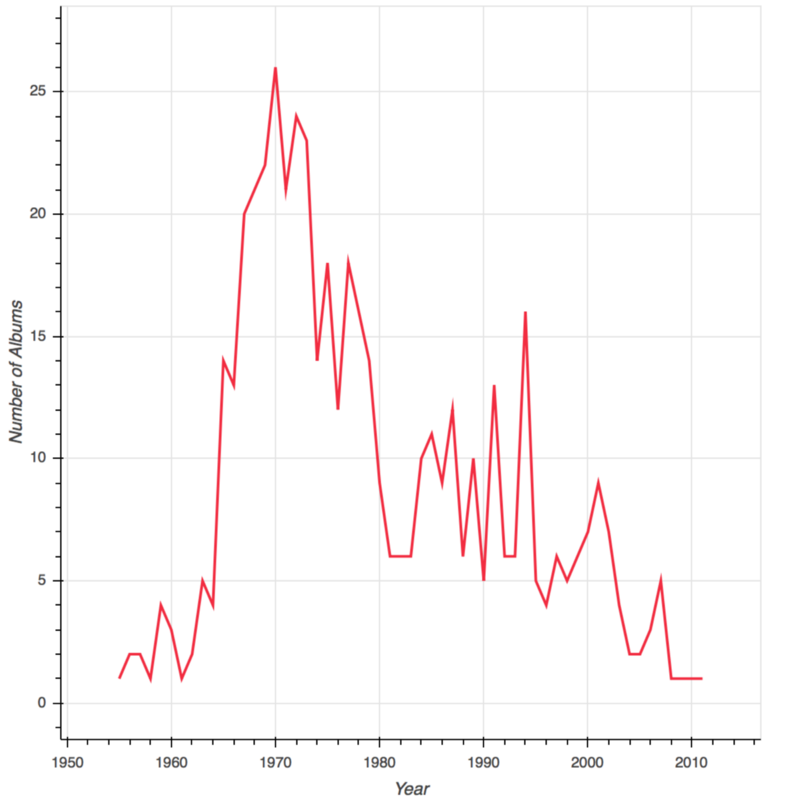
Maximum number of albums in the list were released in 1970. Albums released in the late 1960s and early 1970s were also found abundantly. The final spike is found in the early 1990s accounting for the outbreak of Pop, R&B, and Hip-Hop music.
Top Genres and Subgenres
To identify the top genres and the subgenres within them, I reshaped the data using the pandas _pivottable() function in which I set the index as the Genre_Refined and Subgenre_Refine columns, and set the aggfunc parameter to count.
After taking a subset of the data frame using a condition that there should be more than 5 albums in a subgenre, I fed the data frame to a bokeh donut chart and set the palette to Purples9.
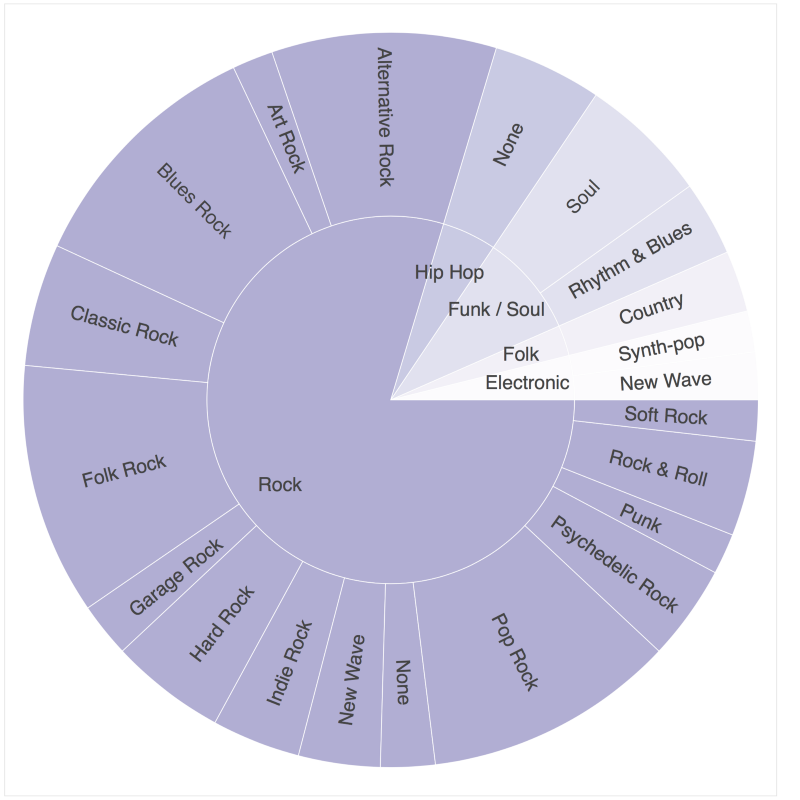
Rock and its subgenres cover about 80% of the selection. Hip-Hop, R&B, Soul, Country, and Electronic music albums covered the remaining 20%.
Songs in each Genre by year
To get this data, I did a groupby() on Year and Genre_Refined, took the count, sorted the values by Year, and fed the resulting data frame to a bokeh heatmap. This time I used the Reds9 palette.
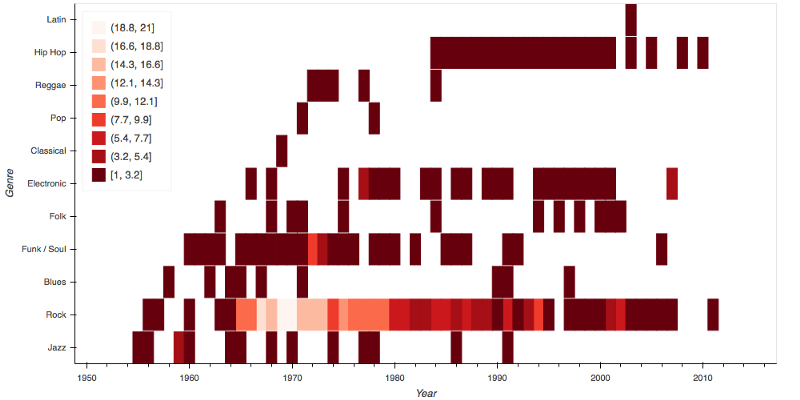
Rock music albums from the late 60s and the 70s are clearly the most numerous. Funk, Soul, and Jazz music albums reduced in numbers over the years, paving the way for Hip-Hop and Electronic albums.
Subgenres of Rock Over the Years
To get this data, I did a groupby() on the Year, Genre_Refined, and Subgenre_Refined, took a count, and subset the data frame to include just Rock in the Genre_Refined column. I then fed the resulting data frame to a bokeh heatmap.
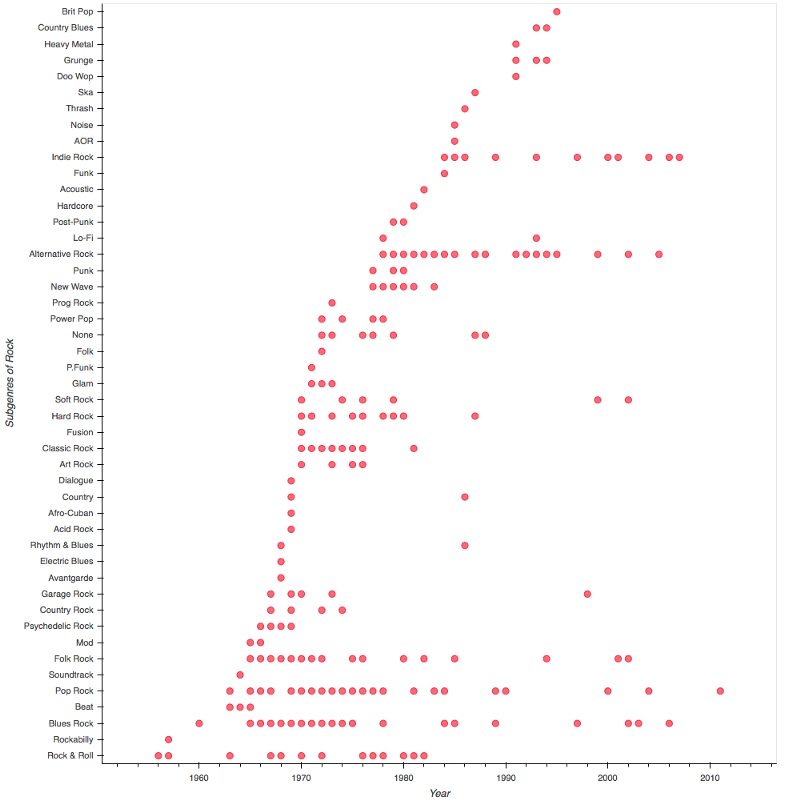
The initial few years were dominated by Rock & Roll, while Blues Rock and Pop Rock slowly increased in number by the mid 1960s. By the mid 1970s, Alternative Rock started coming into the picture, followed by Indie Rock in the mid 1980s.
A summary of the Top 10 albums
Finally, I summarized the top 10 albums in the list after grouping it by artist.
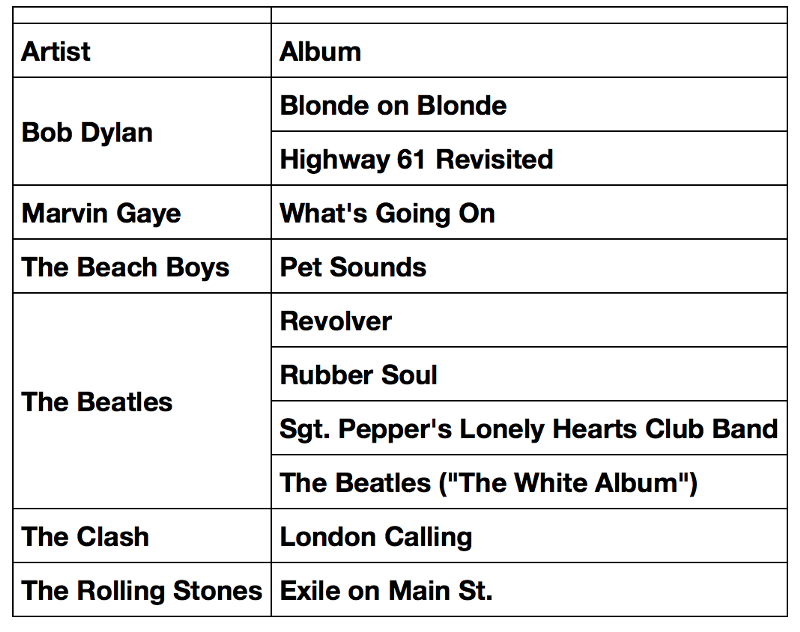
The final results are not really surprising. The Rolling Stone Magazine list mostly contains songs from from Rock and its various subgenres, with a few outliers in the form of Hip-Hop, R&B, Soul, Country, and Electronic music albums.
If you’re like me and like to occasionally reconnect with the music of the Beatles, Bob Dylan, Rolling Stones, and the other pioneers of Rock and Roll during the 60s and 70s, I suggest you give these top albums a listen, then explore from there.
If you’re curious, you can read the full list of albums here.
I’m a technology consultant, data science enthusiast, and aspiring music producer. If you have writing opportunities or are interested in getting in touch for work, feel free to write to me at contact at gautham dot biz.
If you liked this article, please hit the recommend button and share it with your friends.