By Sacha Greif
How we’re working to make the survey more representative
I was recently listening to a podcast episode about the State of JS survey and while the hosts were appreciative of our efforts, they also had a few criticisms about our methodology.
Mainly, that it wasn’t clear who exactly took the survey, how they found the survey, and whether that population sample was representative of the overall JavaScript ecosystem.
Those are valid questions, so let’s address them.
Representative… of What?
First, let’s address the question of “representativeness”. When you run a political poll to figure out how people are going to vote, you have a clear referential: the country’s total voting population.
A government census tells you how many voters there are and what their demographic breakdown is, which lets you compare your own poll to this data to figure out how representative your results really are.
When it comes to the “JavaScript ecosystem” though, we don’t have a clear referential.
From a senior engineer working on a 100+ developer team for a Fortune 500 company to a high-school student hacking on a JavaScript transpiler in their spare time, anybody can be a JavaScript developer.
At this point we had two choices:
- Spend a lot of time and effort trying to define what “the JavaScript ecosystem” means, estimate its total size and make-up, and then compare our results to that figure.
- Just let any developer take the survey, and present the results as they are without trying to relate them to a larger population.
We simply didn’t have the time or the know-how to go with option 1, so we picked option 2.
So Who Took the Survey?
So the natural next question is, who are these developers? This is where we could’ve done a better job. The truth is we had a limited amount of time to process all the data we accumulated, and we decided to focus that time on the actual results themselves rather than on the demographics section.
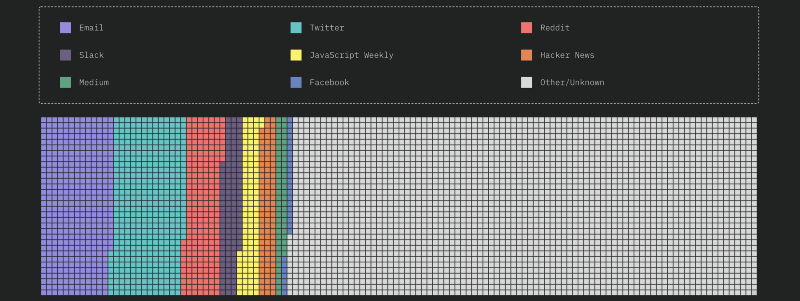
But since this has come up a few times, I went back and ran a rough aggregation on the self-reported “how did you hear about this survey?” question, coming up with this breakdown:
The number are as follows (out of a total of 20,252 respondents):
- Email: 2033 respondents (10.04%)
- Twitter: 2062 respondents (10.18%)
- Reddit: 1043 respondents (5.15%)
- Slack: 557 respondents (2.75%)
- JavaScript Weekly: 529 respondents(2.61%)
- Hacker News: 468 respondents(2.31%)
- Medium: 285 respondents(1.41%)
- Facebook: 140 respondents(0.69%)
- Other/Unknown: 13272 respondents(65.54%)
“Email” corresponds to our announcement blast to our own mailing list, which is made up of people who took the survey in previous years and signed up to be kept up to date.
We also had a field that automatically tracked the browser’s actual referrer value, which works better for some sources but not others (email for example). This lets us get a more granular picture for specific sites:
- t.co: 1591 respondents.
- Search: 1591 respondents.
Medium
- Take the State of JavaScript 2018 Survey! (announcement post published on freeCodeCamp): 3442 respondents.
- The 12 Things You Need to Consider When Evaluating Any New JavaScript Library (a post I wrote about our question methodology, also published on freeCodeCamp): 105 respondents.
Hacker News
- Frontpage: 634 respondents.
- State of Javascript 2018 survey is now out (posted on r/javascript): 144 respondents.
Other Forums
- Meteor forums: 61 respondents.
Blogs
- State of JavaScript 2018 Survey (Dev.to): 56 respondents.
- State of JavaScript 2018' Survey Announced (Slashdot): 219 respondents.
- The Ember Times — Issue №64: 18 respondents.
As you can see the only sources that might have an inherent bias towards a specific library are the Meteor forums and the Ember Times, and both Meteor and Ember happened to do pretty poorly in the survey.
Tough Decisions
I realize that by naming the survey “The State of JavaScript”, we’re staking a claim, and that a non-representative survey would be a problem.
So we fully intend to get closer and closer to the “truth” of the JavaScript ecosystem. We know people make decisions based on our research, and we take that responsibility very seriously.
At the end of the day, I truly believe the best thing we can do is just keep going, and try to grow the audience year after year. And hopefully, once we get past the 100k respondents milestone (if that ever happens!) we can finally put the representativeness worries to rest.
Want to help us make the next State of JS survey even better? Sign up to get next year’s announcement!


