
It is often useful for developers to visualize aspects of their code projects. This is especially true for version control systems like Git, where understanding the team's workflow is essential.
One way to approach this in Git is to draw a graph like the one you see above.
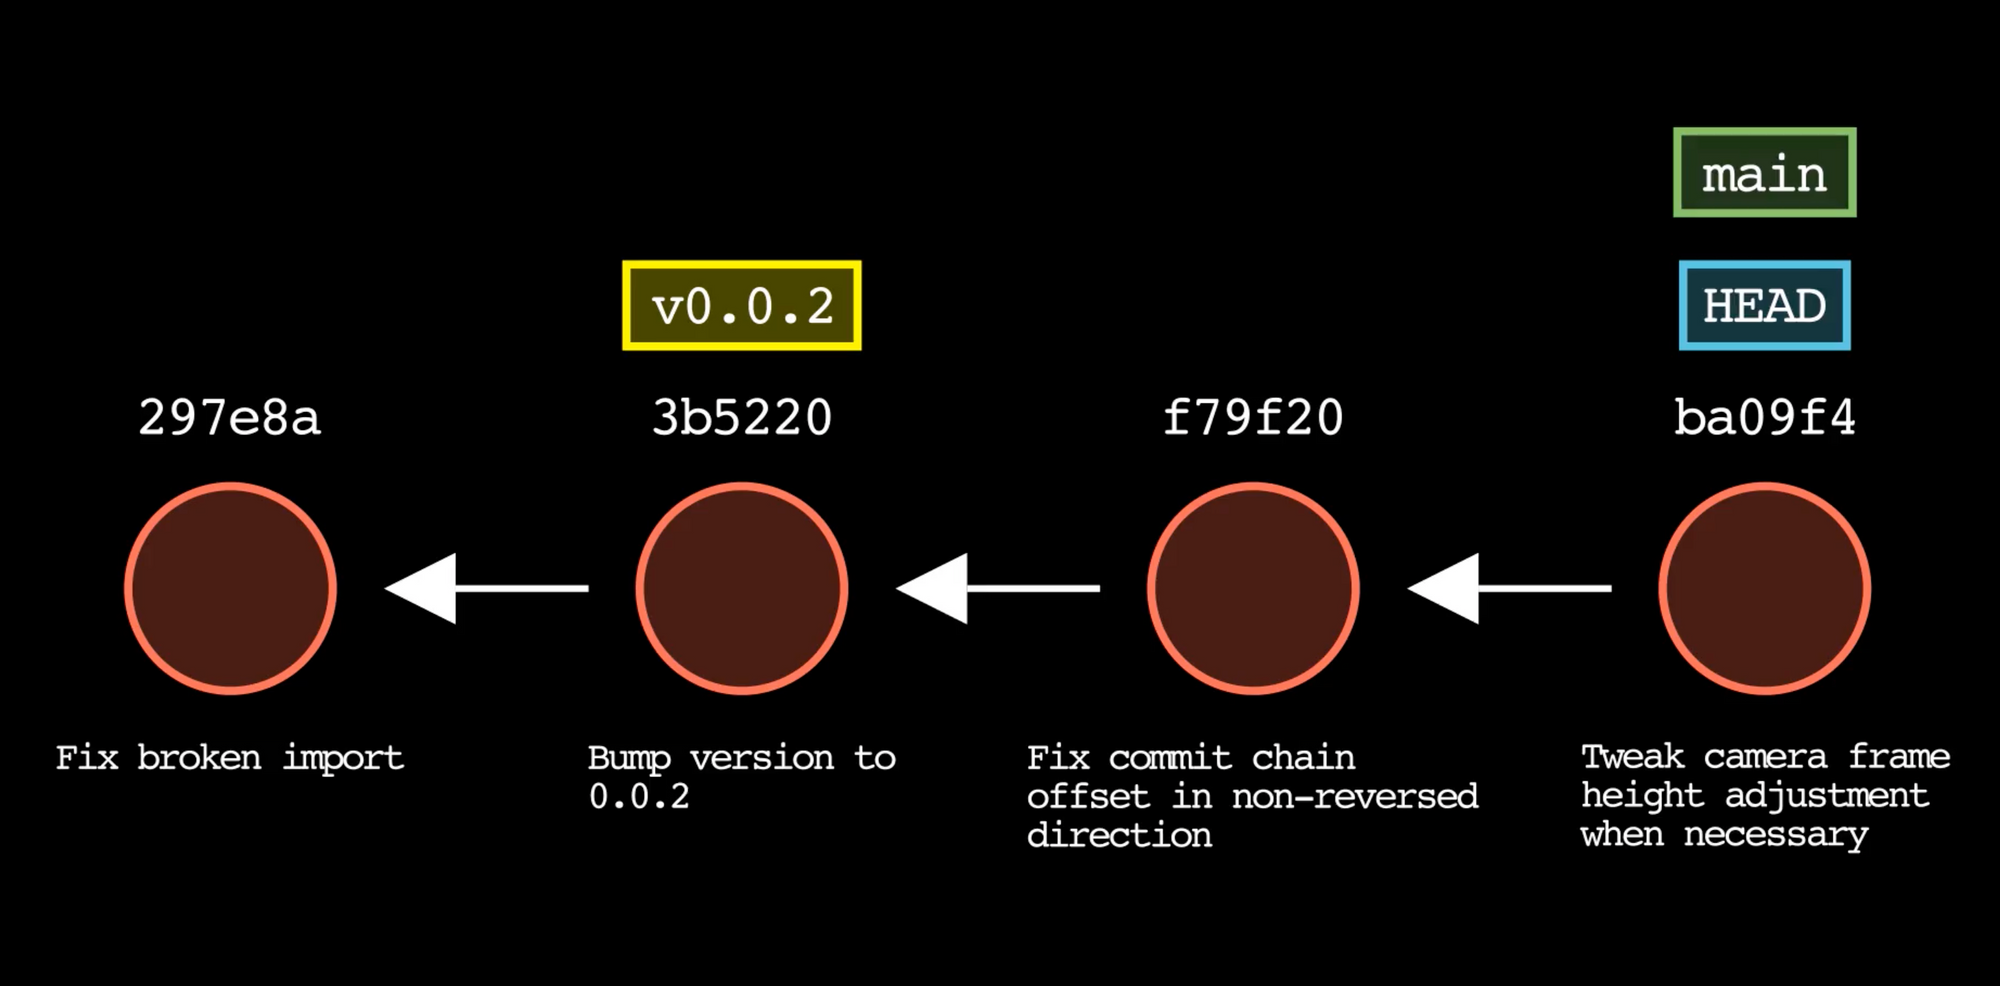
You've probably encountered images like this when learning how to use Git.
This graph depicts a sample commit history in a Git repository.
In Git, commit history is represented as a DAG, or Directed Acyclic Graph, which is a type of network graph. Each commit is displayed as a circle and commits are chained together using arrows. Each arrow points from a child commit to its immediate parent.
For the most part, if you want one of these graphs you need to draw it yourself (manually or digitally) – which takes time and effort. Also, these graphs are static and it would be more engaging in certain cases to animate the commit progression in a video format.
For those reasons, I created Git Story, which lets you easily generate mp4 videos presenting the layout and progression of your Git commit history, all using one single command: git-story.
How to Visualize Git's Revision History
In Git, a commit is also known as a revision and represents a set of content changes made at a specific point in time by a specific person.
There are several additional components that help us visually understand our Git history.
Commit Properties
When committing in Git, human readability is important. Therefore, it's best practice to leave a clear commit message describing your change. This helps other devs viewing the commit history understand the purpose of each revision.
The commit ID is a unique identifier for each commit, generated specifically from the content of each commit. As a Git user, you've probably seen that many Git commands accept a full or partial commit ID as an argument. For that reason, having commit ID's available in Git visualizations can be very useful.
Refs: Branches, HEAD, and Tags
When visualizing Git history, it is also useful to know where you are. Git refs (short for references) help you understand how commits are organized in your Git repository.
Refs are labels that Git attaches to specific commits. Branch names, Git HEAD, and tags are all examples of refs in Git. You can think of a ref as a human-readable name that points to a specific commit.
Git Story Video Output
Git Story parses all of this information for you – commits, relationships, and refs – and animates it as a .mp4 video. The best part is that all you need to do is browse to your project in the terminal and run the command git-story.
Below is an example of a video animation generated by Git Story:
Why I Wrote Git Story in Python
I chose to write Git Story in Python since there are two very useful libraries that power this project.
GitPython
The first is called GitPython. GitPython is a Python package that provides access to data from Git repositories via a convenient set of methods. This is how Git Story accesses data from the local Git repo in order to animate it:
import git

repo = git.Repo(search_parent_directories=True)
This creates a repository object within the Python program's memory that allows access to the underlying Git objects and their properties. A list of commits can be accessed as follows:
commits = list(repo.iter_commits(REF))

# This pulls a list of commits working backwards from REF
# REF can be a branch name, tag, HEAD, or commit ID
Iterating through the list of commits allows access to the properties of each commit, which are used in the next step for generating the animation.
Manim
The second dependency is called Manim which is used to generate animated math videos using a Python API. Manim makes it easy to create Python objects that represent lines, shapes, text, and equations, and place those objects in an animated scene.
Git Story uses Manim to draw the circles, arrows, text, Git branch names, and refs that represent the portion of your Git history obtained using GitPython.
Here's how the Python code uses Manim to create a red circle for each commit:
circle = Circle(stroke_color=commitFill, fill_color=commitFill, fill_opacity=0.25)
And here's how Manim is used to create the arrows between commits:
arrow = Arrow(start=RIGHT, end=LEFT, color=self.fontColor).next_to(circle, LEFT, buff=0)
Lastly, here's how these objects are added to an animated scene:
self.play(Create(circle), Create(arrow))
How to Install Git Story
Install GitPython:
$ pip3 install gitpythonInstall git-story:
$ pip3 install git-story
How to Use Git Story
Open a command-line terminal
Navigate to the root folder of your Git project using
cdExecute the command:
git-story
Running this command will generate an mp4 video animation from the most recent 8 commits in your Git repo. The video file will be placed within the current directory at the path ./git-story_media/videos.
How to Customize Git Story's Output
Git Story includes various ways to modify the way your Git repo is represented in the output video. You do this through command-line options and flags.
To specify the number of commits to animate, use the option --commits=X, where X is the number of commits you want to show.
You may want to start animating from a specific commit besides HEAD. You can use the --commit-id=ref option to select the commit to start working backwards from. Instead of ref, you can substitute in a full or partial commit ID, branch name, or Git tag.
You can use the --reverse flag to animate the commits from newest to oldest, that is reverse-chronological order to more closely match the Git log output.
Try out the --low-quality flag to speed up the animation generation time while testing. Once you're satisfied with the way your animation looks, remove the flag and run the command again to get a final best quality version.
If you prefer a light color scheme instead of the default dark one, you can specify the --light-mode flag.
For presentation purposes, you may want to add an intro title, logo, and outro to your animation. You can do this with the following options:
$ git-story --show-intro --title "My Git Repo" --show-outro --outro-top-text "My Git Repo" --outro-bottom-text "Thanks for watching!" --logo path/to/logo.png
Use the --media-dir=path/to/output option to set the output path of the video. This is useful if you don't want extra files to be created within your project.
Finally, you may want to test out the --invert-branches flag if your Git commit history has multiple branches. This flag will flip the order in which branches are parsed, which changes the branch orientation in the output video. Some animations will look better with this flag set and some won't.
Here is a final example showing what the generated video looks like when multiple branches exist in the input commit range:
Summary
Git Story is a command-line tool that I wrote in Python to make it easy to create video animations of your Git commit history. Dependencies include Manim and GitPython.
The output video displays the desired set of commits and their relationships, along with branch names, the HEAD commit, and tags.
Git Story has a variety of command-line flags and options that allow you to customize the animation. Run the command git-story -h for the full set of available options.
Feel free to send me an email at jacob@initialcommit.io with any comments, questions, or suggestions.
Pull requests are very welcome on the Git Story GitHub page.
Thanks for reading and happy coding!