
By Alex Nadalin
Most of the larger-scale services that we design nowadays depend, more or less, on external APIs. You’ve heard it multiple times: as soon as your codebase starts to look like a monolith, it’s time to start splitting it into smaller services that can evolve independently and aren’t strongly coupled with the monolith.
Even if you don’t really employ microservices, chances are that you already depend on external services, such as elasticsearch, Redis, or a payment gateway, and need to integrate with them via some kind of API.
What happens when those services are slow or unavailable? Well, you can’t process search queries or payments, but your app would still be working “fine” — right?
That is not always the case, and I want to run a few benchmarks to show you how a little tweak, [timeouts](https://en.wikipedia.org/wiki/Timeout_(computing), can prove beneficial when dealing with external services.
Our case
We’ve started a new Hello World! startup that, surprisingly, makes money by deploying a useless service that prints a string retrieved from another service. This is an oversimplification of a real-world scenario, but it will serve our purpose well enough.
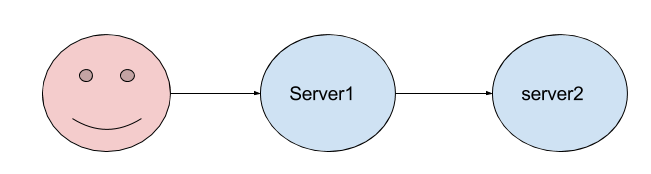
Our clients will be connecting to our main frontend, server1.js which will then make an HTTP request towards another service, server2.js which will reply back. Once we have an answer from server2.js we can then return the response body to our client.
A few things to note:
- The servers run on port
3000(main app) and3001(“backend” server). So once the client makes a request tolocalhost:3000a new HTTP request will be sent tolocalhost:3001 - The backend service will wait 100ms (this is to simulate real-world use cases) before returning a response
- I’m using the unirest HTTP client. I like it a lot and, even though we could have simply used the built-in
httpmodule, I’m confident this will give us a better feeling in terms of real-world applications - Unirest is nice enough to tell us if there was an error in our request, so we can just check
response.errorand handle the drama from there - I’m going to be using docker to run these tests, and the code is available on GitHub.
Let’s run our first tests
Let’s run our servers and start bombing server1.js with requests. We’ll be using siege (I’m too hipster for AB), which provides some useful info upon executing the load test:
siege -c 5 www.google.com** SIEGE 3.0.5** Preparing 5 concurrent users for battle.The server is now under siege...^CLifting the server siege... done.
Transactions: 26 hitsAvailability: 100.00 %Elapsed time: 6.78 secsData transferred: 0.20 MBResponse time: 0.52 secsTransaction rate: 3.83 trans/secThroughput: 0.03 MB/secConcurrency: 2.01Successful transactions: 27Failed transactions: 0Longest transaction: 1.28Shortest transaction: 0.36
The -c option, in siege, defines how many concurrent requests we should send to the server, and you can even specify how many repetitions (-r) you’d like to run. For example, -c 10 -r 5 would mean we’d be sending to the server 50 total requests, in batches of 10 concurrent requests. For the purpose of our benchmark I decided, though, to keep the tests running for three minutes and analyze the results afterward, without setting a max number of repetitions.
Additionally, in the following examples, I will be trimming down the results to the most important items provided by siege:
- Availability: how many of our requests was the server able to handle
- Transaction rate: how many requests per second we were able to make?
- Successful / failed transactions: how many requests ended up with successful / failure status codes (ie. 2xx vs 5xx)?
Let’s start by sending 500 concurrent requests to observe how the services behave.
docker run --net host -v $(pwd):/src -d mhart/alpine-node:7.1 node /src/server1.jsdocker run --net host -v $(pwd):/src -d mhart/alpine-node:7.1 node /src/server2.js
siege -c 500 127.0.0.1:3000
After around three minutes, it’s time to stop the siege (ctrl+c) and see how the results look:
Availability: 100.00 %Transaction rate: 1156.89 trans/secSuccessful transactions: 205382Failed transactions: 0
Not bad, as we’ve been able to serve 1156 transactions per second. Even better than that, it doesn’t seem like we’ve got any error, which means our success rate is 100%. What if we up our game and go for 1k concurrent transactions?
siege -c 1000 127.0.0.1:3000...
Availability: 100.00 %Transaction rate: 1283.61 trans/secSuccessful transactions: 232141Failed transactions: 0
Well done! We slightly increased throughput, as now our app is able to handle 1283 requests per second. Since the apps do very few (print a string and that’s it) it is likely that the more concurrent requests we’ll send the higher the throughput.
These numbers might be useless now (we’re not comparing them to anything), but will prove essential in the next paragraphs.
Introducing failure
This is not how real-world webservices behave: you have to accept failures and build resilient applications that are capable of overcoming them.
For example, suppose our backend service is going through a hard phase and starts lagging every now and then:
In this example, 1 out of 10 requests will be served after a timeout of 10s has passed, whereas the other ones will be processed with the “standard” delay of 100ms. This kind of simulates a scenario where we have multiple servers behind a load balancer, and one of them starts throwing random errors or becomes slower due to excessive load.
Let’s go back to our benchmark and see how our server1.js performs now that its dependency will start to slow down:
siege -c 1000 127.0.0.1:3000
Availability: 100.00 %Transaction rate: 853.93 trans/secSuccessful transactions: 154374Failed transactions: 0
What a bummer: our transaction rate has plummeted, down by more than 30%, just because some of the responses are lagging. This means that server1.js needs to hold on for longer in order to receive responses from server2.js, thus using more resources and being able to serve fewer requests than it theoretically can.
An error now is better than a response tomorrow
The case for timeouts starts by recognizing one simple fact: users won’t wait for slow responses.
After 1 or 2 seconds, their attention will fade away and the chances that they might still be hooked to your content will vanish as soon as you cross the 4/5s threshold. This means that it’s generally better to give them an immediate feedback, even if negative (“An error occurred, please try again”), rather than letting them get frustrated over how slow your service is.
In the spirit of “fail fast,” we decided to add a timeout in order to make sure that our responses meet a certain SLA. In this case, we decided that our SLA is 3s, which is the time our users will possibly wait to use our service.
...
require('unirest').get('http://localhost:3001').timeout(3000).end(function(r) {
...
Let’s see how the numbers look with timeouts enabled:
Availability: 90.14 %Transaction rate: 1125.26 trans/secSuccessful transactions: 209861Failed transactions: 22964
Oh boy, we’re back in the game. The transaction rate is again higher than 1k per second, and we can almost serve as many requests as we’d do under ideal conditions (when there’s no lag in the backend service).
Of course, one of the drawbacks is that we have now increased the number of failures (10% of total requests), which means that some users will be presented an error page. This is still better, though, than serving them after 10s, as most of them would have abandoned our service anyway.
We’ve now seen that, ideally, timeouts help you preserve near-ideal rps (requests per second), but what about resource consumption? Will they be better at making sure that our servers won’t require extra resources if one of their dependencies becomes less responsive?
Let’s dig into it.
The RAM factor
In order to figure out how much memory our server1.js is consuming, we need to measure, at intervals, the amount of memory the server is using. In production, we would use tools such as NewRelic or KeyMetrics but, for our simple scripts, we’ll resort to the poor man’s version of such tools. We’ll be printing the amount of memory from server1.js and we’ll use another script to record the output and print some simple stats.
Let’s make sure server1.js prints the amount of memory used every 100ms:
...
setInterval(_ => { console.log(process.memoryUsage().heapUsed / 1000000)}, 100)
...
If we start the server, we should see something like:
3.9901764.0667524.0760244.0777844.0795444.0813044.0830644.084824
which is the amount of memory, in MB, that the server is using. In order to crunch the numbers, I wrote a simple script that reads the input from the stdin and computes the stats:
The module is public and available on NPM, so we can just install it globally and redirect the output of the server to it:
docker run --net host -v $(pwd):/src -ti mhart/alpine-node:7.1 shnpm install -g number-aggregator-statsnode /src/server1.js | number-aggregator-stats
Meas: 18 Min: 3 Max: 4 Avg: 4 Cur: 4
Let’s now run our benchmark again — 3 minutes, 1k concurrent requests, no timeouts:
node /src/server1.js | number-aggregator-stats
Meas: 1745 Min: 3 Max: 349 Avg: 194 Cur: 232
And now let’s enable the 3s timeout:
node /src/server1.js | number-aggregator-stats
Meas: 1429 Min: 3 Max: 411 Avg: 205 Cur: 172
Whoa, at first look it seems like timeouts aren’t helping after all: our memory usage hits a high with timeouts enabled and is, on average, 5% higher as well. Is there any reasonable explanation for that?
There is, of course, as we just need to go back to siege and look at the rps:
853.60 trans/sec --> without timeouts1134.48 trans/sec --> with timeouts
Here we’re comparing apples to oranges. It’s useless to look at the memory usage of two servers that are serving a different number of rps. We should instead make sure they are both offering the same throughput, and only measure the memory at that point. Otherwise the server that’s serving more requests will always start with some disadvantage!
To do so, we need some kind of tool that makes it easy to generate rps-based loads, and siege is not very suitable for that. It’s time to call our friend vegeta, a modern load testing tool written in Golang.
Enter vegeta

Vegeta is very simple to use, just start “attacking” a server and let it report the results:
echo "GET http://google.com" | vegeta attack --duration 1h -rate 1000 | tee results.bin | vegeta report
Two very interesting options here:
--duration, so that vegeta will stop after a certain time--rate, as in rps
Looks like vegeta is the right tool for us — we can then issue a command tailored to our server and see the results:
echo "GET http://localhost:3000" | vegeta attack --duration 3m --insecure -rate 1000 | tee results.bin | vegeta report
This is what vegeta outputs without timeouts:
Requests [total, rate] 180000, 1000.01Duration [total, attack, wait] 3m10.062132905s, 2m59.998999675s, 10.06313323sLatencies [mean, 50, 95, 99, max] 1.172619756s, 170.947889ms, 10.062145485s, 10.134037994s, 10.766903205sBytes In [total, mean] 1080000, 6.00Bytes Out [total, mean] 0, 0.00Success [ratio] 100.00%Status Codes [code:count] 200:180000Error Set:
and this is what we get when server1.js has the 3s timeout enabled:
Requests [total, rate] 180000, 1000.01Duration [total, attack, wait] 3m3.028009507s, 2m59.998999479s, 3.029010028sLatencies [mean, 50, 95, 99, max] 455.780741ms, 162.876833ms, 3.047947339s, 3.070030628s, 3.669993753sBytes In [total, mean] 1142472, 6.35Bytes Out [total, mean] 0, 0.00Success [ratio] 90.00%Status Codes [code:count] 500:18000 200:162000Error Set:500 Internal Server Error
As you see, the total number of requests and elapsed time is the same between the two benchmarks, meaning that we’ve put the servers under the same level of stress. Now that we’ve gotten them to perform the same tasks, under the same load, we can look at memory usage to see if timeouts helped us keep a lower memory footprint.
Without timeouts:
node /src/server1.js | number-aggregator-stats
Meas: 1818 Min: 3 Max: 372 Avg: 212 Cur: 274
and with timeouts:
node /src/server1.js | number-aggregator-stats
Meas: 1886 Min: 3 Max: 299 Avg: 149 Cur: 292
This looks more like it: timeouts have helped us keep the memory usage, on average, 30% lower.
All of this thanks to a simple .timeout(3000) . What a win!
Avoiding the domino effect
Quoting myself:
What happens when those services are slow or unavailable? Well, you can’t process search queries or payments, but your app would still be working “fine” — right?
Fun fact: a missing timeout can cripple your entire infrastructure!

In our basic example, we saw how a service that starts to fail at a 10% rate can significantly increase the memory usage of the services depending on it. That’s not an unrealistic scenario — it’s basically just a single, wonky server in a pool of ten.
Imagine you have a webpage that relies on a backend service, behind a load balancer, that starts to perform slower than usual. The service still works (it’s just way slower than it should), your health check is probably still getting a 200 Ok from the service (even though it comes after several seconds rather than milliseconds), so the service won’t be removed from the load balancer.
You’ve just created a trap for your frontends. They will start requiring more memory, serve fewer requests and…it’s a recipe for disaster.
This is what a domino effect looks like: a system slows down (or incurs in downtime) and other pieces in the architecture are affected by it, highlighting a design that didn’t consider failure an option and is neither robust nor resilient enough.
The key thing to keep in mind is this: embrace failures, let them come, and make sure you can fight them with ease.
A note on timeouts
If you thought waiting is dangerous, let’s add to the fire:
- We’re not talking HTTP only — everytime we rely on an external system, we should use timeouts
- A server could have an open port and drop every packet you send — this will result in a TCP connection timeout. Try this in your terminal:
time curl example.com:81. Good luck! - A server could reply instantly, but be very slow at sending each packet (as in, seconds between packets). You would then need to protect yourself against a read timeout.
…and many more edge cases to list. I know, distributed systems are nasty.
Luckily, high-level APIs (like the one exposed by unirest) are generally helpful, since they take care of all of the hiccups that might happen on the way.
Closing remarks: I’ve broken every single benchmarking rule
If you have any “aggressive” feedback about my rusty benchmarking skills…well, I would agree with you. I purposely took some shortcuts for the sake of simplifying my job and the ability, for you, to easily reproduce these benchmarks.
Things you should do if you’re serious about benchmarks:
- Do not run the code you’re benchmarking and the tool you use to benchmark on the same machine. Here I ran everything on my XPS which is powerful enough to let me run these tests. But running siege / vegeta on the same machine the servers run on definitely has an impact on the results (I say
ulimitand you figure out the rest). My advice is to try to get some hardware on AWS and benchmark from there — more isolation, fewer doubts. - Do not measure memory by logging it out with a
console.log, instead use a tool such as NewRelic which, I think, is less invasive. - Measure more data: benchmarking for three minutes is ok for the sake of this post, but if we want to look at real-world data, to give a better estimate of how helpful timeouts are, you should leave the benchmarks running for way longer.
- Keep Gmail closed while you run
siege ..., the tenants living in/proc/cpuinfowill be grateful.
And…I’m done for the day: I hope you enjoyed this post and if otherwise, feel free to rant in the comment box below!
_Originally published at odino.org (19 January 2017)._