
As a web developer, there are many tools out there – in addition to your code editor – that can make you more efficient.
It doesn't matter if you're just starting out or have been coding for years. Knowing how to effectively use Developer Tools (DevTools for short) can significantly boost your development process. You can edit pages on the fly, quickly spot issues, and deeply understand your site's performance.
All major browsers have their own DevTools that let you examine the code of a webpage, evaluate its metrics, and run some tests alongside. This article will discuss Chrome's DevTools, as it's the industry standard.
Table of contents:
- What is Chrome DevTools?
- How to Open Chrome DevTools
- Keyboard shortcuts for Easy Navigation
- Key Chrome DevTools Features
- Practical DevTools Use Cases
- Conclusion
What is Chrome DevTools?
Chrome DevTools is a set of tools that are essential for diagnosing and solving web development challenges, directly within the Google Chrome browser.
It gives you direct access to a website's inner workings - to inspect HTML and CSS, debug JavaScript, analyze performance, and see the immediate impact of your code, all in realtime.
This direct access to a website's inner workings is crucial for diagnosing issues quickly and efficiently, ensuring your web applications are both performant and bug-free.
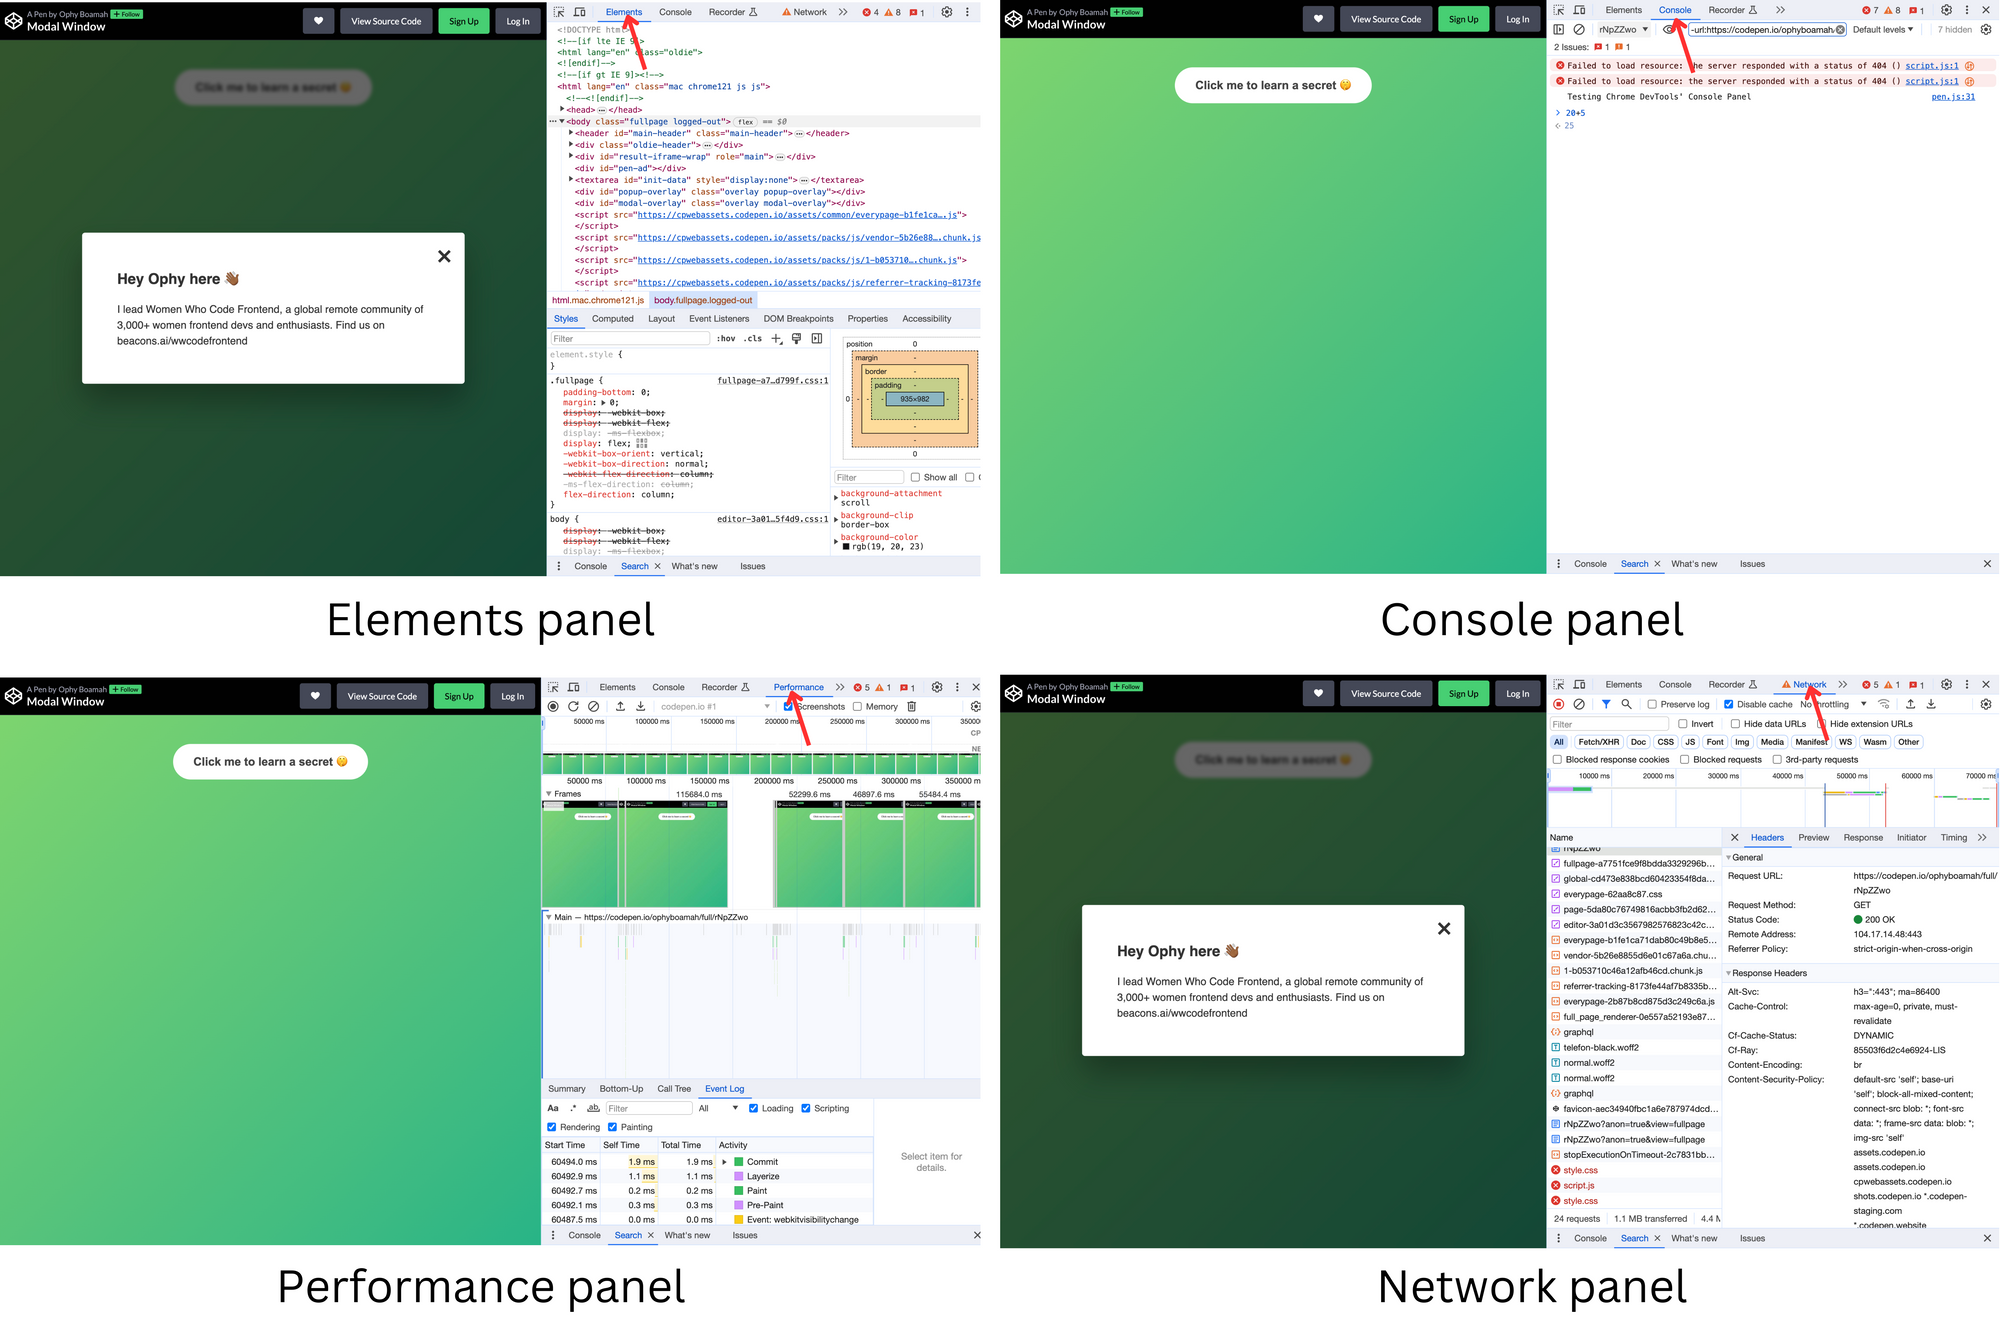 A grid of elements, console, performance and network panels screenshots
How to Open Chrome DevTools
To open DevTools in your Chrome browser, you can either:
- Right-click on any webpage and select inspect from the list of options.
- Use the shortcut (command + option + I on Mac or control + shift + I on Windows).
- Click the three dot icon next to your profile picture on your Chrome browser, choose 'More Tools' and 'Developer Tools' from the second option box.
It usually opens in a split screen interface, either below your current webpage or beside it. Once open, its features line up as tabs at the top of the DevTools window. These tabs include: Elements, Console, Source, Network, Application, Security, Memory, Performance, Audits.
Keyboard Shortcuts for Easy Navigation
- Use Cmd or Ctrl + Shift + C to open the Elements panel
- Use Cmd or Ctrl + Shift + J to open the Console panel
- Use Cmd or Ctrl + ] to move forward to the next panel
- Use Cmd or Ctrl + [ to move back to the previous panel
Key Chrome DevTools Features
DevTools is packed with features essential for web developers to streamline various aspects of their workflow. Let's look at a few of them in some detail now.
Elements Panel
This panel is used for inspecting and modifying the HTML and CSS of a webpage in real-time, which is great for debugging layout issues or experimenting with new styles before applying them in your actual code. You also get to see how the DOM (Document Object Model) is structured.
Imagine fine-tuning your website's footer appearance (background color, font size) directly in your browser and seeing the results instantly.
With DevTools open, click on the Elements tab to access it.
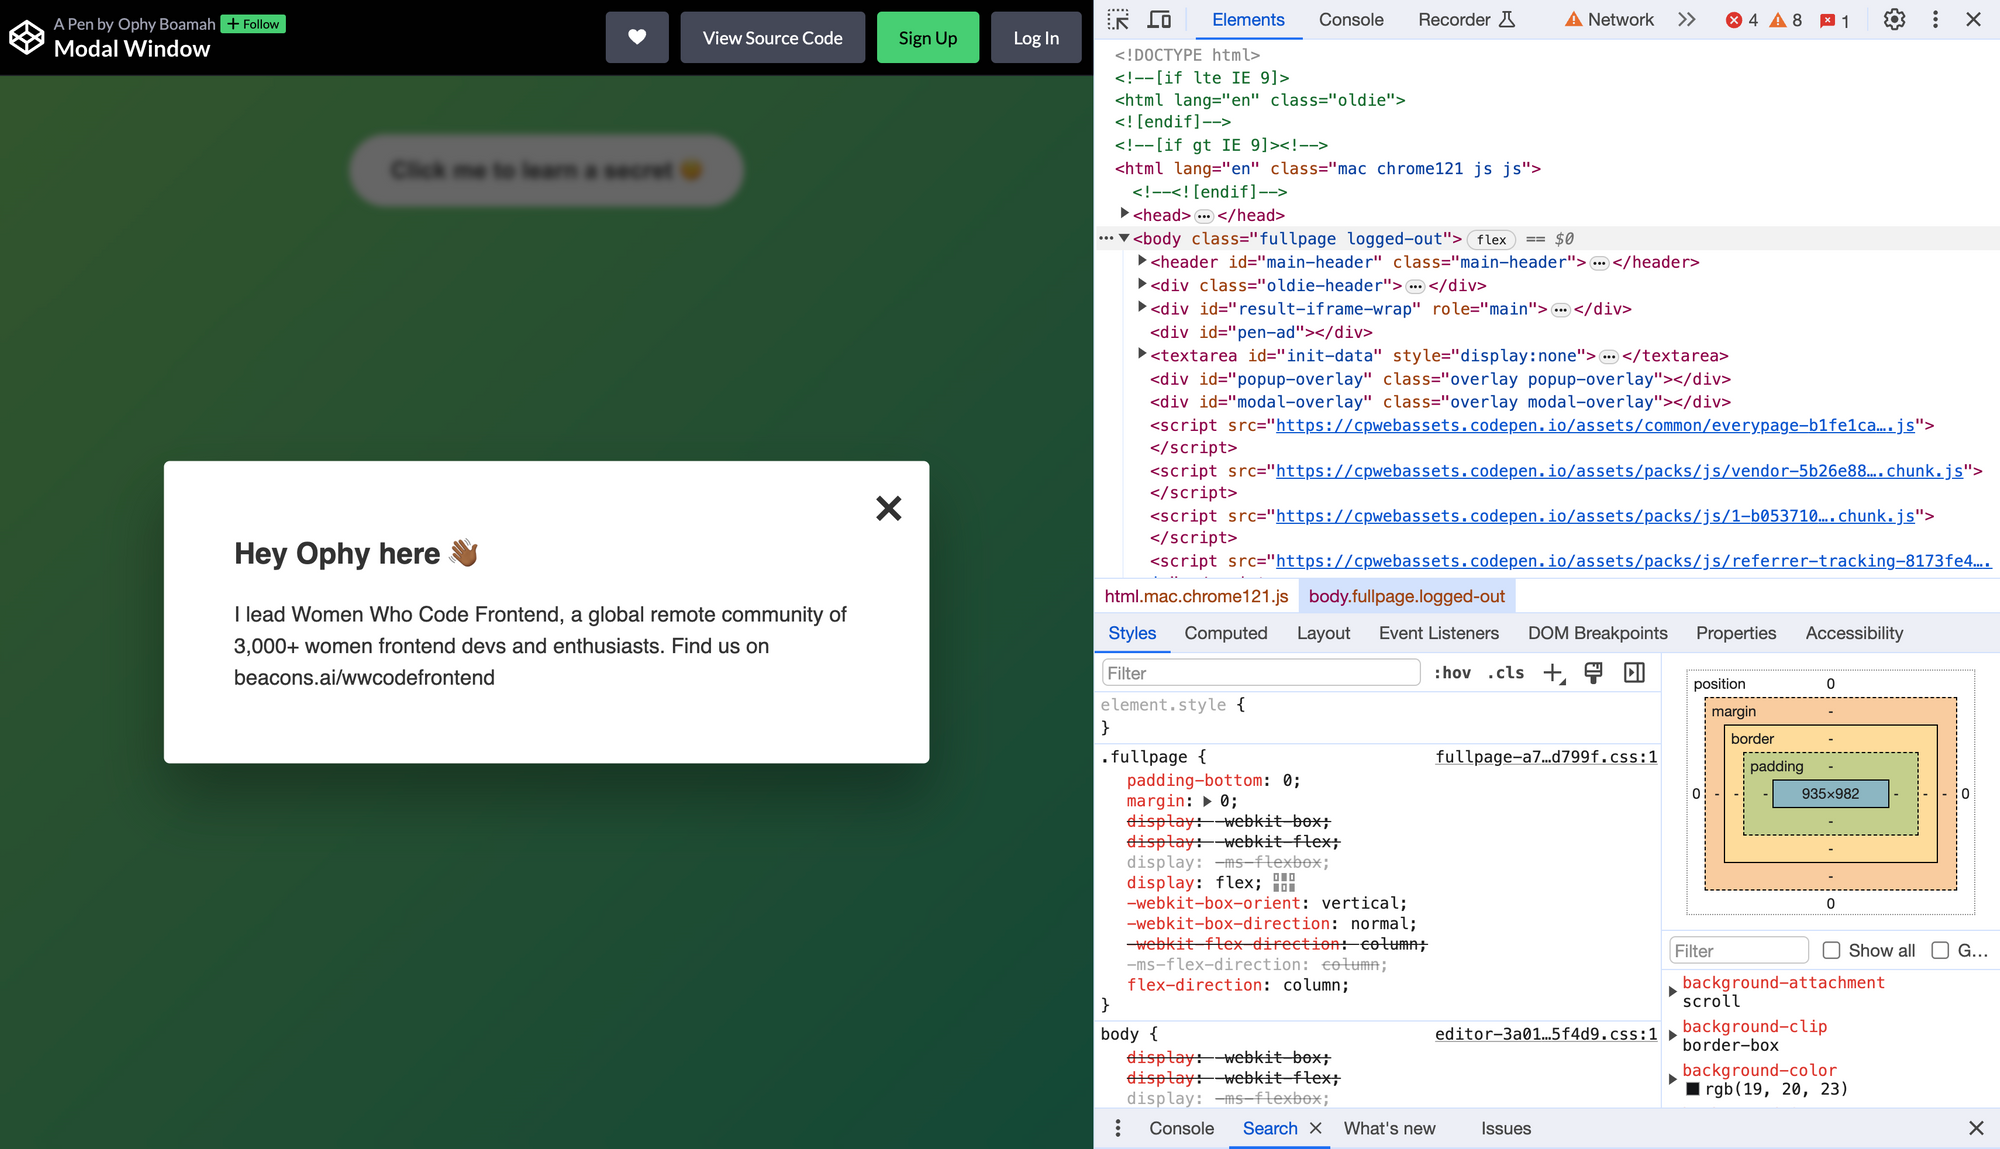 A screenshot of Chrome DevTools' Elements panel
Console Panel
This panel serves as your interactive playground for JavaScript within the browser. Whether you're tracking down an elusive bug with a quick console.log() or experimenting with DOM elements, in the Console panel you can test snippets of JavaScript and view any logs or errors in the currently loaded webpage.
To use it, simply open DevTools and select the "Console" tab or use the shortcut (option + command + J on Mac or contrl + shift + J on Windows).
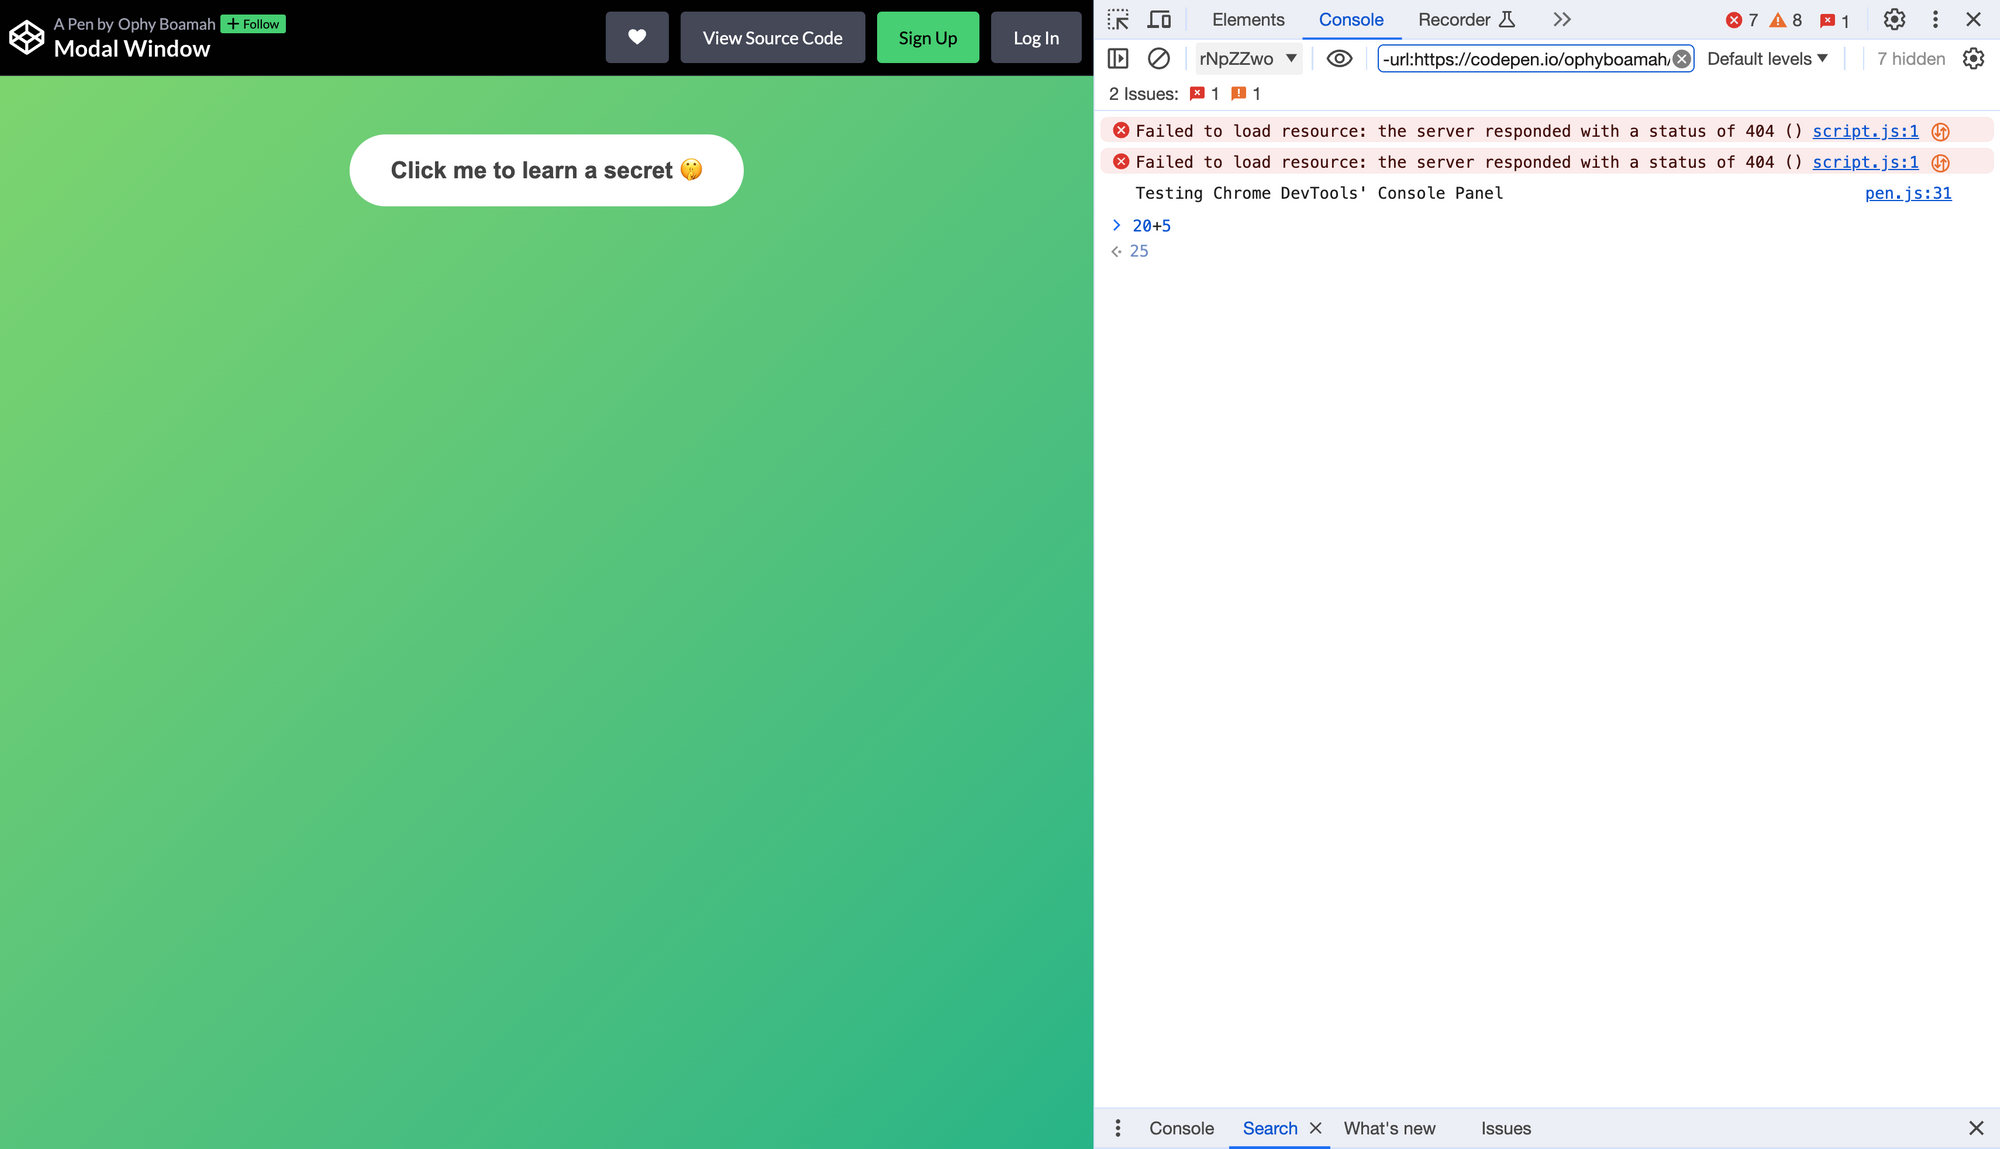 A screenshot of Chrome DevTools' Console panel
Network Panel
This panel gives you an overview of all network activity on your webpage – from tracking every resource that is loaded to how your site communicates with servers.
If you've wondered why your website takes forever to load or why some API requests seem to vanish into thin air, the Network panel is your go-to as it provides insights into the success or failure of API calls.
To access it, open DevTools and navigate to the "Network" tab.
 A screenshot of Chrome DevTools' Network panel
Performance Panel
This panel is used for capturing and analyzing a website's performance metrics. It shows all the activities happening when interacting with a page.
When your web app starts to crawl under heavy usage, the Performance panel can pinpoint where the performance bottlenecks lie so that you can resolve these issues, ensuring your app runs smoothly.
With DevTools open, click on the "Performance" tab to use it.
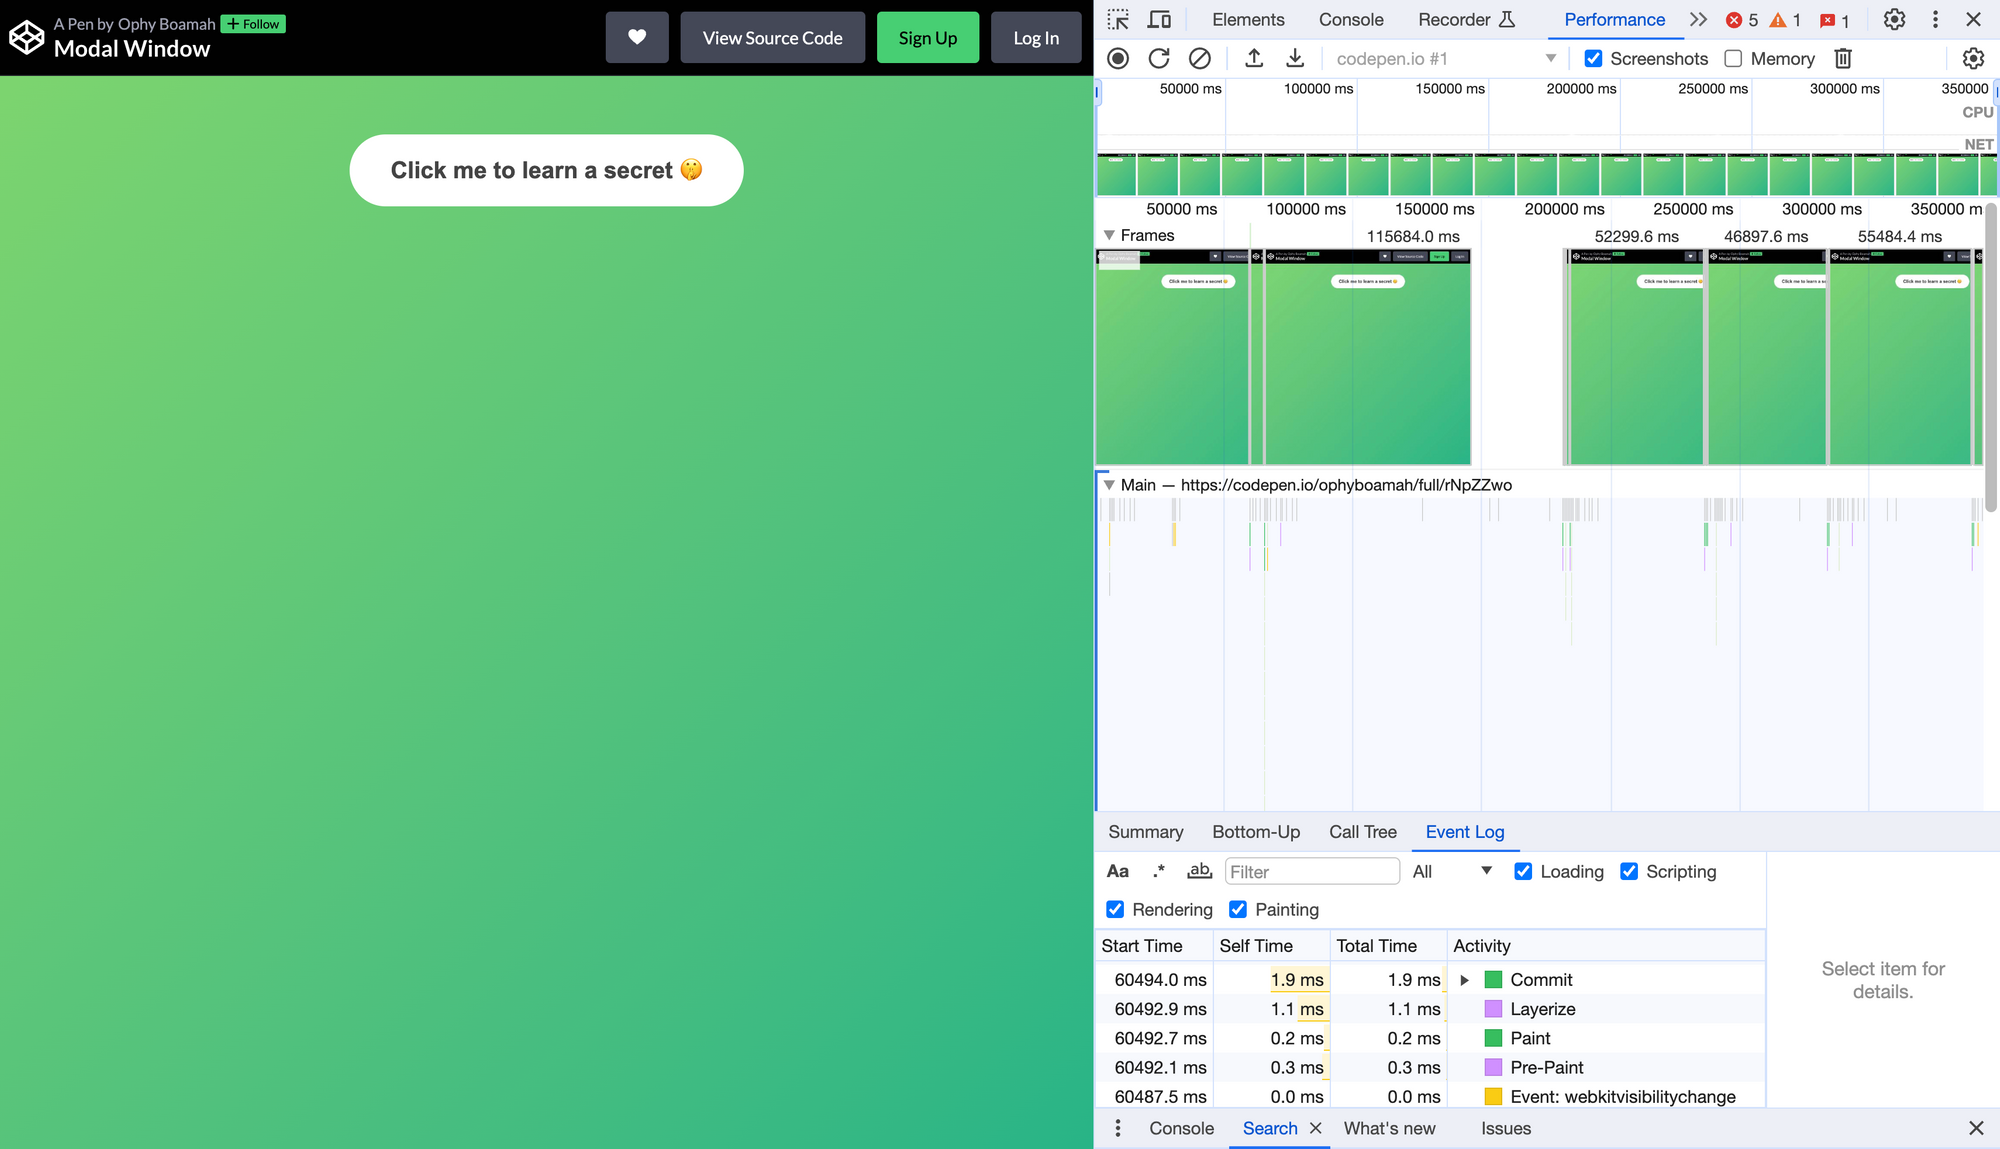 A screenshot of Chrome DevTools' Performance panel
The above are only a handful of the panels available, but they're by far the most popular and must-knows. Using them properly will make your development processes more intuitive and rewarding.
Practical DevTools Use Cases
In the following interactive examples, I intentionally created the mini project in Codepen with issues to simulate real-world debugging scenarios using Chrome DevTools.
I figured it'd be a great way to highlight the practical uses of certain DevTools panels and features in identifying bugs and troubleshooting right in the browser.
Prerequisites
- Chrome browser (Click this link to download)
- A basic understanding of HTML, CSS, and JavaScript
- Codepen
See the Pen Modal Window by Ophy Boamah (@ophyboamah) on CodePen.
How to Debug HTML and CSS with the Elements Panel
Our mini project contains a modal that, upon clicking, should display a modal window with some important information. But there's a bug preventing this from happening.
This situation sets the stage for a practical demonstration of how you can use the Elements Panel to troubleshoot and resolve styling and structural issues.
<body>
<button class="show-modal">Click me to learn a secret 🤫</button>
<div class="modal hidden">
<button class="close-modal">×</button>
<h1>Hey Ophy here 👋🏾</h1>
<p>
I lead Women Who Code Frontend, a global remote community of 3,000+ women frontend devs and enthusiasts. Find us on beacons.ai/wwcodefrontend
</p>
</div>
<div class="overlay hidden"></div>
<script src="script.js"></script>
</body>
.hidden {
  display: none;
}

.modal {
  position: absolute;
  left: 50%;
  transform: translate(-50%);
  width: 70%;

  background-color: white;
  padding: 6rem;
  border-radius: 5px;
  box-shadow: 0 3rem 5rem rgba(0, 0, 0, 0.3);
  z-index: 10;
}
In our modal's HTML code above, we've added the class name 'modal hidden' which has a corresponding styling with the CSS property of display:none that is set to hide the modal when the page is loaded initially and only display it when the button is clicked.
✅ Step 1 - Initial inspection:
Attempt to trigger the modal by clicking on the 'Click me to learn a secret' button. Since we've set that up not to work, right-click on the area where the modal should appear and choose "Inspect" to open DevTools' Elements Panel.
✅ Step 2 - Diagnose visibility issues:
In the Elements Panel, locate the modal in the DOM to see that the modal is present but not visible. This confirms that the bug is caused within our CSS code display: hidden.
As soon as you click on the modal in the DOM, any corresponding CSS classes will be pulled up within Styles at the bottom section of the Elements panel. You can toggle some properties on and off or type others to see the effects in real-time.
Manually change the class name from modal hidden to modal block to trigger the right properties that'll cause the modal to show.
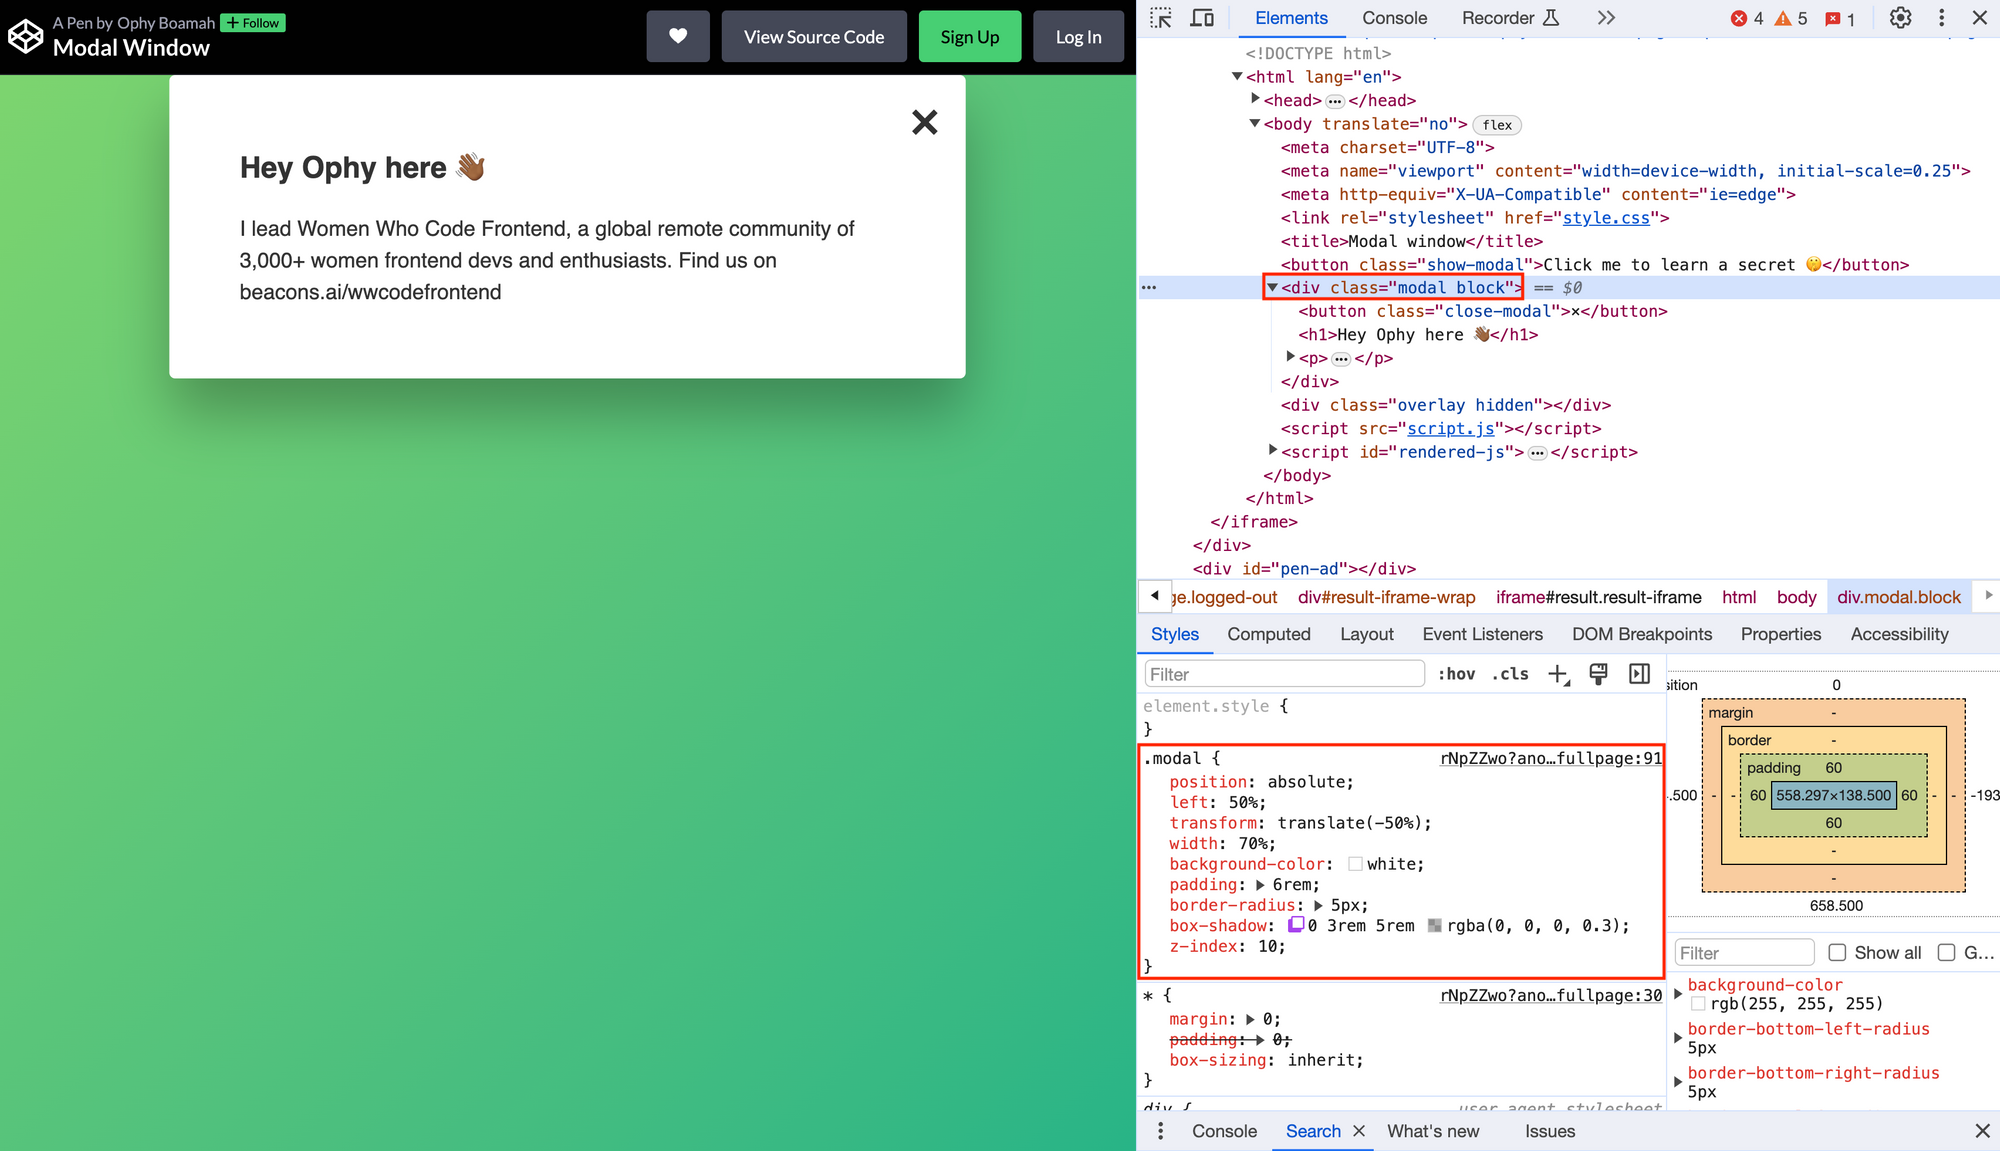 A screenshot of debugging the modal's HTML, CSS in Elements panel
✅ Step 3 - Center the modal:
Now the modal is visible, but it's displayed at the top – which is different from where we'd like it to be (that is, in the center of the page).
To change this, modify the transform property to translate(-50%, -50%) by adding the second -50% and ensure that top: 50%, and left: 50% are correctly set to center the modal on the screen.
✅ Step 4 - Enhance the appearance:
You can go further to refine the modal's appearance by tweaking its background-color, padding, or other stylistic properties directly within the Styles to achieve the desired look and feel.
 A GIF fixing the modal in Chrome DevTools' Elements panel
Debug JavaScript with the Sources Panel
I added a bug in the JavaScript code of our modal mini project to prevent it from opening when the button is clicked.
In the real world, this would cause neither the open nor close commands to trigger any action, which would leave users unable to interact with the content and frustrated as a result. Let's troubleshoot and debug this issue in the Sources Panel.
In the code below, the openModal function is set to remove the indicated classes. However, this doesn't work because we deliberately misspelled hidden.
// Introducing a bug: Incorrectly spelling 'hidden' as 'hiddn'
const openModal = function () {
  modal.classList.remove("hiddn"); // Intentional bug
  overlay.classList.remove("hidden");

  // Fetch data from a real API and display in the modal
};
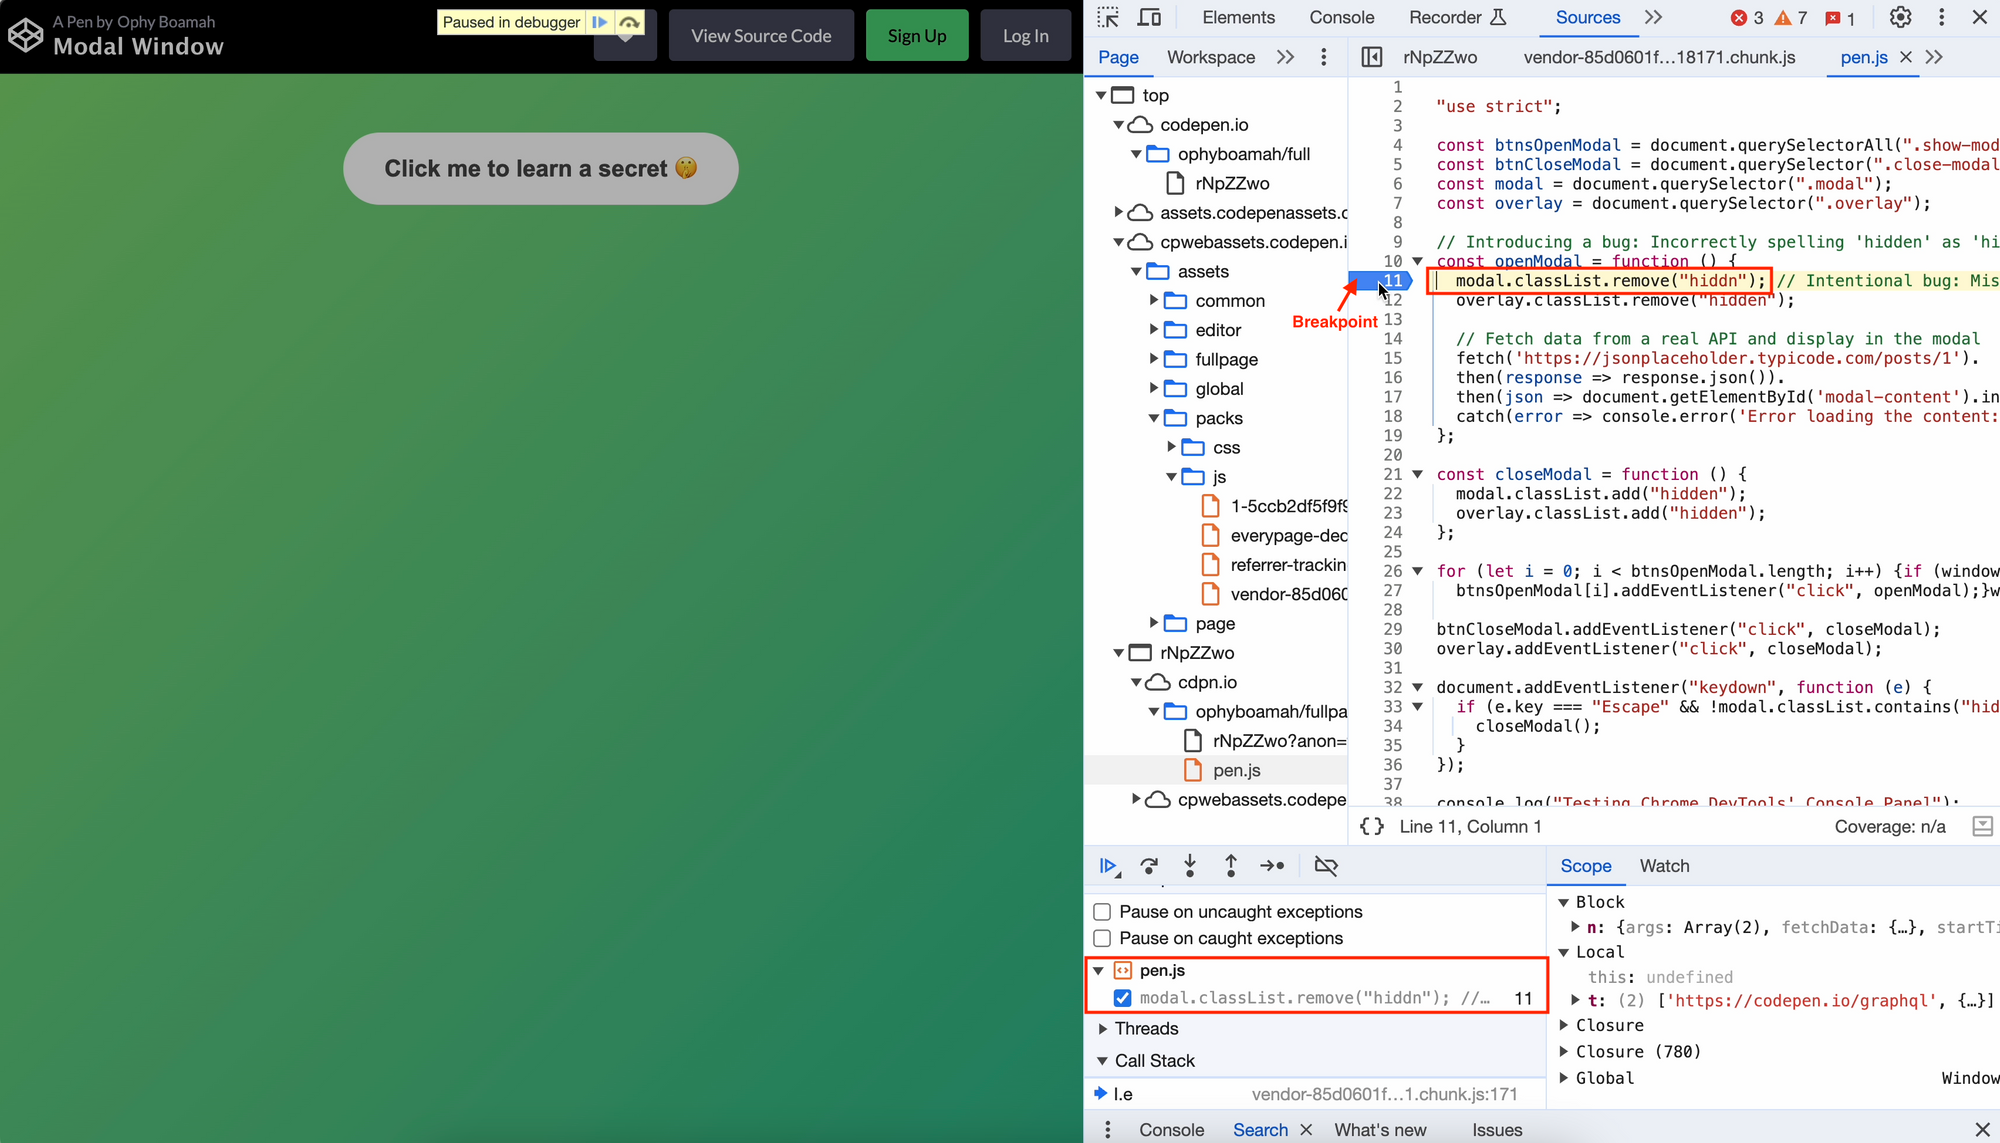
✅ Step 1 - Set up breakpoints:
Open Chrome DevTools and navigate to the Sources Panel. Here, find the JavaScript file that includes the modal functionality (in our example its pen.js).
The openModal function contains the logic for displaying the modal on the screen. This function will include a line where the modal element's class is manipulated to remove a "hidden" class.
Click on the number next to this code line in DevTools. A blue (or sometimes red, depending on the theme) icon appears next to the line number, indicating that a breakpoint has been set. This breakpoint will pause the execution of our JavaScript code as soon as it reaches this line.
 A screenshot of setting breakpoints the modal's JS in Sources panel
Breakpoints pause code execution at critical points, allowing you to inspect the current state of variables and understand the flow of execution. This step is crucial for identifying where the code deviates from expected behaviour.
✅ Step 2 - Examine the code execution flow:
With our breakpoint in place, try to open the modal by clicking on its button. Execution of our JavaScript code now pauses at our breakpoint, which enables us to step through the code line by line.
This is an opportunity to observe variables, function calls, look for anomalies such as misnamed functions, incorrect logic, or uncaught exceptions that could explain why the modal isn't working.
In our case it's because we intentionally misspelled the class name hidden as hiddn. Fix that in the code to get the modal working again.
 A GIF troubleshooting the modal bug in Chrome DevTools' Elements panel
Optimize Performance with the Network Panel
Here I've added a fetch function that makes an API call to a live endpoint (https://jsonplaceholder.typicode.com/posts/1). This is an excellent opportunity to explore the Network Panel's capabilities in diagnosing and understanding network-related problems.
From the code below, you can see that the openModal function doesn't only open the modal but also makes an API call to the jsonplaceholder endpoint to fetch some data.
const openModal = function () {
  fetch('https://jsonplaceholder.typicode.com/posts/1')
    .then(response => response.json())
    .then(json => document.getElementById('modal-content').innerText = json.title)
    .catch(error => console.error('Error loading the content:', error));
};
✅ Step 1 - Initiate the API call:
On the modal project UI, click on the 'Click me to learn a secret' button. Though the modal does not visibly activate, because of the fetch logic within the openModal function, an API call will be made.
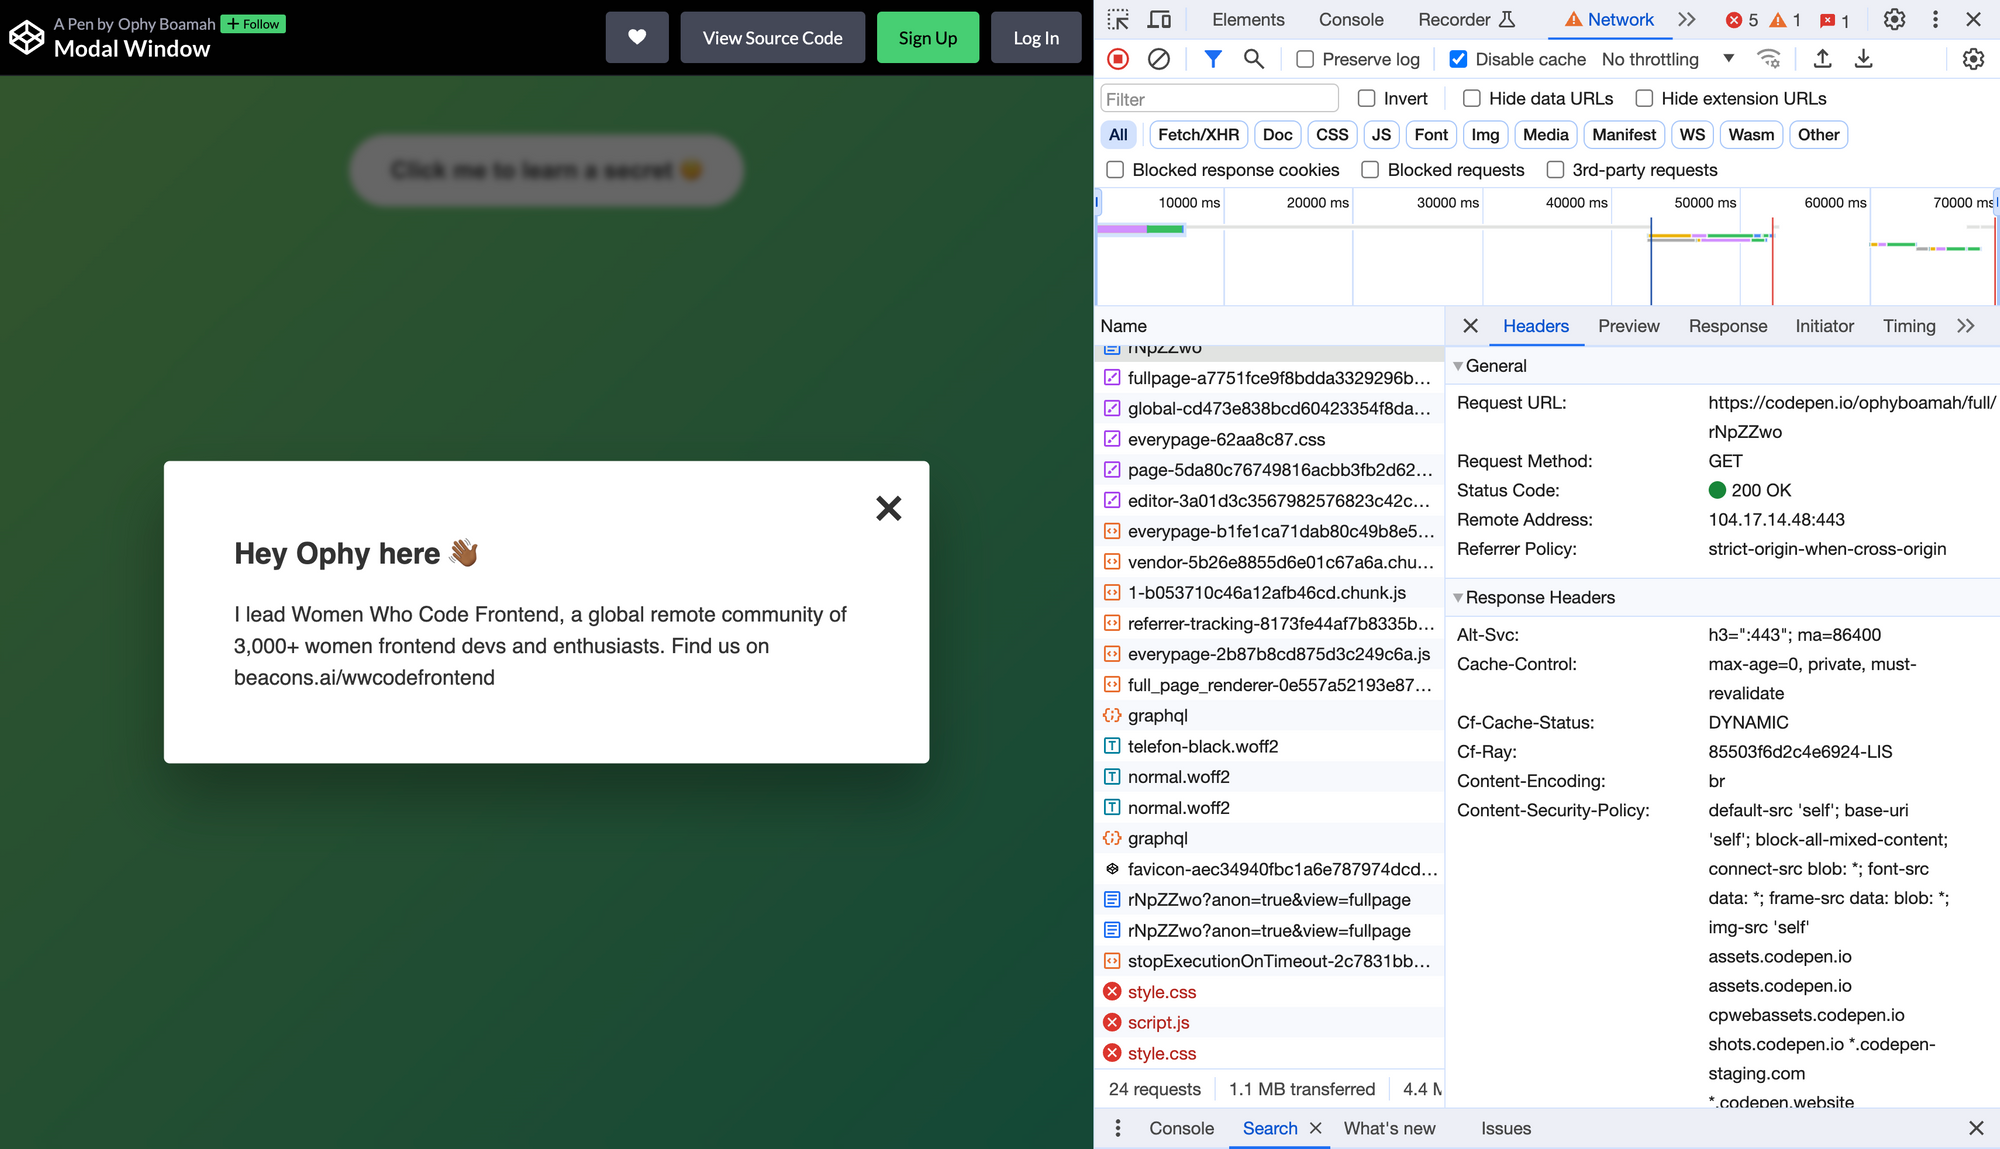
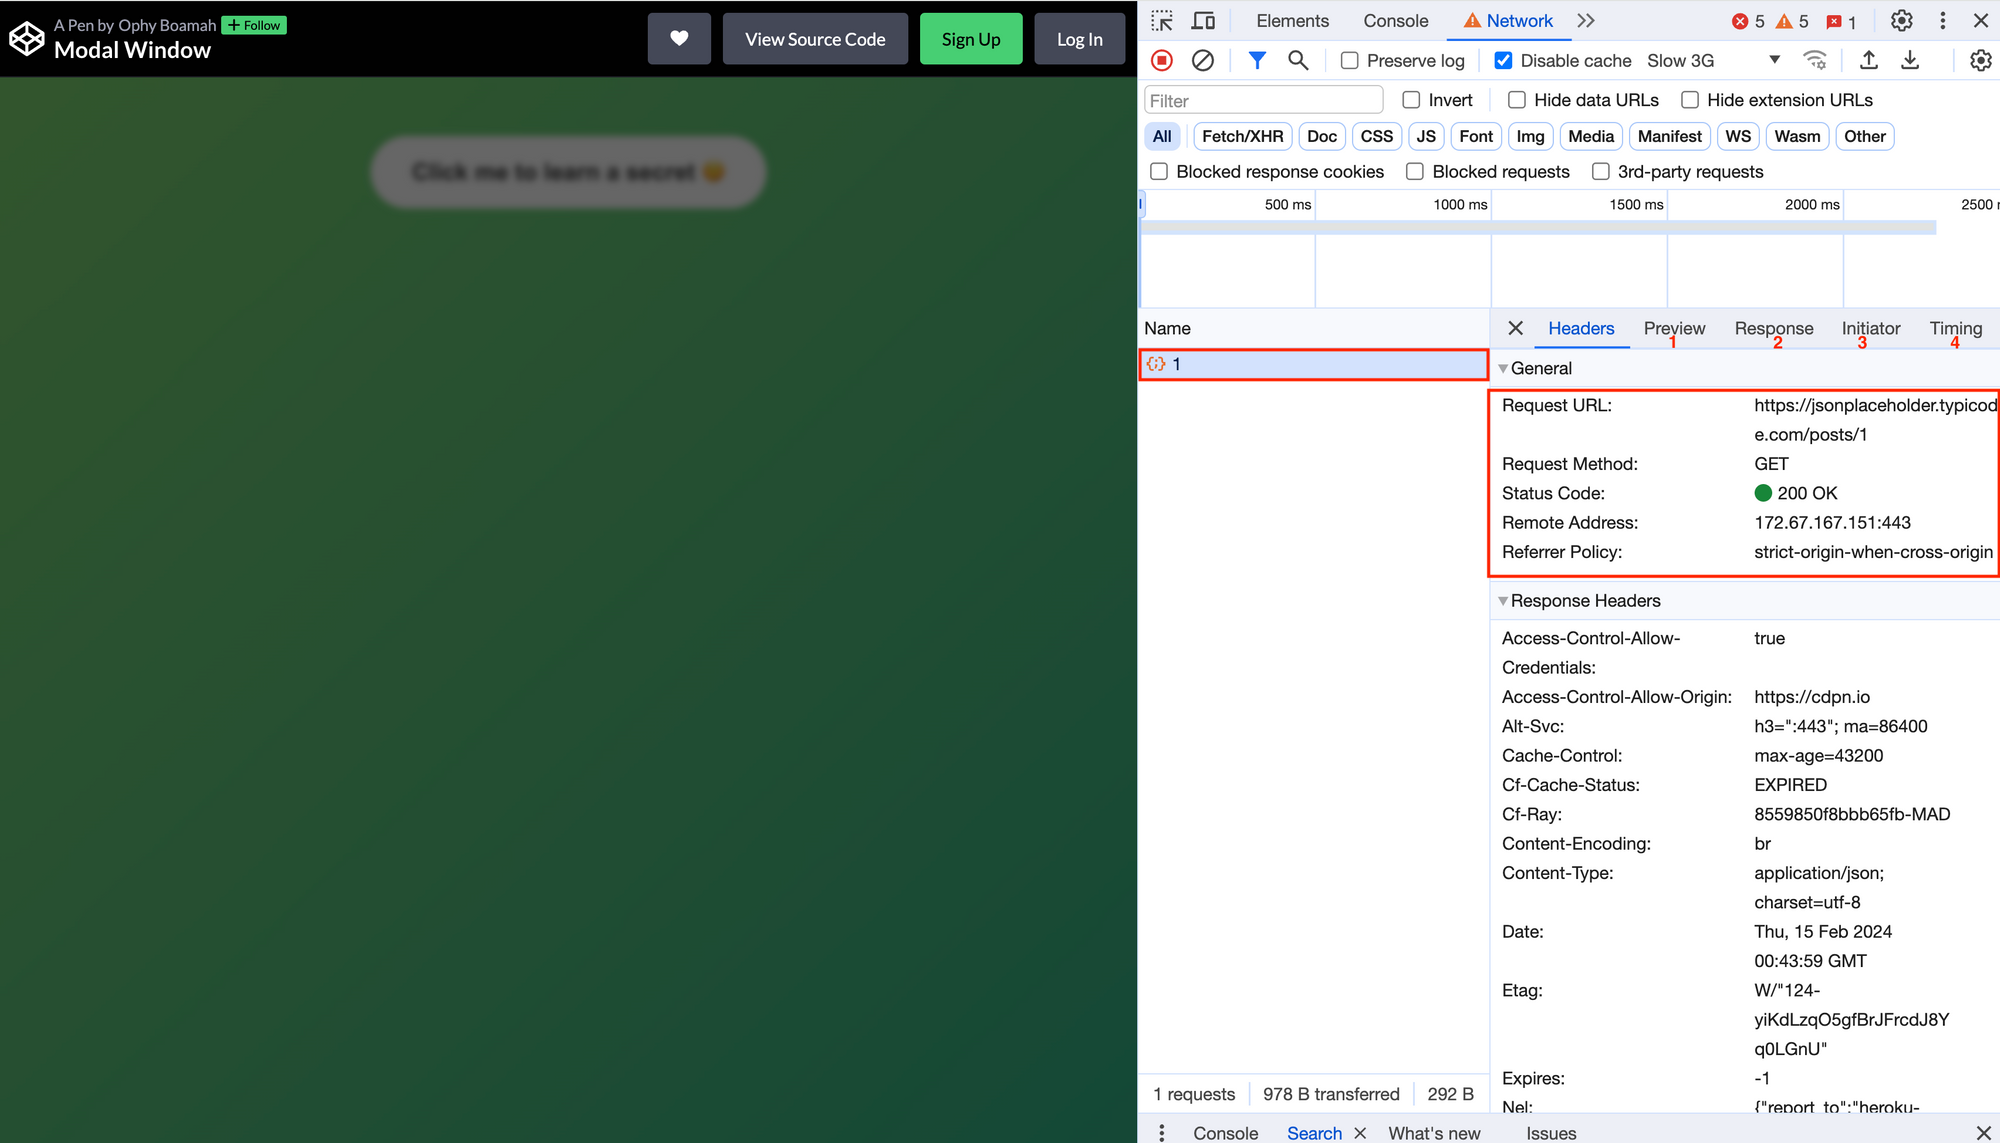
✅ Step 2 - Network Panel Inspection:
Ideally, your Network Panel should be open before clicking the button, but you can also reverse the steps. Detailed insights on your API request such as the request's method, status code, response and the time it took to complete, will be available under headers, preview, response, initiator and timing tabs respectively.
 A screenshot overview of API request in Network panel
✅ Step 3 - Simulating Network Conditions:
Use the Network Panel's throttling feature to mimic various network speeds like offline or slow 3G to see how the API request behaves under constrained conditions.
From this you can compare how different network speeds can affect application performance. This will teach you the importance of optimizing data loading strategies to enhance user experience, especially on slower connections.
 A GIF observing API requests and responses in Chrome DevTools' Network panel
Conclusion
Bringing Chrome DevTools into your web development routine is not just about fixing bugs. It's about streamlining your workflow, making your sites more accessible, and boosting their performance.
Through our modal window mini-project, we've seen firsthand how DevTools can address a wide array of development challenges, but that’s merely scratching the surface of what it can do.
As you continue to explore its capabilities and familiarize yourself with its features, you'll find it's an invaluable companion on your web development journey – designed to make your development process not just faster, but also more rewarding.