

In this article I will show you how to use Automated Machine Learning (AutoML) to build a classifier for tabular data. And don't worry – I will explain all strange definitions :)
There won't be any math in this article (although I like math, it is concise). I will try to show things in such way that you can better understand Machine Learning (and AutoML).
First things first: what is Machine Learning?
Machine Learning (ML) is a very broad topic. We can use its definition to explain what it is: teaching a machine to do a task. This is very similar to programming!
The key difference is that in programming, you need to provide an exact recipe (code) that tells the machine how it should perform. In Machine Learning you also provide the code, but that code will tell the machine how to learn based on previous examples (historical data).
This code is then used to create a Machine Learning model. All future actions done by the machine will be computed by the model.
This is a very loose definition, but you should get a basic understanding about ML from it. I've prepared some schematic pictures showing how programming vs Machine Learning works. I hope they will help you to visualize the difference.
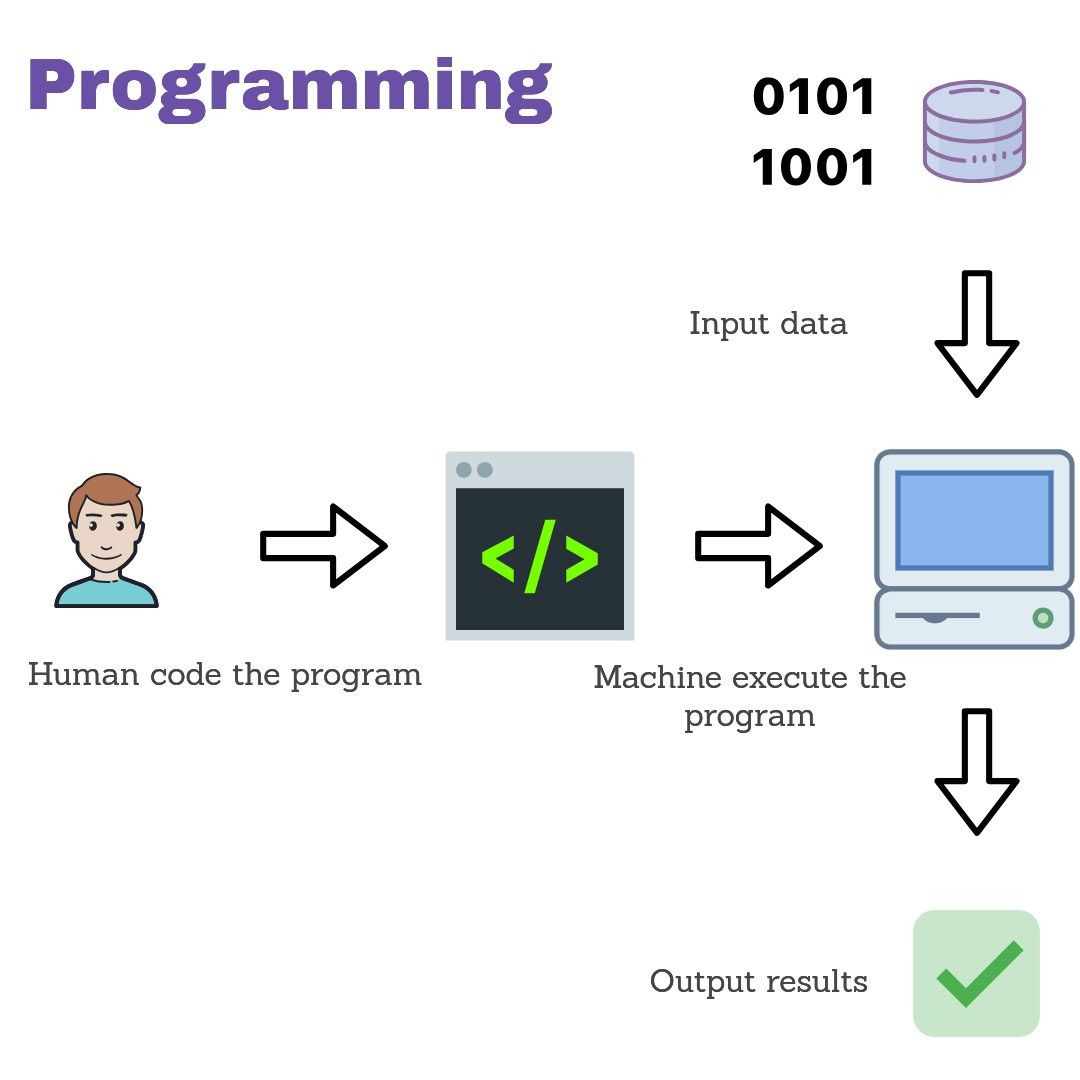
In programming, humans need to provide exact steps (code) to tell a machine how it should process input data.
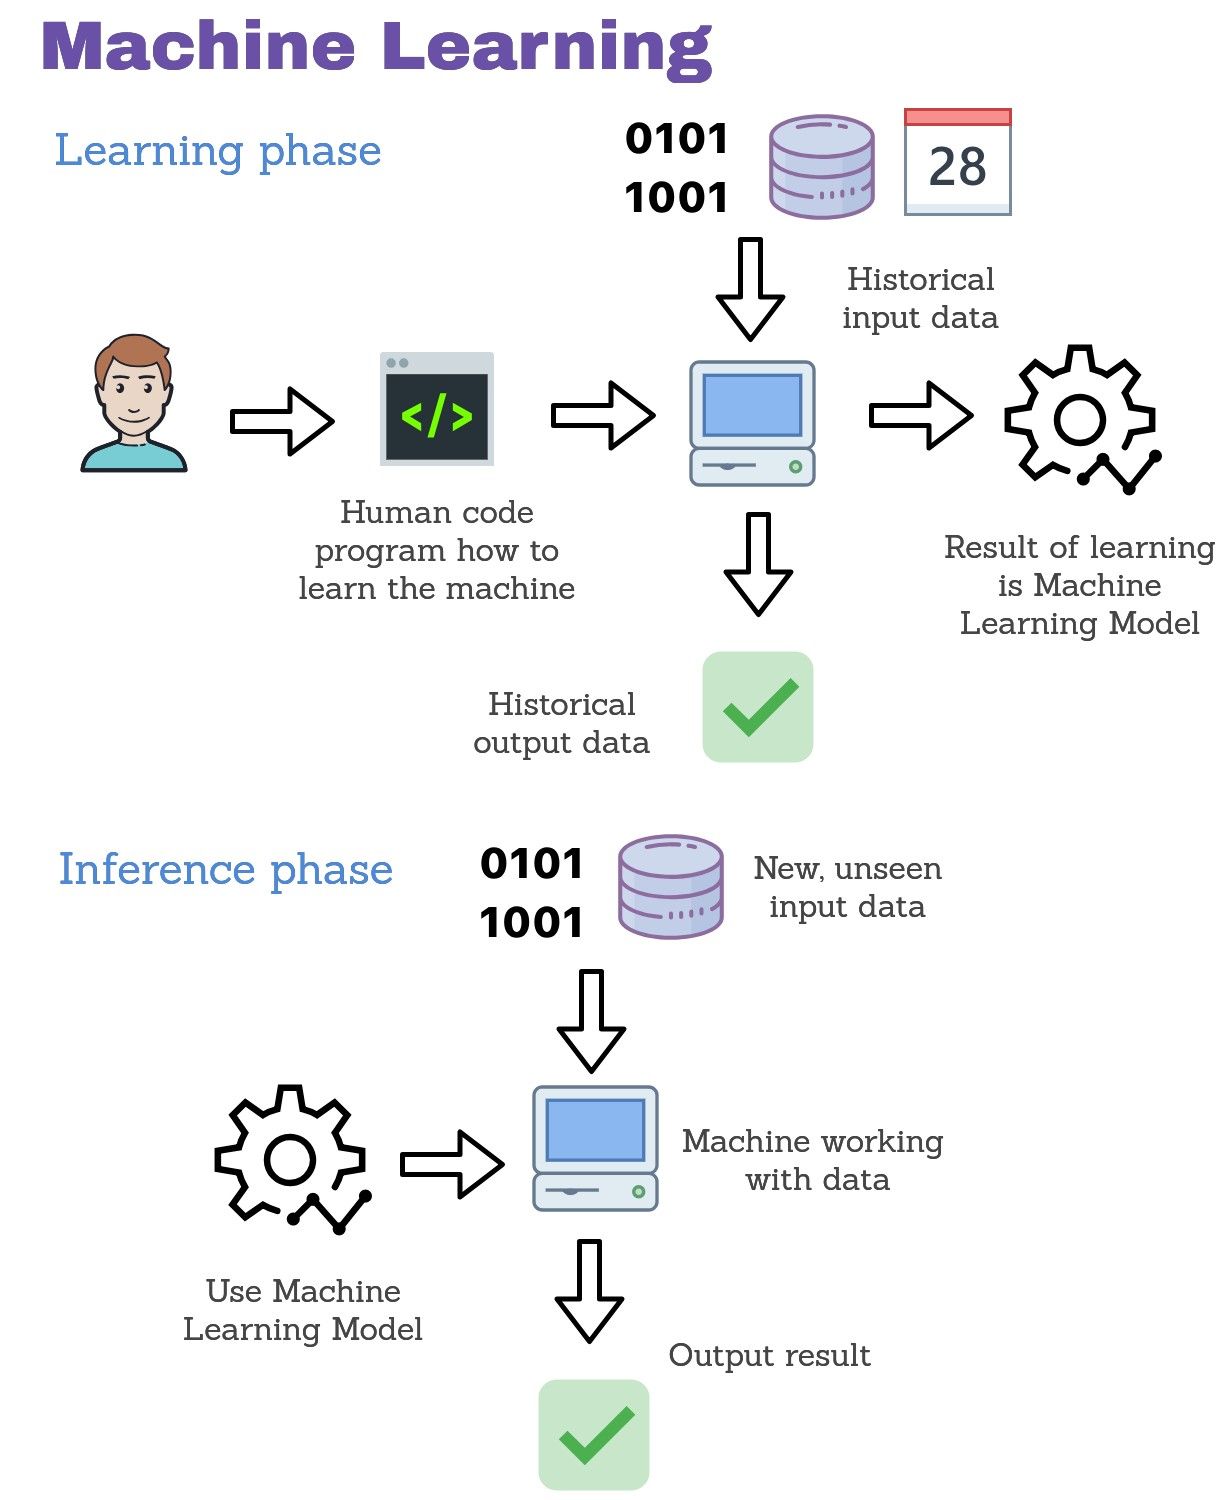
In Machine Learning, humans need to provide code and historical data for creating Machine Learning Models. After ML Model training, it can be used for computing outputs on unseen data.
In the above pictures you can see that programming is often much simpler than Machine Learning (smaller number of total steps, and no need for historical data).
And it often feels like programming is much easier than ML. But there are situations where providing the exact program is impossible.
For example: image classification tasks - say you would like to know what is in the image based on its content. It is impossible to write down all conditions to recognize what is in a picture (pictures can have different size, scales, and so on ...). It is easy to see with the human eye, but writing an exact program is impossible.
But with ML you can create a model that will be able to recognize images. So let's look at some more definitions.
Classification
Classification is the process of assigning a label (class) to a sample (one instance of data). The ML model that is doing a classification is called a classifier.
Tabular data
Tabular data is simply data in table format, similar to a spreadsheet. Other data formats can be images, video, text, documents, or audio. Data in tabular format has rows which represent samples (observations) and columns which represent features.
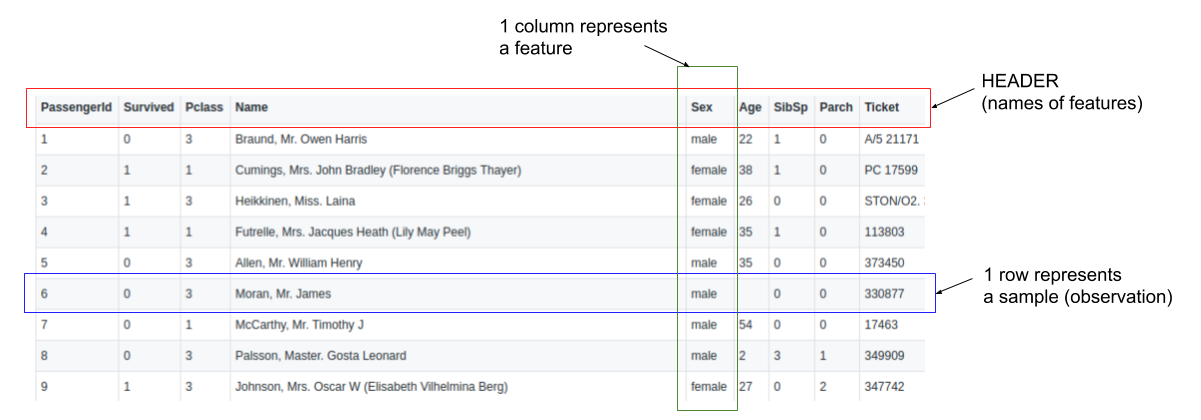
Example of tabular data (Titanic dataset).
In this article we will analyze only tabular data. The typical task in ML is to predict one of the columns. Such a column is called the target column.
The Iris data set
I will show you how to build a Machine Leaning model with AutoML on very simple data set called Iris. The data can be downloaded from many places (it is the same data!):
UCI data repository: https://archive.ics.uci.edu/ml/datasets/Iris
my collection of good data sets for start with ML: https://github.com/pplonski/datasets-for-start/blob/master/iris/data.csv
The Iris data set contains 150 rows, where each row describes a flower. Each row has 4 features (columns) which describe properties of the flower. These features are:
sepal length (cm)
sepal width (cm)
petal length (cm)
petal width (cm)
A label (class) is assigned to each flower which tells us what type of iris it is. In this data set there are 3 classes:
setosa
versicolor
virginica
Let's take the first row of the data. We have:
sepal length = 5.1 cm
sepal width = 3.5 cm
petal length = 1.4 cm
petal width = 0.2 cm
class = setosa
The first row tells us that someone took the iris type 'setosa', measured its sepal and petal properties, and saved it to the dataset.
Where is the Machine Learning here? Let's assume that we have a set of iris flowers but we don't know what types (classes) they are. We know how to measure the sepal and petal length and width but we can't say what type or class of iris is it.
We can use Machine Learning to classify the flower based on our measures. The ML model will take as input the 4 numbers (our measures) and will output the class of the flower.
Let's code!
I will use python in this tutorial. So I assume that you have python installed and know how to install packages.
We will need a few packages, and all of them will be installed with the AutoML package mljar-supervised. To install it run:
pip install mljar-supervised
All the code presented in this article is available on [github](https://www.freecodecamp.org/news/p/49d67cd9-1642-43c6-902d-edcfd56ab013/(https://github.com/mljar/mljar-examples/blob/master/Iris_classification/Iris_classification.ipynb). At the beginning, let's import the packages we need:
import pandas as pd
import numpy as np
from sklearn import datasets
from sklearn.model_selection import train_test_split
from supervised.automl import AutoML
Then load the data:
data = datasets.load_iris()
X = pd.DataFrame(data["data"], columns=data["feature_names"])
y = pd.Series(data["target"], name="target").map({i:v for i, v in enumerate(data["target_names"])})
This is how our data looks like:

The X variable ( print(X) )

The yvariable ( print(y) )
We will split our data into two separate sets:
train - samples which will be used to train the Machine Learning model
test - samples which we will use to check how our Machine Learning model is working on unseen (in the training process) data
X_train, X_test, y_train, y_test = train_test_split(X, y, test_size=0.1)
We will use 90% of our data for training (90%*150=135 samples) and 10% (15 samples) for testing.
Now that we have our data ready we can train the Machine Learning model. Maybe you've heard that there are many ML algorithms. All of them can be used for model training, such as the following models:
Decision Tree,
Logistic Regression,
Random Forest,
Neural Networks,
Xgboost,
just to name the few.
Which model we should use? Which one is the best?
There is no single answer to the above questions. It all depends on the data itself. The common approach is to check as many as you can and select the best performing model. Very often the simplest algorithms are very good to start.
But this is not the end of our problems. Each of the algorithms usually has parameters which control the way the model is trained. They are so-called hyper-parameters. They should be carefully set for the algorithm. To select their values we also need to check a few of them.
For selecting algorithm and hyper-parameters we can use a validation which can be performed in many different ways. I won't go into the details of validation. I will just show you the tool which can handle all of the above problems. It is Automated Machine Learning (AutoML).
AutoML can check many different ML algorithms and tune hyper-parameters for them. It will search for the best ML model for available data.
In real-life, AutoML is used to do even more, like feature engineering (preparing features for analysis and constructing new ones) or deploying models as REST APIs.
I'm using AutoML from the mljar-supervised package (of which I'm the author). It has a very simple interface. Let's train the model:
automl = AutoML(algorithms=["Decision Tree", "Linear", "Random Forest"],
                total_time_limit=5*60)
automl.fit(X_train, y_train)
The above two lines will check 3 different algorithms for us: Decision Tree, Logistic Regression and Random Forest. Then it'll select the best one. There is a time limit set to 5 minutes (5*60 seconds) for total training time.
As a result of running AutoML you will get output like this:
Create directory AutoML_1
AutoML task to be solved: multiclass_classification
AutoML will use algorithms: ['Decision Tree', 'Linear', 'Random Forest']
AutoML will optimize for metric: logloss
AutoML will try to check about 33 models
Decision Tree final logloss 0.5453226492448378 time 30.04 seconds
Decision Tree final logloss 0.6419811899692177 time 21.25 seconds
Decision Tree final logloss 0.4569697687554296 time 16.73 seconds
Linear final logloss 0.16507067466592637 time 15.68 seconds
Random Forest final logloss 0.11891177026579884 time 28.72 seconds
Random Forest final logloss 0.24256194594421207 time 28.73 seconds
Random Forest final logloss 0.2761028104749779 time 27.61 seconds
Random Forest final logloss 0.2536702528991272 time 29.0 seconds
Random Forest final logloss 0.1752405529204018 time 27.86 seconds
Random Forest final logloss 0.17394416017742964 time 27.69 seconds
Ensemble final logloss 0.11781603875353275 time 0.36 seconds
The results of running this AutoML experiment are available on github. When you look into the directory created by AutoML you will see the README.md file. It contains the report from the training:

What is more, you can check each trained model by clicking on its link:

To compute predictions, just run the following lines:
y_predicted = automl.predict(X_test)

print(pd.DataFrame({"Predicted": y_predicted["label"], "Target": np.array(y_test)}))
You will get the following:
     Predicted      Target
0       setosa      setosa
1    virginica  versicolor
2   versicolor  versicolor
3    virginica   virginica
4   versicolor  versicolor
5       setosa      setosa
6       setosa      setosa
7   versicolor  versicolor
8       setosa      setosa
9   versicolor  versicolor
10   virginica   virginica
11  versicolor  versicolor
12   virginica   virginica
13   virginica   virginica
14  versicolor  versicolor
From the above you can see that there was 1 mistake in the predictions (the row with index 1). The ML model predicted class virginica but it should be versicolor. The accuracy of the ML model is:
Accuracy = 14 (correct answers) / 15 (total samples) = 93.33%
Summary
In this article I showed you the differences between programming and Machine Learning. I hope you understand it a bit better.
Machine Learning is a very broad topic and for sure can't be presented in one article. Learning and applying ML can give you a lot of satisfaction, though, so I encourage everyone to explore further.
Automated Machine Learning improves the process of model training by automating algorithm and hyper-parameters search. I hope that AutoML will make ML more accessible to many developers out there.
If you have any questions or would like to read more articles like this please let me know.