
By lars verspohl
The bind, the draw and the interactivity
Let’s say you’re building a data visualization using D3 and SVG. You may hit a ceiling when you try to display several thousand elements at the same time. Your browser may start to puff under the weight of all those DOM elements.
Well here comes HTML5 Canvas to the rescue! It’s much faster, so it can solve your browser’s puffing problems.
But you may quickly find yourself daunted. Because D3 and Canvas works a bit differently from D3 and SVG — especially when it comes to drawing and adding interactivity.
But fear not — it’s not that complicated. Any experience you’ve had with building visuals with D3 and SVG — or approaching D3 with a different renderer — will help you tremendously.
This tutorial built on the shoulders of giants who have already covered Canvas well. I learned these three tutorials by heart and I recommend you do, too:
- Working with D3.js and Canvas: When and How from Irene Ros
- Needles, Haystacks, and the Canvas API from Yannick Assogba
- Learnings from a D3.js addict on starting with Canvas from Nadieh Bremer
So why continue reading this, then? Well, when I want to learn something new, it helps me a great deal to look at the same subject from slightly different angles. And this tutorial is a slightly different angle.
Also, this tutorial covers the three key steps: binding data, drawing elements, and adding interactivity — and it does all this in one go, with an added step-by-step manual to set you up.
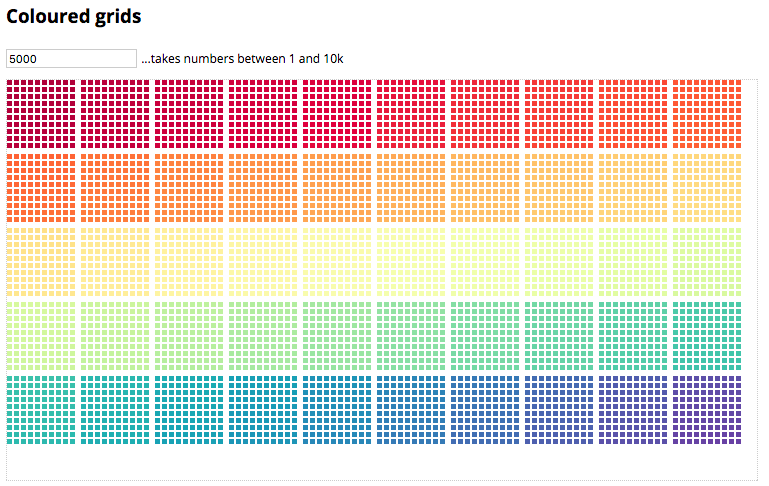
What do we build?
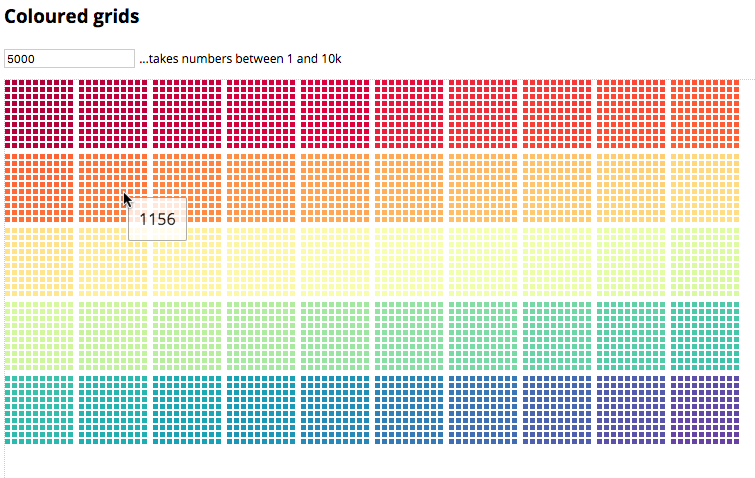
A grid of (many) squares. Their colours aren’t of any deep meaning but don’t they look pretty? The important bit is that you can update it (to cover binding and updating data), that it has many elements (up to 10,000 in order for canvas to pay out), and that you can hover over each square to show square-specific information (interactivity). You can play with it here on a full screen or here with all the code
The mental model
Before we actually dive in, let’s quickly step back and grasp conceptually what we do when we create elements with D3 to draw them to the screen. Skip this if you just want to make things.
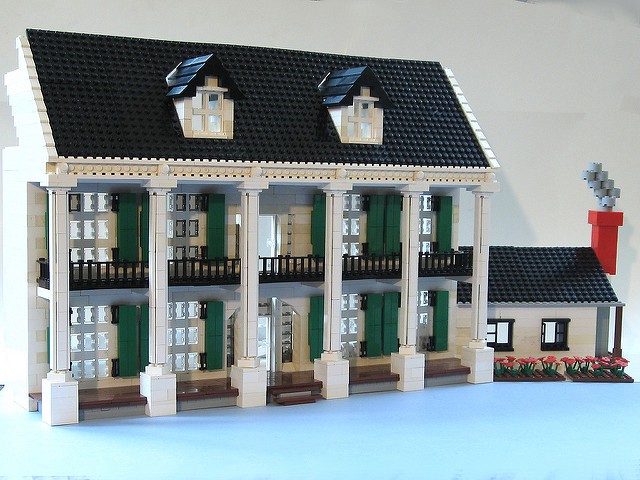
The first step when using D3 usually doesn’t involve drawing — it involves preparing all your elements you want to draw. It’s a bit like building some LEGO. You can rip open the box and start building something or you can look at the manual first and build it according to the blueprint. The manual is your mental model, a blueprint or recipe of what you want to build.
What is D3’s model? Apart from the large number of helpful functions and methods that calculate positions, re-shape datasets (the layouts) and generate functions that draw, for example, paths for us, D3 has a model for how the elements’ lives should evolve on the screen. It has a certain way to think about the lifecycle of each element.
Less ethereally, you inject data into a yet non-existent DOM, and D3 creates new elements of your choice as per the data you inject. Usually one element per datapoint. If you want to inject new data into the DOM you can do so and D3 identifies which elements have to be newly created, which elements are allowed to stay and which elements should pack up and leave the screen.
D3 is usually used in conjunction with SVG or sometimes with HTML-elements. In this orthodox case, you can see the data in the DOM when you choose to look at it through the console, for example. You can grab it, you can move it up or down the DOM and you can — importantly — add interactivity to each element you like to show, for example, a tooltip.
But — on the downside — you can’t show a lot of elements. Why? Because the more elements you push into the DOM, the harder the browser has to work to display them all. Let them also move around and the browser needs to re-calculate them constantly. The more knackered the browser gets the lower your frame rate or FPS (Frames Per Second), which measures how many frames the browser can paint each second. A frame rate of 60 is good and enables a fluid experience as long as no frames are missed — a frame rate of anything under 30 can equal a choppy ride. So when you want to show more elements, you can revert to canvas.
Why canvas? Canvas is an HTML5 element which comes with its own API to paint on it. All elements drawn on the canvas element won’t manifest in the DOM and save a lot of work for the browser. They are drawn in immediate mode. This means the rendered elements won’t get saved in the DOM but your instructions draw them directly to a particular frame. The DOM only knows the one canvas element; everything on it is only in memory. If you want to change your canvas elements you have to redraw the scene for the next frame.
The problem with this is of course that you can’t communicate directly with these non-material elements living in memory. You have to find a way to talk to them indirectly. This is where the D3 model comes in as well as custom or ‘virtual’ DOM-elements. What you’ll do in principal is:
- Bind your data to custom DOM elements. They don’t live in the DOM but only in memory (in a ‘virtual’ DOM) and describe the life-cycle of these elements in a known D3 way.
- Use canvas to draw these elements.
- Add interactivity with a technique called ‘picking’.
Let’s do it.
The data
Before we start to code, let’s produce some data. Let’s say you want 5,000 datapoints. So let’s create an array with 5,000 elements, each of which is an object with just a single property value carrying the element’s index. Here’s how you create it with d3.range(). [d3.range()](https://github.com/d3/d3-array/blob/master/README.md#range) is a D3 utility function, that creates an array based on its argument:
var data = [];
d3.range(5000).forEach(function(el) {
data.push({ value: el });
});
Here’s how the data looks in the console
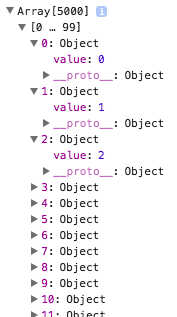
Thrills!
The canvas container and its tools
The canvas element is an HTML element. It’s conceptually very much like any SVG-parent-element, which I at least usually add to a simple container div as in:
<div id=“container”></div>
So, let’s add it to your container with D3 as in…
var width = 750, height = 400;
var canvas = d3.select('#container') .append('canvas') .attr('width', width) .attr('height', height);
var context = canvas.node().getContext('2d');
You also need to add the context, which is the canvas toolbox. The context variable is from now on the object carrying all the properties and methods, the brushes and colours you need to draw on the canvas. Without the context, the canvas element would remain empty and white. That’s all you need to setup — a canvas and its tools…

The HTML
…is simple. The main HTML structure of your site will be:
<!-- A title --><h3>Coloured grids</h3>
<!-- An input field with a default value. --> <input type="text" id="text-input" value="5000">
<!-- An explanation... --> <div id="text-explain">...takes numbers between 1 and 10k</div>
<!-- ...and a container for the canvas element. --> <div id="container"></div>
The Javascript structure
On a top level you only need 2 functions:
databind(data) {
// Bind data to custom elements.
}
draw() {
// Draw the elements on the canvas.
}
Pretty straight forward so far.
Bind the elements
To bind data to the elements you first create a base element for all your custom elements you will produce and draw. If you know D3 well, think of it as a replacement to the SVG element:
var customBase = document.createElement('custom');
var custom = d3.select(customBase); // This is your SVG replacement and the parent of all other elements
Then you add some settings for your grid. In short, these settings allow you to draw a grid of squares. 100 squares build a ‘parcel’ and there is a line break after 10 parcels (or after 1,000 squares). You can adjust this for different ‘parceling’ of the squares or different line-breaking. Or just not worry about it. I suggest the latter…
// Settings for a grid with 10 cells in a row, // 100 cells in a block and 1000 cells in a row.
var groupSpacing = 4; var cellSpacing = 2; var offsetTop = height / 5; var cellSize = Math.floor((width - 11 * groupSpacing) / 100) - cellSpacing;
Now let’s start the data-binding mission. Let’s get the necessities out of the way first and create a colour scale you will apply to your squares a little later.
function databind(data) {
// Get a scale for the colours - not essential but nice.
colourScale = d3.scaleSequential(d3.interpolateSpectral) .domain(d3.extent(data, function(d) { return d; }));
Now let’s join your data to the ‘replacement-SVG’ you called custom above and add yet non-existing custom elements with the class .rect
var join = custom.selectAll('custom.rect') .data(data);
You enter the custom elements (remember nothing enters the DOM, this is all in memory).
var enterSel = join.enter() .append('custom') .attr('class', 'rect') .attr("x", function(d, i) { var x0 = Math.floor(i / 100) % 10, x1 = Math.floor(i % 10); return groupSpacing * x0 + (cellSpacing + cellSize) * (x1 + x0 * 10); }) .attr("y", function(d, i) { var y0 = Math.floor(i / 1000), y1 = Math.floor(i % 100 / 10); return groupSpacing * y0 + (cellSpacing + cellSize) * (y1 + y0 * 10); }) .attr('width', 0) .attr('height', 0);
When an element enters your model, you just give it an x and a y position as well as a width and a height of 0, which you’ll change in the upcoming update selection…
You merge the enter selection into the update selection and define all attributes for the update and enter selection. This includes a width and a height value as well as a colour from the colour scale you built earlier:
join .merge(enterSel) .transition() .attr('width', cellSize) .attr('height', cellSize) .attr('fillStyle', function(d) { return colourScale(d); });
Two things of note about this last line. When you work with SVG this line would be
.style('color', function(d) { return colourScale(d); })
But with canvas you use .attr(). Why? Your main interest here is to find a pain-free way to transfer some element-specific information. Here you want to transfer a colour-string from the databind() to the draw() function. You use the element simply as a vessel to transport your data over to where it is being rendered to the canvas.
That's a very important distinction: when working with SVG or HTML you can bind data to elements and draw or apply styles to the elements in one step. In canvas you need two steps. First you bind the data then you draw the data. You can't style the elements while binding. They only exist in memory and canvas can't be styled via CSS style properties, which is exactly what you access when using .style().
At first, this might seem limiting as you can do less in one step, but it’s conceptually almost cleaner and also gives you some freedom. .attr() allows us to send any key-value pairs on the journey. You could use other methods like the HTML .dataset property for example, but .attr() will do just fine.
Notice we don't say color but fillStyle. To be honest, you could use color or you could use chooChooTrain here. You would only need to remember this when you fetch the information later during drawing. However, as canvas uses a property called fillStyle to style elements, it seems more appropriate in this case.
Finally, you also define the exit selection, deciding what should happen to exiting elements.
var exitSel = join.exit() .transition() .attr('width', 0) .attr('height', 0) .remove();
That’s it! You can close your databind() function and move on...
} // databind()
This is not really scary coming from D3 as it’s pretty much exactly the same. You have now successfully created your data model, the way the application will think about data. Each element will get the properties it needs to be drawn via the .attr() functions and each element will be assigned a life-cycle state depending on the injected data. Our standard D3 model.
Drawing the elements
Now you need to write the draw function to get the elements on screen. Let’s just note here that nothing has happened yet. You haven’t called databind() yet because you need to find a way to draw it to the canvas first. So here we go... The draw() function doesn't need to take any arguments in this case:
function draw() {
As mentioned fleetingly above, you need to take care of cleaning the canvas every time you draw afresh. The DOM is material, in that when you draw a rect-element on it and you change its x value, it will move in the x-direction and the DOM will take care of this move (or the re-paint) automatically.
If you move a rect from x = 0 to x = 1 at a certain point in time (after a button press for example) the browser will move the rect from 0 to 1 within one tick or frame-paint (which is roughly 16ms long). If you move it from 0 to 10, it will do so in a time depending on the duration you asked this transition to happen, maybe 1 pixel per tick maybe 8 pixel per tick (for more read this blog post).
But it will tell the pixel at 0 that the rect has disappeared and the pixel at 1 that there is a rect now. Canvas doesn’t do this. You need to tell canvas what to paint, and if you paint something new, you need to tell it to remove the previous paint.
So let’s start with cleaning up anything that might be on the canvas before you draw. Here’s how:
context.clearRect(0, 0, width, height); // Clear the canvas.
Simple.
Now you…
- …get hold of all elements in order to
- loop through all elements and
- take the information you have stored in the
databind()function to draw the element:
// Draw each individual custom element with their properties.
var elements = custom.selectAll('custom.rect');// Grab all elements you bound data to in the databind() function.
elements.each(function(d,i) { // For each virtual/custom element...
var node = d3.select(this); // This is each individual element in the loop. context.fillStyle = node.attr('fillStyle'); // Here you retrieve the colour from the individual in-memory node and set the fillStyle for the canvas paint
context.fillRect(node.attr('x'), node.attr('y'), node.attr('width'), node.attr('height')); // Here you retrieve the position of the node and apply it to the fillRect context function which will fill and paint the square.
}); // Loop through each element.
And that’s it! You can close the draw() function
} // draw()
When I started with canvas after a while of wanting to dive into it, this simplicity really upped my spirits.
However, nothing has happened in the browser yet. We have the tools in the databind() and the draw() function, but nothing has been drawn yet. How do you do this? If you just wanted to draw a static visual or image, you just call:
databind(data);
draw();
This would bind the data to the custom elements, which would live in memory and then draw it — once!
But you have transitions. Remember above: when you wrote the databind() function you transitioned the cell width and height from 0 to their size as well as the colour from black (the default) to the respective element’s colour. A default D3 transition lasts 250 milliseconds, so you need to redraw the squares many times in these 250 ms in order to get a smooth transition. How do you do this?
It’s again simple. You just call databind(data) to create our custom elements before you repeatedly call draw() for as long as it takes the transition to run. So in our case at least 250 ms. You could use setInterval() for this but we really should use requestAnimationFrame() in order to be as performant as possible (for more read this). There are a few ways to use it, but keeping within the D3 spirit, I suggest using d3.timer() which implements requestAnimationFrame() as well as being straight forward to use. So here we go:
// === First call === //
databind(d3.range(value)); // Build the custom elements in memory.
var t = d3.timer(function(elapsed) {
draw();
if (elapsed > 300) t.stop();
}); // Timer running the draw function repeatedly for 300 ms.
d3.timer() calls the callback repeatedly until elapsed (which is the passed time in milliseconds from instantiation) is past 300 and then the timer is stopped. In these 300 milliseconds, it runs the draw() at each tick (roughly each 16ms). draw() then looks at each element's attributes and draws them accordingly.
This is how a transition works in canvas. You call the drawing function right after the binding function many times. Whatever your D3-model is set up to transition (positions, colours, sizes) will be re-drawn many times with small incremental changes for each draw
Note that draw() needs to come right after the databind() function. You couldn't ask the machine to run databind(), then do something else for a second and then call draw(). Because after 1 second the transitioned states calculated by your databind() function have all transitioned already. Done, dusted and forgotten.
That’s it! You’ve bound data to custom elements and you’ve drawn it to the canvas.
Let the user update the number of squares
To give the user the chance to repeat this feat with a custom number of elements (ok, semi-custom with a maximum of 10,000) you add the following listener and handler to your text-input box:
// === Listeners/handlers === //
d3.select('#text-input').on('keydown', function() {
if (d3.event.keyCode === 13) { // Only do something if the user hits return (keycode 13).
if (+this.value < 1 || +this.value > 10000) { // If the user goes lower than 1 or higher than 10k... d3.select('#text-explain').classed('alert', true); // ... highlight the note about the range and return.
return;
} else { // If the user types in a sensible number...
d3.select('#text-explain').classed('alert', false); // ...remove potential alert colours from the note...
value = +this.value; // ...set the value...
databind(d3.range(value)); // ...and bind the data.
var t = d3.timer(function(elapsed) {
draw(); if (elapsed > 300) t.stop();
}); // Timer running the draw function repeatedly for 300 ms. } // If user hits return.
}); // Text input listener/handler
Here it is again, our colourful grid of canvas squares, ready to be updated and redrawn:

Interactivity
The biggest ‘pain’ with canvas in comparison to SVG or HTML is that there are no material elements living in the DOM. If there were you could just register listeners to the elements and add handlers to the listeners. For example you can trigger a mouse-over on an SVG rect element and whenever the listener triggers, you could do something to the rect. Like showing data values stored with the rect in a tooltip.
With canvas you have to find another way to make an event heard on our canvas elements. Luckily there are a number of clever people who thought of an indirect but logical way.
So what interactivity do we want? As said above let’s go for a tooltip and let’s assume you want to show the index of the square in a tooltip as soon as you hover over the element. Not very thrilling, but the key is that you can access the data bound to the element by hovering over it.
Picking
There are a few steps involved (all logical though). But in short you will build two canvases to achieve this. One main canvas that produces our visual and one hidden canvas (as in we can’t see it) that produces the same visual. The key here is that all elements on the second canvas will be at the exact same position in relation to the canvas origin compared to the first canvas. So square 1 starts on 0,0 on the main canvas as well as on the hidden canvas. Square 2 starts on 8,0 on the main canvas as well as on the hidden canvas and so on.
There is only one important difference. Each element on the hidden canvas will get a unique colour. We will create an object (or rather an associative array or map for brevity) that links each unique colour to each element’s data.
Why? Because next we attach a mouse-move listener to the main-canvas to retrieve a stream of mouse-positions. At each mouse-position we can use a canvas-own method to “pick” the colour at this exact position. Then we just look up the colour in our associative array and we have the data ! And we’re flying…

You could say “well, my squares have already got a unique colour, I can use those?” And indeed, you could use them. However, your interactivity would go out of the window as soon as you decide to bereft your squares from the colours. So you should make sure to always have one canvas — the hidden canvas — that has a guaranteed set of unique colours for the squares.
Let’s apply this technique step by step. The code you’ve built so far can stay as it is — you just add to it as you go along.
1. Prepare the hidden canvas
First let’s create the hidden canvas that will harbour our visual with a unique colour per square.
1.1 Create hidden canvas element and set its CSS to { display: none; }.
// Rename the main canvas and add a 'mainCanvas' class to it.
var mainCanvas = d3.select('#container') .append('canvas') .classed('mainCanvas', true) .attr('width', width) .attr('height', height); // new -----------------------------------
// Add the hidden canvas and give it the 'hiddenCanvas' class.
var hiddenCanvas = d3.select('#container') .append('canvas') .classed('hiddenCanvas', true) .attr('width', width) .attr('height', height);
In fact, I won’t set the canvas to hidden in this example to show what is going on. But to do so, just add .hiddenCanvas { display: none; } to your CSS and the deed is done.
1.2 Build the context variable in the draw() function and pass two arguments to the function: the canvas as well as a boolean called 'hidden' determining which canvas we build (hidden = true || false) as in:
function draw(canvas, hidden) {
1.3 You now need to adapt all draw functions to include the two new draw() arguments. So from now on, you don't just call draw() you call either draw(mainCanvas, false) or draw(hiddenCanvas, true)
2. Apply unique colours to the hidden elements and map them
Here, dear reader, comes the key part of our operation, the engine of our truck, the spice in our soup.
2.1 Include a function to generate a new unique colour every time it gets called (via Stack Overflow)
// Function to create new colours for the picking.
var nextCol = 1;
function genColor(){ var ret = [];
if(nextCol < 16777215){ ret.push(nextCol & 0xff); // R ret.push((nextCol & 0xff00) >> 8); // G ret.push((nextCol & 0xff0000) >;> 16); // B
nextCol += 1; }
var col = "rgb(" + ret.join(',') + ")";
return col;
}
genColour() produces a colour defining string in the form rgb(0,0,0). Every time it's called it increments the R value by one. Once it reaches 255, it increments the G value by 1 and resets the R value to 0. Once it reaches r(255,255,0) it increments the B value by 1 resetting the R and the G to 0 and so on.
So in total you can have 256256256 = 16.777.216 elements to retain a unique colour. However, I can assure you your browser will die beforehand. Even with canvas (webGL tutorial to follow).
2.2 Create the map-object that will keep track of which custom element has which unique colour:
var colourToNode = {}; // Map to track the colour of nodes.
You can add the genColour() function wherever you want in your script, as long as it's outside the databind() and draw() function scope. But note that your map variable needs to be created before and beyond the scope of the databind() function.
2.3 Add a a unique colour to each custom element as for example .attr('fillStyleHidden') and
2.4 build the map-object during element creation
Here you’ll use your ‘colour-canon’ genColour() in our databind() function when assigning the fillStyle to our elements. As you also have access to each datapoint while it's being bound to each element, you can bring colour and data together in your colourToNode map.
join .merge(enterSel) .transition() .attr('width', cellSize) .attr('height', cellSize) .attr('fillStyle', function(d) { return colorScale(d.value); });
// new ----------------------------------------------------- .attr('fillStyleHidden', function(d) {
if (!d.hiddenCol) {
d.hiddenCol = genColor(); colourToNode[d.hiddenCol] = d;
}
// Here you (1) add a unique colour as property to each element // and(2) map the colour to the node in the colourToNode-map.
return d.hiddenCol;
});
2.5 You can now colour the elements according to the canvas the draw() function is rendering. You add a conditional on the fillStyle in the draw() function applying the colours for our visual to the main canvas and the unique colours to the hidden canvas. It's a simple one-liner:
context.fillStyle = hidden ? node.attr('fillStyleHidden') : node.attr('fillStyle');
// The node colour depends on the canvas you draw.
The main canvas still looks the same of course:
Let’s finally add some interactivity and start with drawing the hidden canvas whenever we move the mouse onto our main canvas.
3. Pick up the colours with the mouse
3.1 First, simply register a listener to the main canvas, listening to mouse-move events.
d3.select('.mainCanvas').on('mousemove', function() {
});
Why mousemove? As you can’t register listeners with individual squares but have to use the entire canvas you won’t be able to work with mouseover or -out events as they will only trigger when entering the canvas not the elements. In order to get the mouse position on your canvas you can do mousemove or click/mousedown.
d3.select('.mainCanvas').on('mousemove', function() {
draw(hiddenCanvas, true); // Draw the hidden canvas.
});
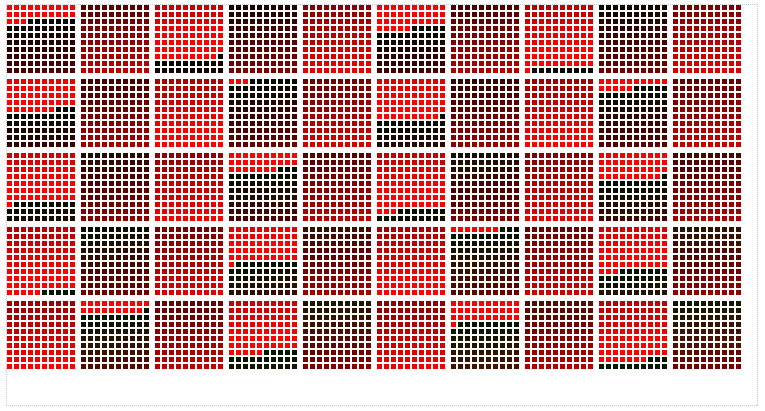
This way, the first thing our user triggers when mousing over the main canvas is to unknowingly create the hidden canvas. As said, in production this canvas would be hidden, but for our educational purposes we want to see it and indeed, trigger the hidden canvas to be drawn when the mouse moves over the main canvas like so:
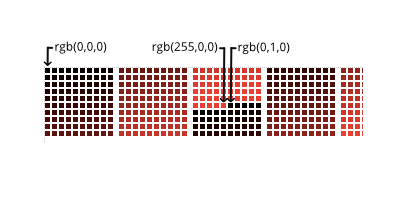
The colours on the main canvas range from black to red, from rgb(0,0,0) to rgb(255,0,0) and then it looks as if the same range from black to red is repeated. However, now the colour ranges from a slightly greener black, precisely from rgb(0,1,0) to rgb(255,1,0):
Zooming into the first couple of hundred squares, here are the colours of the first, the 256th and the 257th square:
3.3 As our hidden canvas is structurally a carbon copy of our main canvas, all the hidden canvas elements will be at the same position as the elements on our main canvas. So, you can now use the mouse’s x and y positions you are collecting from the listener on the main canvas to establish the same location on the hidden canvas. Back in the listener, you add:
d3.select('.mainCanvas').on('mousemove', function() { // Draw the hidden canvas. draw(hiddenCanvas, true);
// Get mouse positions from the main canvas. var mouseX = d3.event.layerX || d3.event.offsetX; var mouseY = d3.event.layerY || d3.event.offsetY; });
Note here we take the event.layerX and event.layerY properties which return the mouse position including scrolling. This can break so use offsetX as a fallback (or just use offsetX).
3.4 The picking: Canvas greatly allows access to the pixel-data the mouse is hovering over with the getImageData() function and its .data property. In full bloom this will look like:
getImageData(posX, posY, 1, 1).data .
It will return an array with four numbers: the R, the G, the B and the alpha value. As you diligently built the colourToNode map assigning the element data to each of its hidden colours, you can now access this element's data simply by looking up the colour in the map!
d3.select('.mainCanvas').on('mousemove', function() {
// Draw the hidden canvas. draw(hiddenCanvas, true);
// Get mouse positions from the main canvas. var mouseX = d3.event.layerX || d3.event.offsetX; var mouseY = d3.event.layerY || d3.event.offsetY;
// new -----------------------------------------------
// Get the toolbox for the hidden canvas. var hiddenCtx = hiddenCanvas.node().getContext('2d');
// Pick the colour from the mouse position. var col = hiddenCtx.getImageData(mouseX, mouseY, 1, 1).data;
// Then stringify the values in a way our map-object can read it. var colKey = 'rgb(' + col[0] + ',' + col[1] + ',' + col[2] + ')';
// Get the data from our map! var nodeData = colourToNode[colKey];
console.log(nodeData);
});
And indeed, logging the nodeData to the console returns an object every time you hover over a square:
The data per node now shows the value which constitutes the original data as well as the key hiddenCol showing this node's colour for the hidden canvas:

3.5 Finally — and that’s a formality — you add the tooltip
d3.select('.mainCanvas').on('mousemove', function() {
// Draw the hidden canvas. draw(hiddenCanvas, true);
// Get mouse positions from the main canvas. var mouseX = d3.event.layerX || d3.event.offsetX; var mouseY = d3.event.layerY || d3.event.offsetY;
// Get the toolbox for the hidden canvas. var hiddenCtx = hiddenCanvas.node().getContext('2d');
// Pick the colour from the mouse position. var col = hiddenCtx.getImageData(mouseX, mouseY, 1, 1).data;
// Then stringify the values in a way our map-object can read it. var colKey = 'rgb(' + col[0] + ',' + col[1] + ',' + col[2] + ')';
// Get the data from our map! var nodeData = colourToNode[colKey]; console.log(nodeData);
// new -----------------------------------------------
if (nodeData) { // Show the tooltip only when there is nodeData found by the mouse
d3.select('#tooltip') .style('opacity', 0.8) .style('top', d3.event.pageY + 5 + 'px') .style('left', d3.event.pageX + 5 + 'px') .html(nodeData.value);
} else { // Hide the tooltip when the mouse doesn't find nodeData. d3.select('#tooltip').style('opacity', 0); }
}); // canvas listener/handler
That’s it! You’ve visualised a large number of elements on canvas — more than you would’ve been able to enjoy problem-free with SVG. You still used D3’s lifecycle model and you added some interactivity to access the data attached to each element. These three steps should enable you to do pretty much anything or at least more than what you’re used to when working with D3 and SVG.
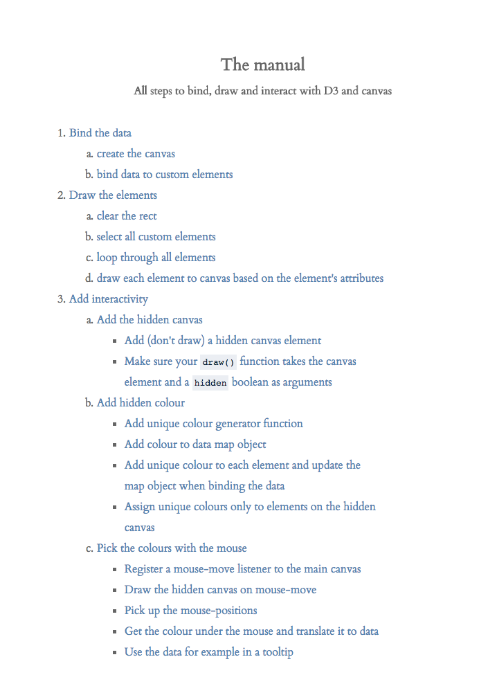
There’s a step-by-step manual from scratch to interactive D3/canvas on my blog which allows internal page links. This way you can see the whole process in one view and click your way through it with ease:
…and here’s the full code again.
I hope you enjoyed reading this and please do say hello and/or …
_lars verspohl www.datamake.io @larsvers https://www.linkedin.com/in/larsverspohl
…is always grateful for a like? or a follow he can return.