

Ah, the joy of coding! There you are, cruising through your project, when suddenly – bam! – you hit a bug. It's like hitting a wall in a maze.
But fear not, fellow coder, for I bring you the trusty map to navigate the treacherous bug-infested waters of programming. Whether you're a self-learner aiming to land that dream job in tech or just tinkering for fun, here's how to become a debugging ninja.
Look for Errors in Your IDE
Your Integrated Development Environment (IDE) isn't just a fancy text editor – it's your first line of defense against bugs.
TypeScript, for example, is like that friend who points out the pothole you're about to step into – it helps catch errors early with its type-checking prowess.
Imagine you accidentally try to add a number to a string. TypeScript waves a big red flag, saving you from a facepalm moment later. It's one of the many reasons we adore TS.
Example: You declare let age: number = 'twenty';. TypeScript will frown upon this, telling you that 'twenty' is not a number. It's like having a guardian angel for your code.
Try and Isolate the Area
Before you start pulling out your hair, try to play detective and isolate where the crime scene is.
Is the bug lurking in the backend, hiding in the frontend, conspiring in the database, or chilling in the infrastructure?
When you're working locally, it's usually one of the first three suspects. And here's a hot tip: the network tab in your browser's developer tools is like your police scanner, helping you pinpoint the location of the distress call.
Example: Let's say you send out a request to GET /users and it returns a 500 status. That's the server telling you, "Mate, I've got problems." It's a backend issue. But if the call comes back with a 200 status and your UI is still playing hide and seek with the data, then the bug's hosting a party in your frontend. The network tab just handed you the address.
By narrowing down the location of your issue, you can focus your debugging efforts more efficiently. It's like knowing whether to raid the castle, the dragon's lair, or the dark forest. Happy hunting!
Look for Errors in the Browser Console
The browser console is your Sherlock Holmes magnifying glass for web projects. It uncovers clues hidden in plain sight. The console tab, on the other hand, is like tracking where the villain has been, helping you spot those pesky code misfires.
Example: Your React app isn't fetching data. A quick peek in the console tab shows an "undefined" error, and a line number. This is where your problem is at. Elementary, my dear Watson!
Add console.log() to Different Functions
Ah, the humble console.log(), the print statement that could. When in doubt, log it out. It's like dropping breadcrumbs through your code to see how far Little Red Riding Hood gets before she meets the Big Bad Bug.
Example: Unsure if your function is receiving the expected data? console.log('Data:', data) at the start of the function. No data? Now you know where the problem starts.
Use Try-Catch Blocks
Try-catch blocks are your safety net, allowing your code to perform daring feats without crashing your app. They let you gracefully handle errors by catching them before they wreak havoc. They also let you specify your own custom error messages for a given block of code, helping you to find the problem area.
Example: Wrap your API call in a try-catch. If the call fails, the catch block catches the error, allowing you to console.log it or display a friendly message to the user.
Heres what a try catch block looks like in JS:
  function displayUsers() {
    try {
      const users = getUsers();
    } catch (error) {
      console.log("oh crap");
    }
  }
Search Google or Use ChatGPT to Help With Error Messages
Stuck on an error message? Google and ChatGPT are your library and librarian. Just copy and paste the error into the search bar and watch a plethora of solutions unfold. It's like asking the hive mind: someone, somewhere, has had your problem before.
Example: Getting a "TypeError: Cannot read property 'map' of undefined"? A quick search reveals you might be trying to use .map() on something that's not an array. Oops!
Test Often
The mantra "test early, test often" will save you heaps of time. By testing small bits of code as you go, you catch bugs early, when they're easier to squash. It's like cleaning as you cook– it makes the final cleanup so much easier.
Example: Just added a new feature? Test it out before moving on. Does it work as expected? Great! No? Time to debug while the code is still fresh in your mind.
Try a Different Approach
If you're banging your head against the wall with a problem, maybe it's time to climb over it instead. Don't get too attached to your code. Be willing to refactor or even start from scratch if it means a cleaner, more elegant solution.
Example: If your code is more tangled than a bowl of spaghetti, stepping back and rethinking your approach might reveal a simpler, more efficient path.
Debugging is part art, part science, and entirely a test of patience. But with these strategies in your toolkit, you'll be squashing bugs with the best of them. Happy coding, and may your bug hunts be short and your code be clean!
Real Life Scenario
Let's take real life scenario. I have a React, Node, Postgres app that displays users in the browser. The code, as far as I know, should be working but I'm not seeing the users displayed on the frontend.
Step 1 – Check the Console
Let's have a nosey at the Chrome dev tools console and see what's going on.
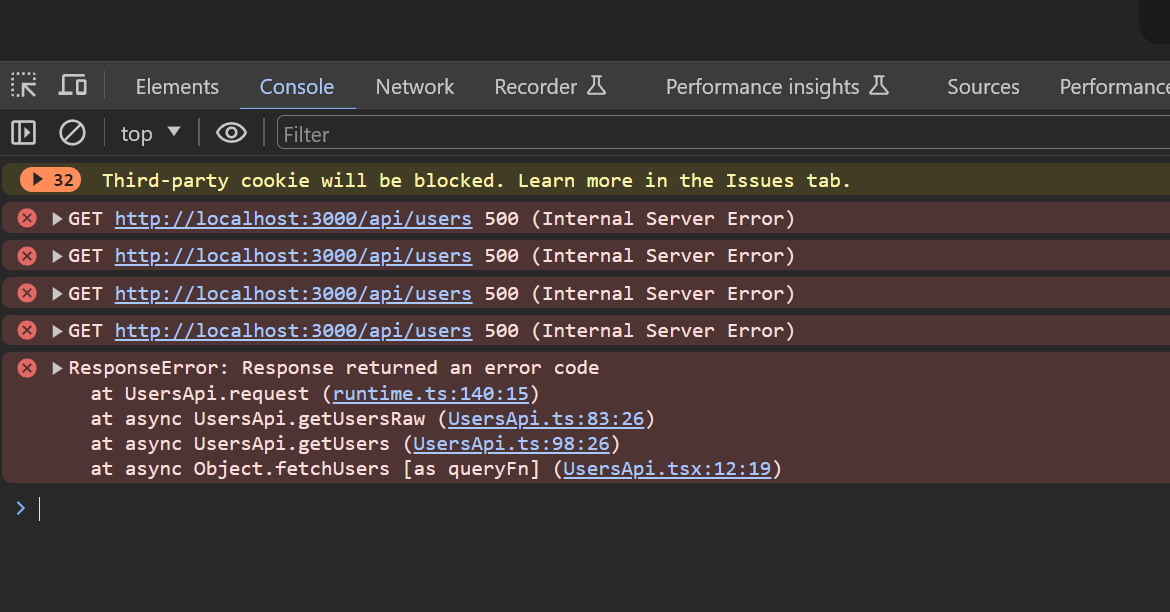 "Look ma, errors!"
Ah, the plot thickens in the saga of "Why isn't this thing working?". Let's dive into the drama unfolding in your console and break down the breadcrumbs left behind by our mischievous friend, the bug.
First up, we have our leading clue: GET http://localhost:3000/api/users 500 (Internal Server Error). This line is the equivalent of a scream in the night in our detective story. It tells us that our backend is in distress, possibly tied to a nefarious SQL query or a rogue piece of logic in our API route.
The server's cry for help is loud and clear: "Internal Server Error." Classic move by the backend, really.
Now, our supporting cast makes their entrance with ResponseError: Response returned an error code. This is the big reveal. The issue isn't just a server having a bad day – it's a ResponseError caught red-handed by UsersApi.request, and even tells us where the error line is (UserApi.ts:83).
Step 2 – Check the backend Terminal
Our journey into investigating the bug has brought us to the backend, where we are greeted with this:
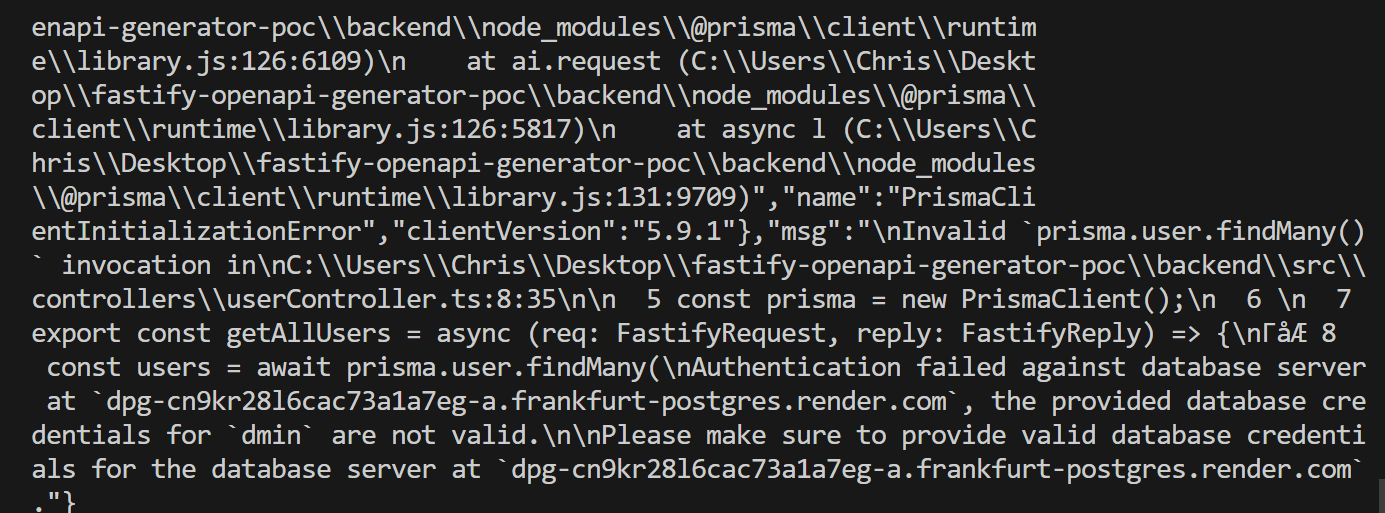
If you see this and your first instinct is to run away and hide, don't worry – that was mine too. But fear not! There are plenty of clues that point us to the issue.
When a backend error occurs, this is what's known as a stack trace – basically all the errors, info, line numbers, and so on that the compiler encountered in one big block of text. Thanks compiler!
What we do here is look for key words, recognisable files, or anything that's readable by humans. Did you spot anything? Let's dive deeper:
 Digging deeper into the errors
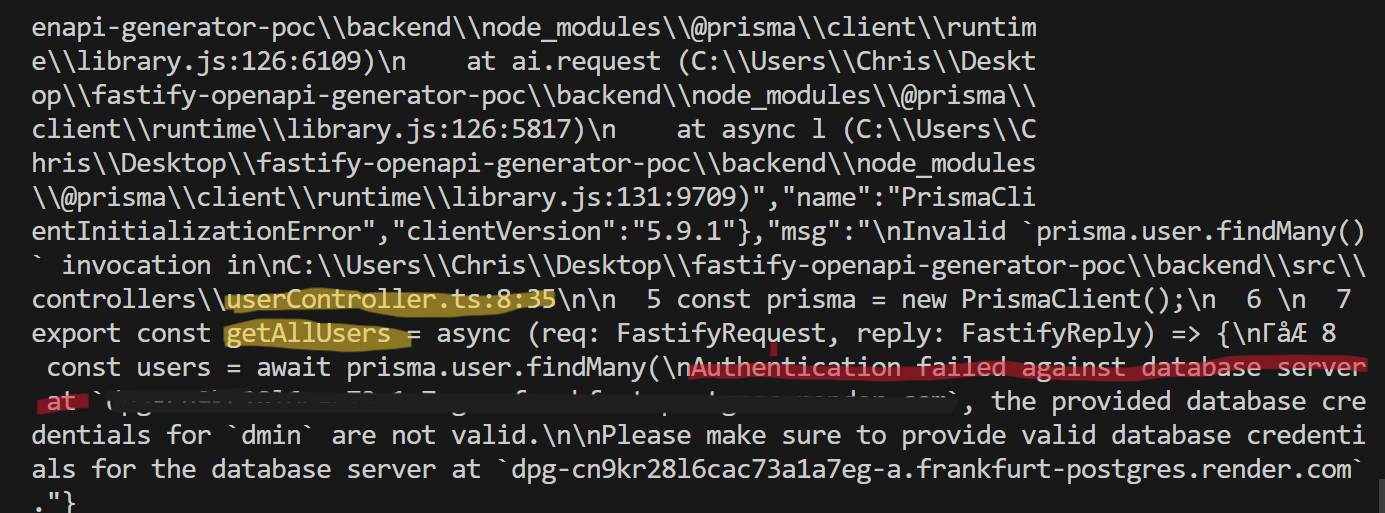
The highlighted parts in yellow, indicate that there was an error in userController.ts, specifically at getAllUsers() function. If we read further, the highlighted parts in red point us to the error message:
Authentication failed against database server at `dpg-cn9kr28l6cac73a1a7eg-a.frankfurt-postgres.render.com`,
the provided database credentials for `dmin` are not valid.\n\nPlease make sure to provide valid database credentials for the database server
Hurray! Now we know the error. We have spelled "admin" incorrectly in our database connection string, meaning the connection failed. Doh! After we fix this, the error is resolved:
 Error resolved
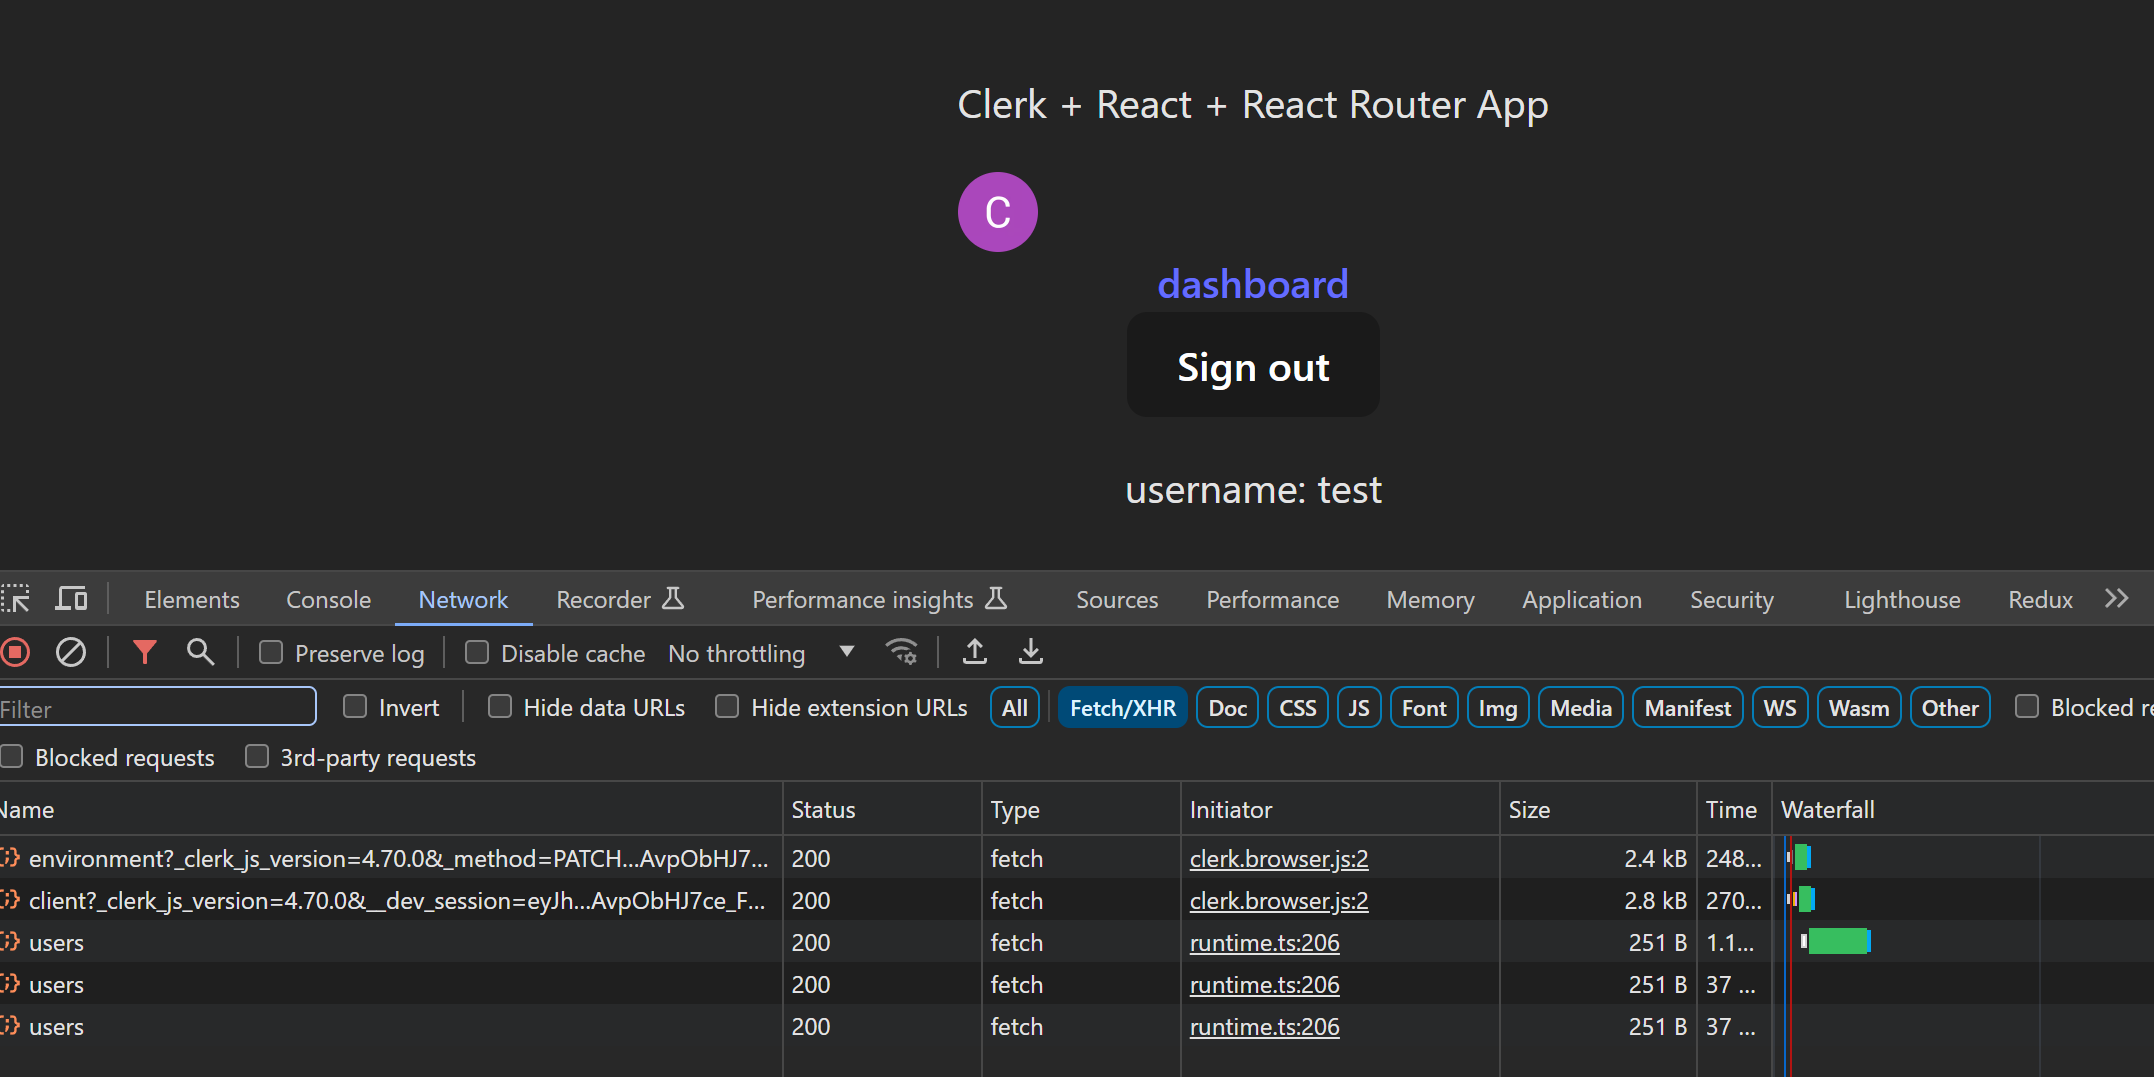
Step 3: Verify the Fix
Now we've added a fix, we can verify by checking the browser to see if everything's working. In this case, checking the UI is enough to verify, but for more complex flows you can get that the API is returning the correct status code (in this case, 200)
Conclusion
I hope this article has shed some light on how you can debug your projects.
If you are looking for more debugging insights, and real industry level projects to build, you can check out by YouTube where we build and deploy full stack applications using React, Node, and some other cool tech. Hope to see you there!