
By Daniel Deutsch
Table of Contents
- What this is about
- The reference code base
- 1. Fetch and print values within Session.run
- 2. Use the tf.Print operation
- 3. Use Tensorboard visualization for monitoring
- a) clean the graph with proper names and name scopes
- b) Add tf.summaries
- c) Add a tf.summary.FileWriter to create log files
- d) Start the tensorboard server from your terminal
- 4. Use the Tensorboard debugger
- 5. Use the TensorFlow debugger
- Conclusion
What this is about
Debugging is twice as hard as writing the code in the first place. Therefore, if you write the code as cleverly as possible, you are, by definition, not smart enough to debug it. — BRIAN W. KERNIGHAN
Debugging in general can be a tedious and challenging task. Nevertheless, you must be comfortable going through the written code and identifying problems. Normally there are many guides, and the process of debugging is often well documented for many languages and frameworks.
When it comes to TensorFlow, however, some new challenges arise because of the way it works.
As the official documentation states:
A TensorFlow Core program consists of two discrete sections:
- Building the computational graph (a tf.Graph).
- Running the computational graph (using a tf.Session).
The actual computation is done with session.run(), which means that we need to find a way to inspect values inside this function.
The reference code base
As a reference, I will provide my Github repository with the corresponding code here.
We will use a basic neural network to classify handwritten digits from the MNIST dataset, using:
tf.nn.softmax_cross_entropy_with_logits_v2as the TF classification operation for defining the losstf.train.GradientDescentOptimizerfor minimizing the loss
Running this small neural network shows that it can already achieve an accuracy of ~92%:
The process of debugging
Now for debugging, there are basically 5 (pragmatic) ways to achieve this.
As a side note: It is often useful to assert shapes to ensure that everything works together as intended.
1. Fetch and print values within Session.run
This is probably the fastest and easiest way to get the information you need.
- easy and fast
- any evaluation can be fetched from everywhere
- it’s necessary to hold the reference to the tensor, which is bad in complex models
In essence, you run the session in a print statement and feed it the dictionary, like so: print( f"The bias parameter is: {sess.run(b, feed_dict={x: mnist.test.images, y_: mnist.test.labels})}" )
If the code gets more complex, the partial_run execution of a session could be used. But since this is an experimental feature I will not implement this for demonstration.
Additionally, don’t forget the [.eval()](https://www.tensorflow.org/api_docs/python/tf/Tensor#eval) method for evaluating tensors specifically.
See the full code here on Github.
2. Use the tf.Print operation
The tf.Print method comes in handy during run-time evaluation when we don’t want to explicitly fetch the code with session.run(). It is an identity op that prints data when evaluating.
- it allows us to see the development of values during evaluation
- it has limited configuration and therefore can easily clog the terminal
Yufeng G created a fantastic video and article about how to use the tf.Print statement. And as he points out, it is vital to structure the print node the way that it is used further. As he says:
It is vitally important that you actually use this returned node, because if you don’t, it will be dangling.
In my code, I added a print statement that fetches the values within the session to illustrate how both methods perform differently in execution.
With runtime evaluation comes the possibility of runtime assertion with tf.Assert .
3. Use Tensorboard visualization for monitoring
Before diving into this debugging method, be aware that there is the Tensorboard and the Tensorboard debugger!
The TF website offers a great tutorial for implementing and using the board.
A key for the usage is the serializing of the data. TensorFlow provides the summary operations, which allow you to export condensed information about the model. They are like anchors telling the visualization board what to plot.
a) Clean the graph with proper names and name scopes
First we need to organize all the variables and operations with the [scope](https://www.tensorflow.org/guide/graph_viz#name_scoping_and_nodes) methods that TF provides.
with tf.name_scope("variables_scope"): x = tf.placeholder(tf.float32, shape=[None, 784], name="x_placeholder") y_ = tf.placeholder(tf.float32, shape=[None, 10], name="y_placeholder")
b) Add tf.summaries
For example:
with tf.name_scope("weights_scope"): W = tf.Variable(tf.zeros([784, 10]), name="weights_variable") tf.summary.histogram("weight_histogram", W)
c) Add a tf.summary.FileWriter to create log files
Tip: Make sure to create sub folders for each log to avoid accumulation of graphs.
d) Start the tensorboard server from your terminal
For example: tensorboard --logdir=./tfb_logs/ --port=8090 --host=127.0.0.1
Navigating to the tensorboard server (in this case http://127.0.0.1:8090) shows the following:
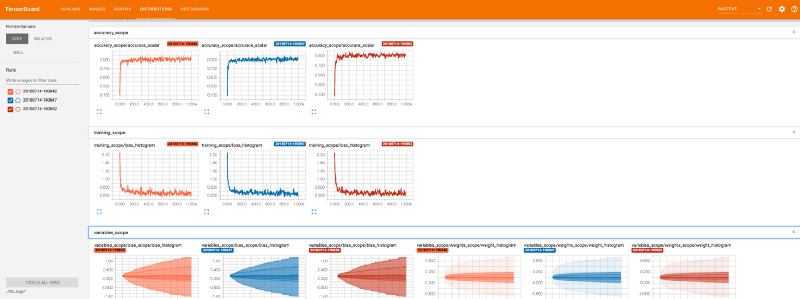
Now the full power and use of tensorboard becomes clear. It allows you very easily to spot errors in your machine learning model. My code example is a very simple one. Imagine a model with multiple layers and more variables and operations!
4. Use the Tensorboard debugger
As the Tensorboard Github repository states:
This dashboard is in its alpha release. Some features are not yet fully functional.
However, it can still be used and provides cool debugging features. Please check out the Github repository to get an adequate overview. Also, see their video to get a deeper understanding. They have done a great job.
To accomplish this, there are 3 things to add to our previous example:
- Import
from tensorflow.python import debug as tf_debug - Add your session with
tf_debug.TensorBoardDebugWrapsperSession - Add to your tensorboard server the
debugger_port
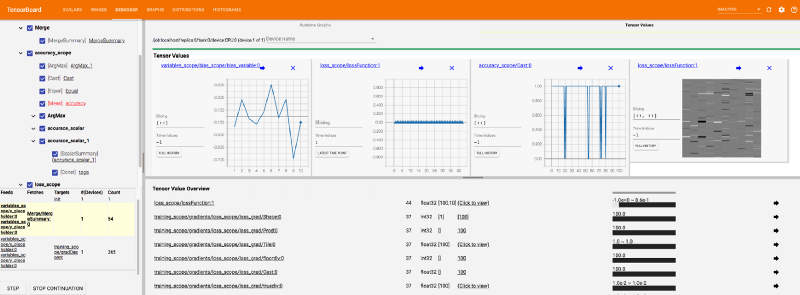
Now you have the option to debug the whole visualized model like with any other debugger, but with a beautiful map. You are able to select certain nodes and inspect them, control execution with the “step” and “continue” buttons, and visualize tensors and their values.
There is much more to talk about regarding this unique feature of Tensorflow, but I will probably dedicate another article to that.
See my full code here on Github.
5. Use the TensorFlow debugger
The last method, but also very powerful, is the CLI TensorFlow debugger.
This debugger focuses on the command-line interface (CLI) of tfdbg, as opposed to the graphical user interface (GUI) of tfdbg, that is the TensorBoard Debugger Plugin.
You simply wrap the session with tf_debug.LocalCLIDebugWrapperSession(sess) and then you start the debugging with executing the file (maybe it's necessary to add the --debug flag).
It basically allows you to run and step through the execution of your model, while providing evaluation metrics.
I think the official documention could be improved, but they have also created a video which introduces the feature in a good way.
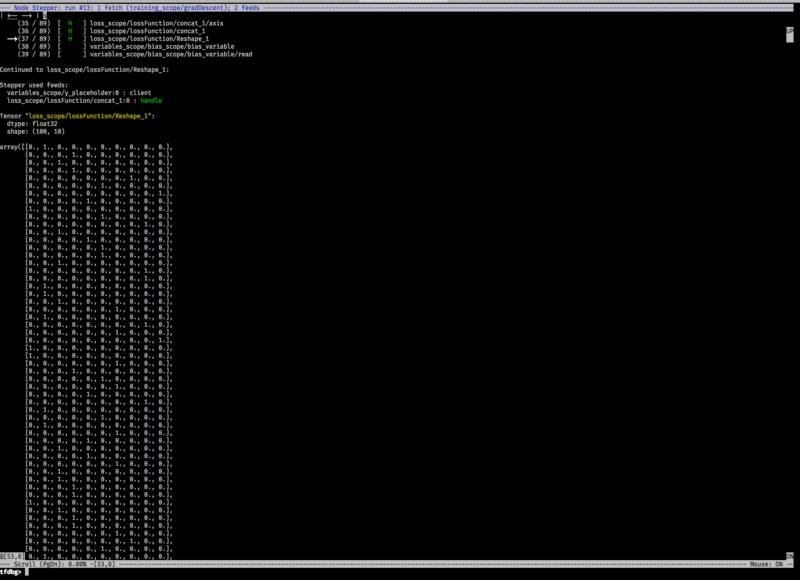
So the key features here are the commands invoke_stepper and then pressing s to step through each operation. It is the basic debugger functionality of a debugger but in the CLI. It looks like this:
See the full code here on Github.
Conclusion
As shown, there are many ways to debug a TensorFlow application. Each method has its own strengths and weaknesses. I didn’t mention the Python debugger, because it is not TensorFlow specific, but keep in mind that the simple Python debugger already provides some good insights!
There is a great presentation by Wookayin who talks about these concepts as well but also goes over some general debugging advise. That advice is:
- name tensors properly
- check and sanitize input
- logging
- assertions
- proper use of exceptions
- failing fast -> immediately abort if something is wrong
- don’t repeat yourself
- organize your modules and code
I am really excited for all the features that TensorFlow has to offer for people who are building machine learning systems. They are doing a great job! Looking forward to further developments! :)
Thanks for reading my article! Feel free to leave any feedback!
Daniel is a LL.M. student in business law, working as a software engineer and organizer of tech related events in Vienna. His current personal learning efforts focus on machine learning.
Connect on: