

Electronic devices that run software are all around us. Your mobile phone, your car, your microwave, and virtually anything around you – there’s a very good chance that they have electronic components running some form of software.
These devices inevitably use power and have batteries and circuits, which degrade over time. As time passes, these devices get replaced by newer upgraded ones. But this also means that more and more electronic waste builds up on our planet.
Also, since we have more electronic devices entering our ecosystem every day, we’re also using more power, leading to more carbon emissions.
This means we need to design both hardware and software in a way which acknowledges that the earth’s resources are limited. This article will give you an introduction on how you can architect your software for sustainability.
Here is what we'll cover:
- Prerequisites
- Why are we thinking about this now?
- What's involved in architecting and programming for sustainability?
- Profile your software for power and energy consumption
- Software Techniques and Design Patterns for Sustainability
- Conclusion
##Prerequisites
I wrote this article with a focus on general ideas in computer science. This lecture will help with some background on Power and Energy in electrical circuits.
Other parts of this article provide references wherever you might need some background.
Why Are We Thinking About this Now?
Human made climate change has been steadily accelerating for decades. Carbon emissions have been rising. As a part of the technology community, we can help reduce some factors which have been contributing towards the degradation of the earth’s environment.
In this article I will present a few ideas and techniques on how you as a programmer and a software architect can make choices which will lead to more sustainable technology.
What's Involved in Architecting and Programming for Sustainability?
In the context of this article, when I describe architecting software and programming for sustainability, I’m referring to the following aims:
Designing software so that it:
- Consumes the smallest amount of energy possible, to get the task at hand done.
- Results in the least amount of battery degradation possible, while maintaining the minimum amount of performance needed for the task.
- Needs a minimum amount of cooling for the hardware that it is running on.
- Results in devices lasting longer.
You’ll see that the techniques we'll discuss here all have the same theme behind them: make electronic hardware do the minimum amount of work possible to complete the task at hand.
Let's start with some techniques that you can use to accomplish this while architecting and writing software.
##Profile Your Software for Power and Energy Consumption
A problem which cannot be measured, cannot be solved. As a result, measuring the energy and power consumption of software is one of the most important tasks we need to do when designing with sustainability in mind.
Let’s take a step back and cover some of the basics of power and energy.
As you may know, power is the rate at which energy is consumed. That is:
$$P = dE/dt$$
In continuous time domain, we could also say that:
$$Energy = \int_{0}^{t} P \,dt$$
Practically, we never really get power measurements in the continous time domain. We usually have discrete power measurements over an interval of time. So our Power vs time graph might look something like this:
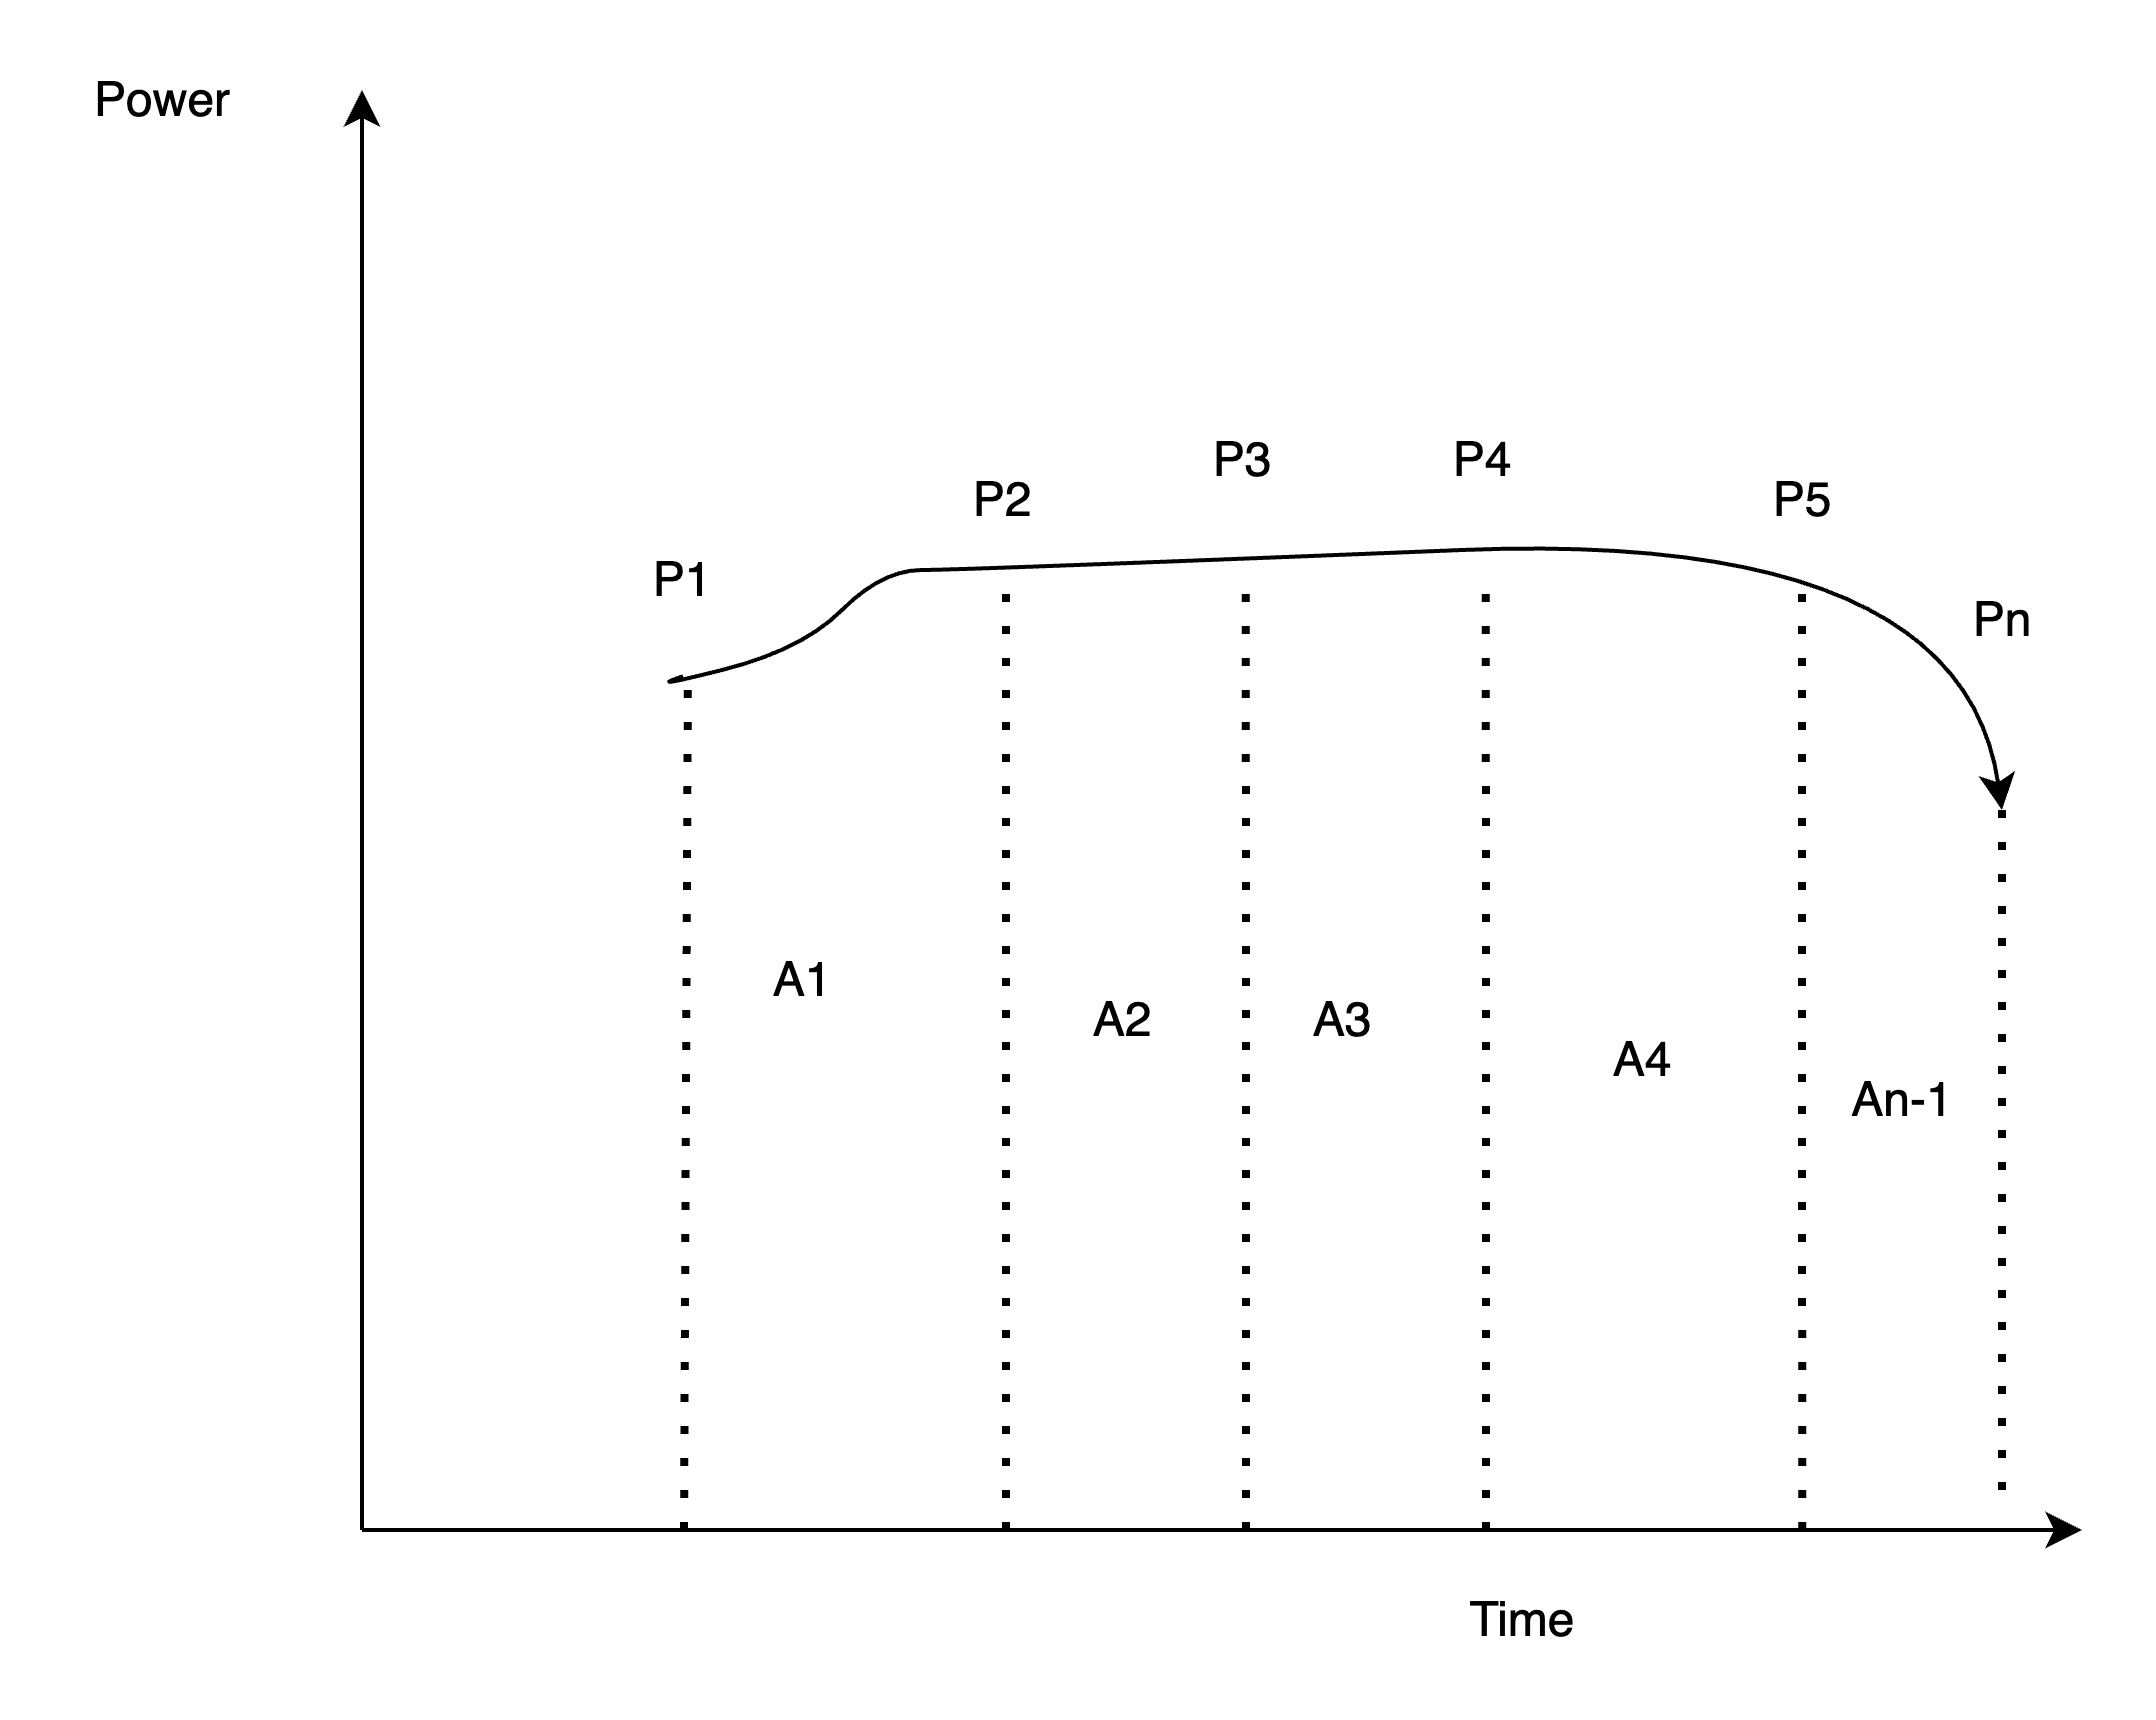 Figure 1: Power vs time and computing energy consumption
Since we have n discrete Power measurements over time, the energy consumption can be estimated as the area under the curve. This can be modeled as the sum of n-1 trapezoids.
(Energy = \sum_{i=1}^{n-1} A^{i}) where (A^{i}) is the area of the ith trapezoid.
Profiling software for energy consumption refers to the process of measuring the energy consumed by the software being run.
So should you be profiling power or energy ? The answer is – it depends. In some scenarios which involve heavy user interaction (where the user controls the amount of time spent), it makes more sense to measure power.
For example: When a user is watching a video on a laptop or a mobile phone, they control many things such as the duration of the video watched, the screen’s brigthness, speaker volume, and so on.
In other scenarios where the user doesn’t have as much control over the work being performed by the electronic device, it makes sense for energy to be profiled. An example of such a case might be the energy needed to send a message via SMS / IP messaging service (not counting the energy needed to type out the message).
Let's look at some common metrics for profiling energy consumption next.
###Energy Delay Product (EDT)
Used in the research paper What are your programming language's Energy delay implications?, the energy delay product is a weighted metric which is defined as follows:
$$EDT = E * T^{w}$$
where E is the Energy consumption for the task and T is the time taken for the task to be completed.
This metric aims to give us a measure of how much energy an operation takes, while at the same time penalizing the metric for the amount of time taken. That is, an operation consuming the same amount of energy but taking longer to perform by a system, has a higher EDT and is therefore considered less energy efficient.
The weight w can be chosen to be:
- 1: When energy efficiency is of major concern
- 2: When both energy and performance are important
- 3: When performance is more important than energy efficiency
So, you can tailor w to give you an idea of your software system’s energy and performance, based on indicators fit for your use case – whether energy is more important or performance.
Greenup, Powerup, and SpeedUp
In the thesis Using the Greenup, Powerup And Speedup Metrics To Evaluate Software Energy Efficiency, AbdulSalam et al introduced new metrics to measure energy efficiency.
They saw that EDT had one shortcoming: since it was a product of two quantities (Energy and weighted time taken to complete the task at hand), it was possible that two systems which had the same EDT for a task, actually differed when it came to energy efficiency and performance - but their EDT was still the same.
As a result, it was hard to conclude which system was better from an energy + performance point of view, where energy and performance had equal importance.
They introduced 3 metrics to address this issue.
- Speedup, which is defined as:
$$Speedup = T_{base} / T_{opt}$$
where (T{base}) = Time taken to complete the task for the unoptimized case, (T{opt}) = Time to complete the task for the optimized case.
If the optimized case is more performant than the unoptimized case (since remember, we could be optimizing for only energy, only performance, or both) then Speedup > 1.
Greenup, which is defined as:
$$Greenup = Energy_{base} / Energy_{opt} = P_{base} * T_{base} / P_{opt} * T_{opt}$$
.
Here (P{base}) is the average power consumed by the task in the unoptimized case and similarly, (P{opt}) is the average power consumed by the task in the unoptimized case.
If we look at different values of Speedup and Powerup, they can fall into the following categories:
- Zone 1: Powerup < 1 and Speedup < 1 and Speedup > Powerup – in this scenario, the optimized solution sacrificed some performance, but there was a greater power reduction. As a result Greenup > 1, so there are energy savings.
- Zone 2: Powerup < 1, Speedup > 1 – in this scenario, the optimized solution improved in performance and at the same time, reduced power consumption. As a result, energy consumption decreased and performance improved. This is the best case scenario for any optimization.
- Zone 3: Powerup > 1, Speedup > 1 and Speedup > Powerup – in this case, average power consumption improved, but the speedup more than made up for the increase in power consumption. As a result, energy consumed still reduced between the optimized and unoptimized solutions.
- Zone 4: Powerup > 1, Speedup > 1 and Powerup > Speedup – in this case, power consumption decreased, but so did performance. Still, the energy consumption as a whole increased since the loss of performance was greater than the power savings.
- Zone 5: Powerup > 1, Speedup < 1 – in this case, the energy consumption increased since there was a performance degradation and also there was an increase in power consumption.
- Zone 6: Powerup < 1, Speedup < 1, Powerup > Speedup – in this case, performance improved, but power increased more than the amount that performance improved. As a result, the energy consumption increased as a whole.
The figure below (inspired by this thesis) shows the zones where energy consumption increases and where it decreases. The red (4, 5 and 6) and the green areas (1, 2 and 3) depict these zones.
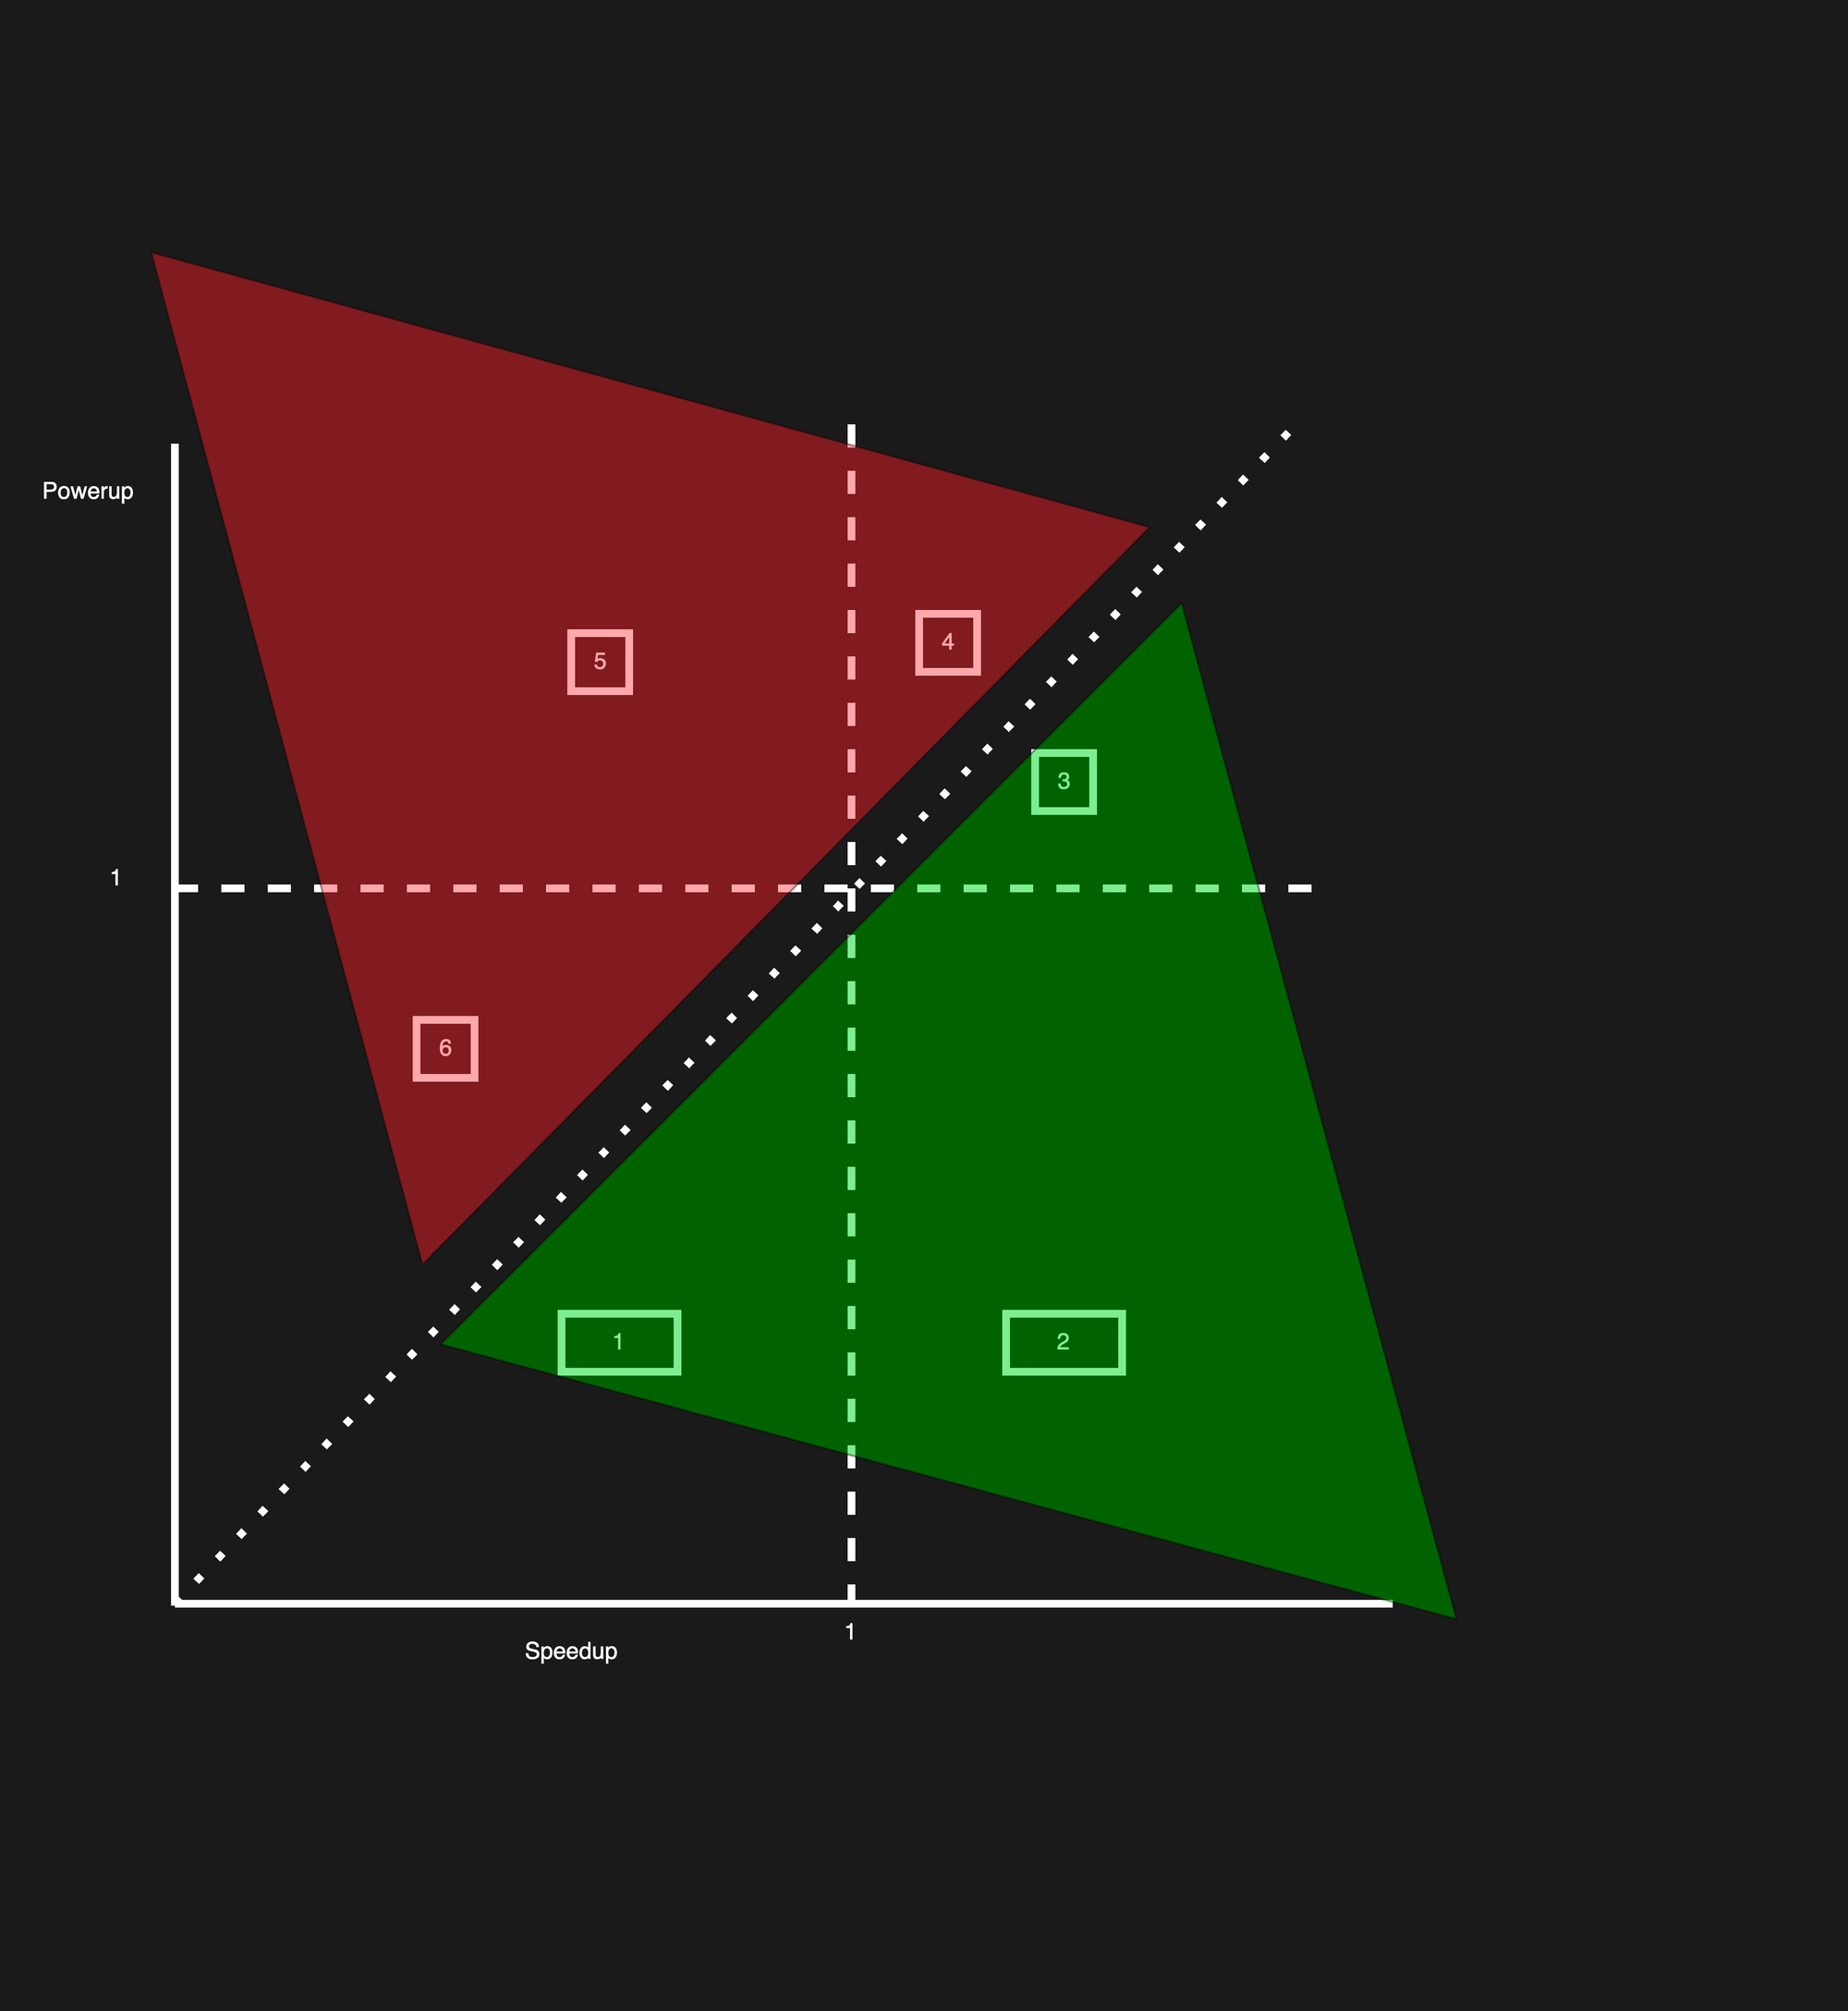 Figure 2 : The different zones for Speedup and Powerup
We went over a couple of metrics which both have their strengths and weaknesses. EDT’s strength is that you can give more weightage to performance. But its weakness is that many a time, it may not tell you whether one solution is really better than the other.
While knowing about energy consumption is very important, you should not ignore power consumption. High power consumption, amongst other effects, can have adverse thermal impacts on electronic devices. That is, your device’s skin and component temperature can increase. This may lead to:
- Component damage: Electronic components such as memory, wires, and capacitors on your device can get damaged as temperature increases.
- Battery damage: Batteries can get damaged at higher temperatures. Their life may decrease and in some extreme cases they may also explode.
Commercial electronics are usually built to operate within a 0 - 70 degrees Celsius temperature range. But for mobile phones it is usually recommended that the operating temperature not exceed 35 degrees celsius.
Before you profile the energy and power being consumed by a specific task on your devices, it's important to isolate the task as much as possible.
By this, I mean that its important that we take out as many other power consuming tasks or variables. These may be other services / daemons or settings on the device which may affect the power consumed in unreliable ways.
For example, if the device uses the internet, background processes may be doing some activities which may vary between multiple profile runs, so in general it is a good idea to switch off the internet (unless the task being measured uses the internet). We want to do this since we want reproducible power profiling numbers from run to run.
So in general, it is a good idea to make a checklist of the conditions which need to be constant for power profiling to be reliable and reproducible. This could vary from system to system.
##Tools for Profiling
Now, let's talk about how power can be profiled. Different systems may offer different ways of profiling energy consumed.
Depending on the operating system and the underlying hardware, there are a few options. I won’t go into details of these tools since there are many options and there is also good documentation available on their official websites.
###Linux
- PowerStat is a tool that can measure power consumption on Intel hardware that supports the RAPL (Running average power limit) interface.
- Cpu-energy-meter is a tool that measures the energy consumed by CPUs in a given time period.
- Powertop is a tool authored by Intel which gives you information about many things of interest such as power consumption, CPU C / P States, CPU usage, and file system operations per second (and so on).
###macOS
- Intel power gadget is a tool authored by Intel which gives users the ability to monitor power consumption, CPU frequency, CPU utilization, and even temperature on Intel based Mac machines. Note: According to Intel’s website, Power gadget will not get updates anymore and it recommends using Intel Performance Counter instead.
- MxPower Gadget is a tool similar to the Intel power gadget, but for Apple silicon-based Macs.
- Powermetrics is a command line tool that is pre-installed on Apple Silicon and Intel-based machines. It helps you obtain power measurements for CPU and GPU operation.
- The Activity Monitor App is pre-installed on Macs, and gives you an overview of how your app is performing. It also gives you an overview of various metrics about your Mac. While it doesn’t give you power numbers, it is still a useful tool.
###Android
The AOSP (Android Open Source Project) official documentation provides some guidelines on how to measure system component power here. This process may vary depending on the manufacturer of the device.
Android Studio, Android’s official development IDE also offers a Power Profiler to measure power. The On-Device Power Monitor (ODPM) reports power consumed by all profilable sub-systems through their power rails. Note: These measurements are not specific to any app, as they measure device power on the whole.
###iOS
During iOS app development, developers can measure the energy impact of their app using XCode’s inbuilt Instruments profiler.
We talked about various ways to profile power and energy in this section. In the coming sections, I'll discuss some techniques and considerations to keep in mind to make your software more sustainable.
##Software Techniques and Design Patterns for Sustainability
###Consider which programming language to use
Programming languages have multiple levels of abstraction over the hardware that they are running on. Some have a model of the machine presented to the programmer which is really close to the actual hardware they are running on.
Languages which are directly compiled to machine code are generally more power efficient. They also are generally more performant, since there is less overhead compared to languages which are interpreted or run on a virtual machine, such as Java.
The research paper I mentioned earlier (What are your programming language's Energy delay implications) discusses this in detail and is a great read.
While many popular operating systems have the majority of their APIs in languages like Java, Kotlin, and Swift (which are not native), they usually have performance critical APIs available in native code as well – for example, Android’s C interface-based NDK library. These can interface with their virtual machine-run counterparts and in combination be used to write efficient applications.
###Make software power aware: React to thermal events
In the previous section, I talked about the importance of keeping power consumption low on the devices which run your software. This is not only important to reduce energy consumption, it's also important so that your device’s operating temperature doesn’t go into territory which can damage your device.
The operating temperature of your device doesn’t only depend on the software running on it (which includes your software). It also depends on the ambient temperature.
For example: if a smartphone is used in a car on a hot day, there’s a good chance that when a demanding application is run on it, it’ll thermally stress out the device. So what can you as a software architect do about this?
You cannot control ambient temperature, but you can control how your software responds to thermal events. Many popular operating systems offer APIs to ‘listen’ for thermal events. When apps get notifications that the device’s thermal load has crossed a certain limit, they should take appropriate actions.
For example, if a device is streaming video and it gets a notification about thermally heating up, it may lower the resolution at which it is streaming video in order to reduce power consumption.
If a video conferencing app gets a worrisome thermal event notification, it may want to reduce the frame rate at which it is capturing video / reduce the resolution.
The following are thermal event APIs on popular operating systems
MacOS and iOS: the NSNotificationCenter offers a thermal event listener which userspace applications can register for.
Android: PowerManager offers an onThermalStatusChangedListener which apps can register for, to receive thermal event notification.
###When appropriate, use low power states on hardware
Most modern processors have provisions for reducing power consumption. In these modes, the processor consumes less power by changing the CPU clock speed, putting the CPU into various idle states among various methods. Operating systems give the user the ability to leverage these low power states.
For example, Linux has the cpupower-frequency-set tool which allows users to modify CPU frequency settings.
As another example, Arduino microcontrollers give programmers the ability to put them in various sleep modes when there are no active tasks to be run. These microcontrollers are typically woken up by an interrupt when a task to be processed is ready.
###Investigate the tradeoffs between Interrupt driven-I/O and Polling
Often, software needs to wait on another component of hardware or software for data to process. There are usually two parties involved: the producer of the data and the consumer of the data
For example, a mobile application may be waiting on a touch event on the display. Here the consumer is the mobile application and the producer is the display hardware + software.
Another example could be a native embedded program that is waiting on the status of a CPU register to change in order to perform some task. Here the consumer is the native embedded program and the producer is the CPU register (well, the producer may actually be producing some other data, but for simplicity we’re only considering a CPU register here).
There are broadly 2 ways of doing this:
Polling: The process of checking the status of a data-readiness at regular predetermined intervals of time is referred to as polling. Typically it looks something like this in code:
// psuedo-code
while(poll) {
    bool data_available =  check_data();
    if (data_available) {
        process_data();
    }
    sleep(SLEEP_TIME); // to avoid wasting cpu cycles
}
Polling seems pretty simple to implement. But unless you’re absolutely sure that the data or condition you’re waiting on is going to be available at a regular frequency, it has some disadvantages:
- Polling doesn’t respond to the data being available as soon as it is available, since it checks for availability after every SLEEP_TIME ms.
- By constantly checking every time the polling thread wakes up, it still wastes cpu cycles and as a result some power.
Interrupt-driven I/O: in this strategy, there are no explicit checks for the data that is being waited on to be ready. Instead, it is the responsibility of the producer to inform the consumer whenever the data is ready. The consumer does not explicitly check in with the producer, even periodically. As a result, this saves CPU cycles and also power!
There are multiple ways of implementing interrupt-driven I/O. There can be hardware interrupts as well as software interrupts.
For example, when a user touches a mobile phone screen at a particular location, the operating system could send a callback to one of the application’s thread’s notifying it that a touch input event is ready to process. Until the thread gets the notification, it can either do something else, or just stay asleep!
So in short, interrupt-driven I/O is generally more power efficient than polling, and you should prefer it, unless there’s a very good reason to use polling.
Look into Caching
Caching in computer science refers to the process of saving data in a storage location that is typically faster to access than high latency storage (which are generally larger in capacity).
Caching is useful when the same set of data needs to be read or modified repeatedly by software. It allows efficient retrieval and re-use of data.
You can see caching in action in many forms such as:
- Random Access Memory (RAM) is a cache for underlying disk
- CPU cache – L(n) – where n is the level of the cache. As n decreases, the cache size usually gets smaller and the latency of data retrieval gets smaller as well.
- Applications can cache data retrieved from the internet into their on device memory for quick access.
- Local servers can cache data from remote servers for quicker access as well.
And many more.
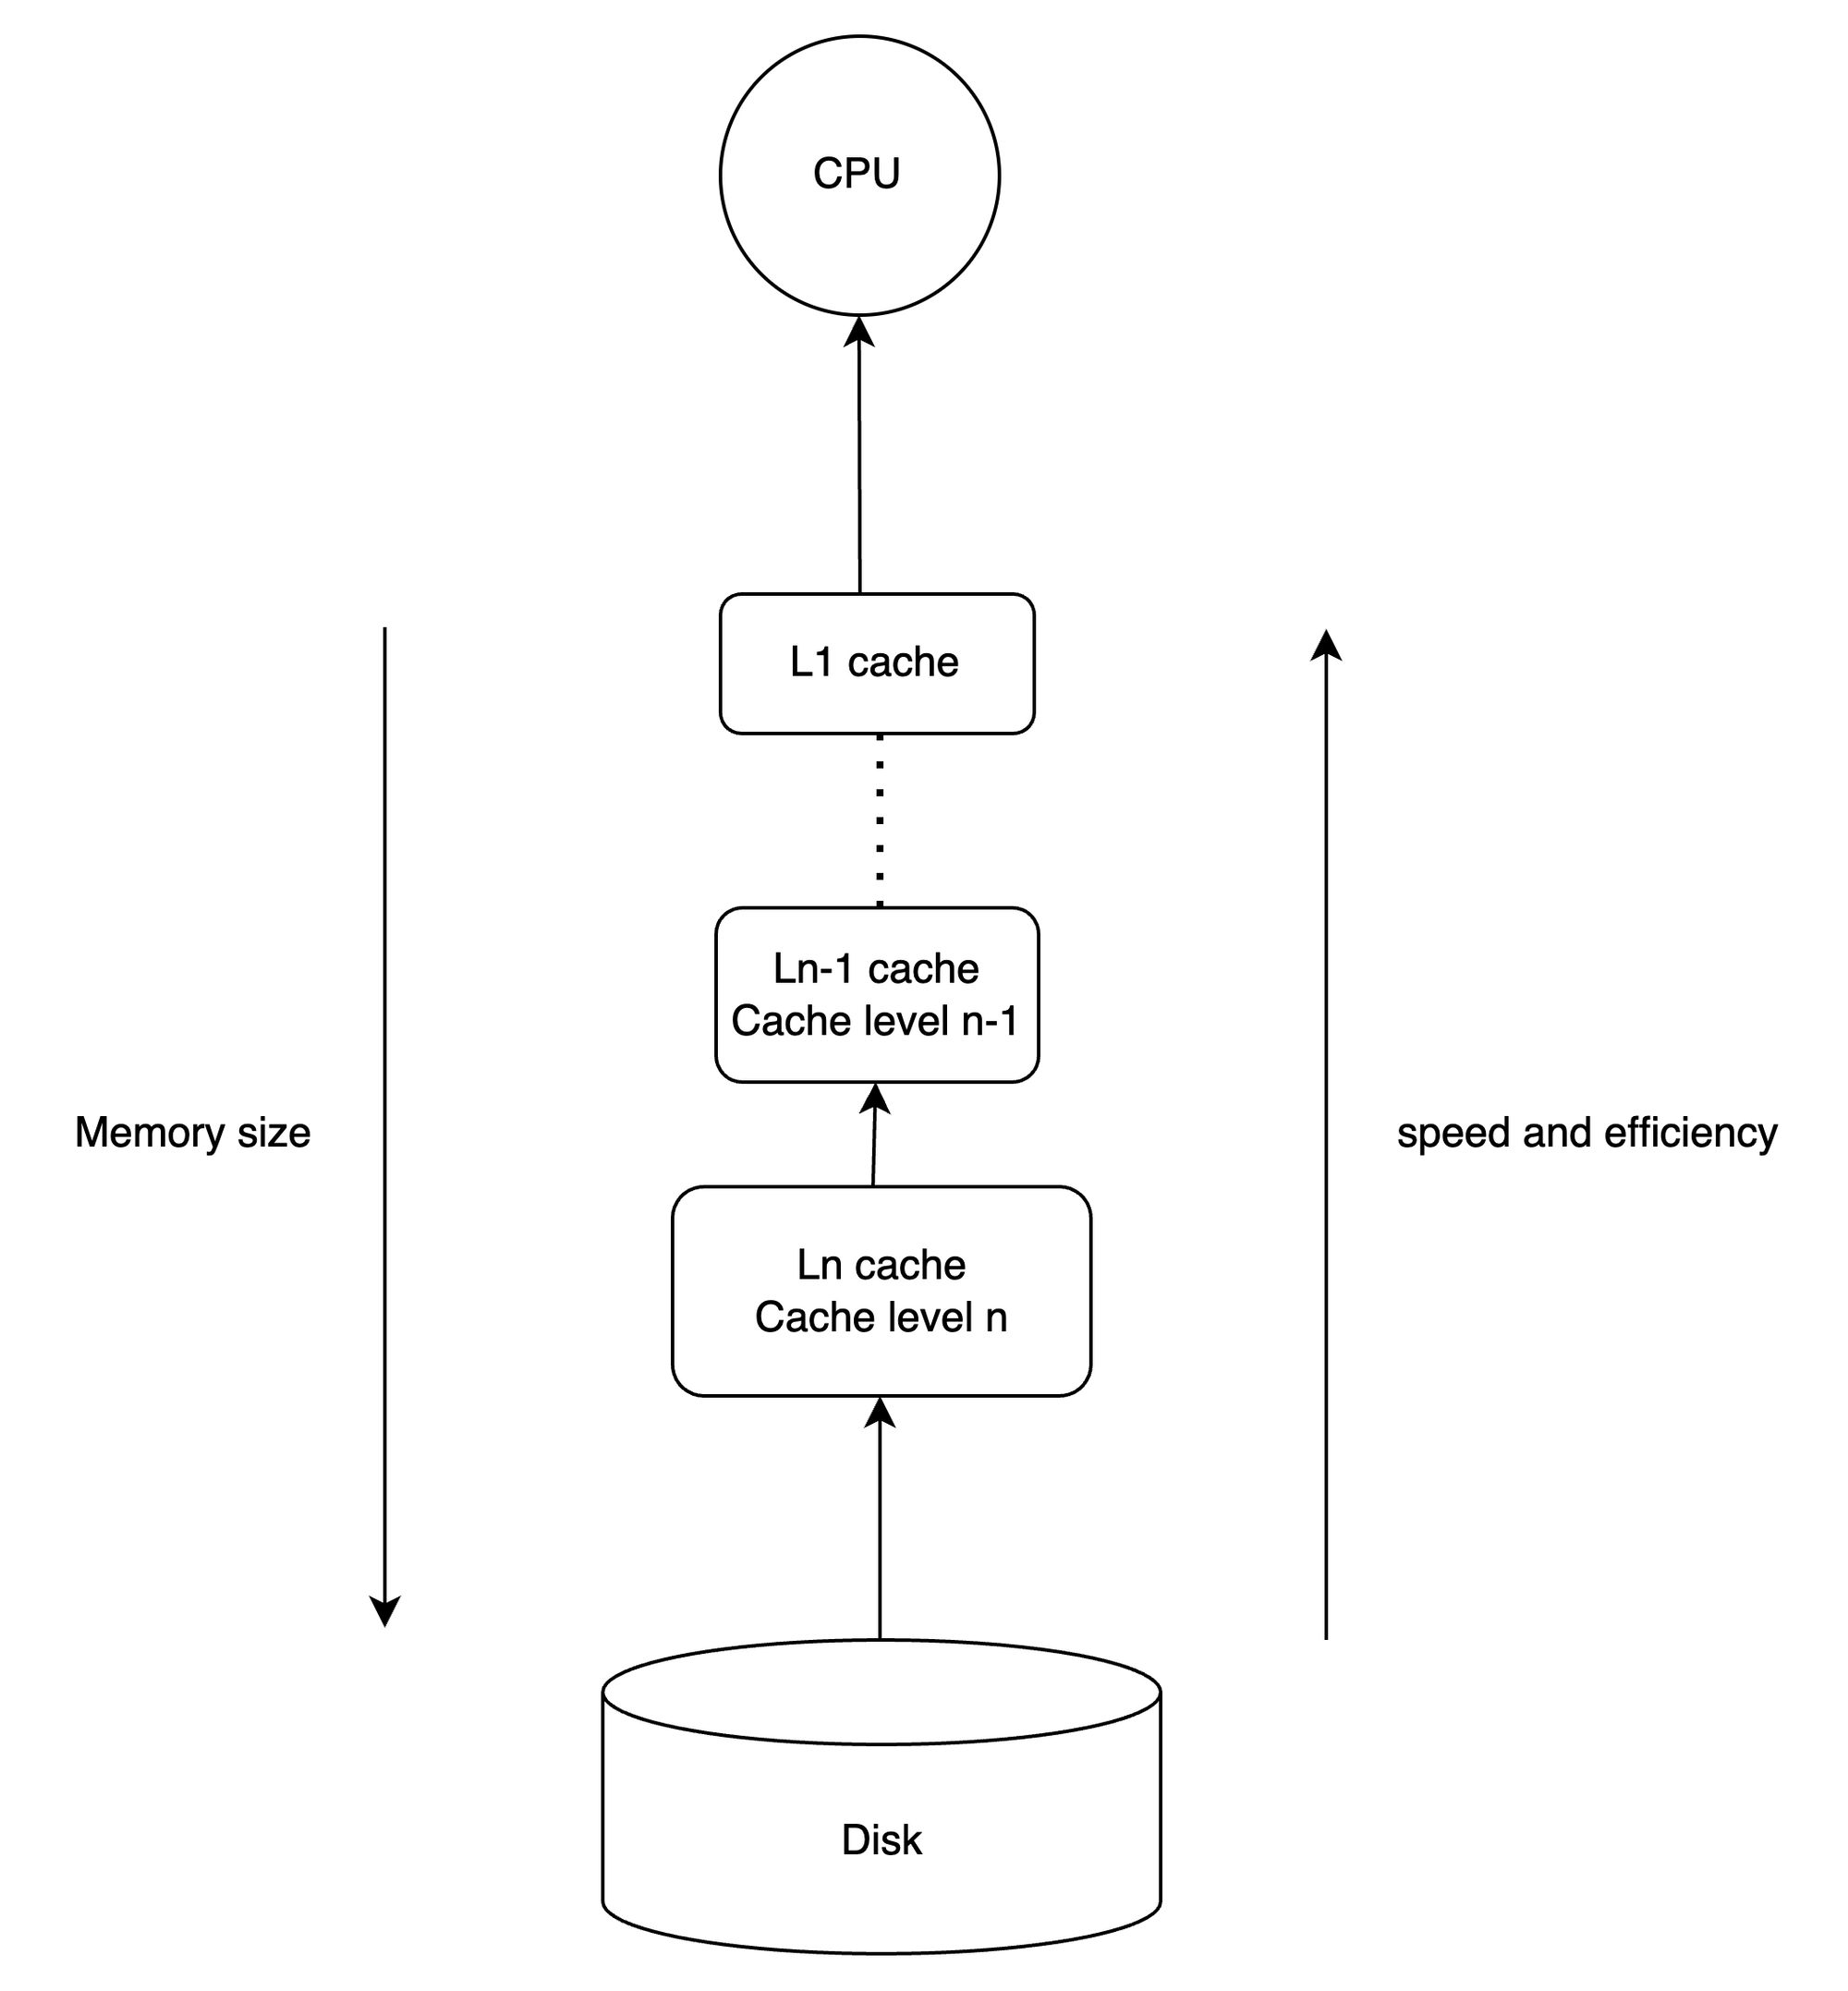 Figure 3: Flow of data from disk to CPU via cache hierarchy
As a result of being more efficient with data access, caching usually reduces power consumption and saves energy as well.
Before software can take advantage of caching, it needs to be architected so that that's possible. In general, the following steps can help you:
- The very first thing is to make sure you're on the lookout for opportunities to cache data.
- Then, implement caching. How you implement it will depend on the type of software you’re building. It might range from tiling data matrix operations to caching data retrieved from the internet for re-use later on.
- Monitor profile performance, energy and power usage – and make sure that these metrics are actually improving. It is possible with sub-optimal implementations to cause thrashing of the cache – which may increase power consumption and reduce performance.
###Design software with lifetime and updatability in mind
This article has talked a lot about your software’s energy and power consumption. Finally, there’s something else that is very important as well: the ability for your software to last a long time and be updatable.
It's very beneficial for software to last a long time, since that in turn means that devices will work well for longer. Software being updatable means that older devices get important feature and security updates, which leads to users not necessarily needing to buy newer devices just to get better software. This leads to a reduction in electronic waste and energy being spent on recycling electronic components.
Software updatability is a large topic which I will not cover in detail here. But there are some principles that you shoulder consider which will serve you well while designing for updatability:
Design your software in modules which are updatable by themselves: This may involve having strict interfaces between different modules so that on updating one module the software package as a whole still functions correctly.
Focus on using memory as efficiently as possible: If all software was designed keeping in mind memory efficiency, electronic devices would last longer, since the amount of memory they had would be sufficient for longer.
As an example, consider the iPhone: the first generation in 2007 had 128MB of RAM and 16GB of flash storage (maximum). Today, the iPhone 15 has 6GB of RAM and has a maximum storage option of 1 TB (1024GB). That is a nearly 16x increase in RAM and 64x increase in flash memory. This was needed since the amount of memory needed by applications and the operating system itself grew in size by a huge amount.
As time passes, if memory is used judiciously, we can think of a future where electronic devices last for multiple decades instead of being phased out every 5-6 years.
Testing needs to be bulletproof: When software is going to be updated frequently, there’ll be multiple version of software running on devices which interact with other pieces of software which might be older. These pieces of software must still function correctly.
For this to happen, before deploying updates, software must be tested thoroughly. As an example: when an app developer releases an app, they must test with multiple versions of operating systems to make sure that their app behaves well on all of them.
##Conclusion
This article introduced the concept of engineering software for sustainability and discussed why this is necessary.
You also learned about various metrics as well as some techniques to make your software sustainable and more efficient.
Finally, I hope it inspired you to think about a very serious problem we're facing right now and how we in the tech community can do our part.
I hope you enjoyed the article!