

If there was a way to make my applications "Application not responding" error proof, I would do it.
ANRs always seem to sneak up on you when you're not expecting them. And the problem is that there's nothing you can do about them.
You might see them pop up when seeing the overview of your application in Google Play Console. But there won’t be a lot of information there to understand how the ANR happened and what you could've done to fix the situation.
And beyond that, if a user happens to experience an ANR, you have to rely on their willingness to invest time and effort to tell you about it. We've all been on the other side, too. If you're using an application that gets stuck, the one thing you do is go straight to uninstalling it.
So, how can we as developers do everything in our power to protect our app's users from experiencing ANRs?
Let’s find out.
How to Prevent "Application Not Responding" Errors on Android
Be Proactive
Before we delve into solutions that can help us detect ANRs, let’s understand what we can do to avoid getting them in the first place (or minimizing the chance they can happen).
These points might sound obvious, but in a large enough application, it might be easy to overlook things:
First, check to see if you have places in your code that are doing extensive work on the UI thread. The work done on the UI thread should be short and relating to something with the UI of your application.
If you are doing any other logic there or perhaps even asynchronous work, delegate it to a background thread or a service
Second, if by any chance you have threads that hold locks or certain blocks of code that need to be synchronized, make sure you are not creating a deadlock or a certain state of your application reaches it
And third, if your application deals with broadcast receivers, you must verify that the execution of the onReceive method is short and ends in a timely fashion. If there is work there that can take some time, delegate it to a background thread
Another way that you can detect places that might cause ANRs is by using StrictMode. You can use it while developing your application as it catches accidental disk or network usage on the main thread.
Be Smart
You have gone over your application, and you think it isn’t at risk for any ANRs. So you release it for public consumption.
Lo and behold a couple months go by and then you start seeing reports of ANRs. What could you have done differently? As we discussed earlier, those crash reports hardly provide any information regarding the ANR.
To help your application to give you the highest level of detail that it can when an ANR occurs, I will detail two options:
- Run a thread which polls the UI thread to see if it is stuck
- On API level ≥ 30, you can use getHistoricalProcessExitReasons
Let's look at each one in detail now:
Run a thread that polls the UI thread
There is already a library called ANR-Watchdog which takes care of detecting ANRs and provides you with all the details. In case you don’t want to use it or want to have something of your own, here is a rough outline of what it does:
- Create a thread which runs on the main thread (it doesn’t have to do any actual work)
- See if the thread’s execution completes after a few seconds
- If it did, then no ANR took place and you run the thread again
- If it did not, some other thread is blocking the main thread and causing an ANR
Below is a rough outline of such a class:
package com.tomerpacific.anrdetection

import android.os.Handler
import android.os.Looper
import java.lang.Exception

class ANRHandler: Thread() {

    val TIMEOUT: Long = 5000L
    private val handler: Handler = Handler(Looper.getMainLooper())
    private val worker : Runnable = Runnable {  }

    override fun run() {
        while (!isInterrupted) {
            handler.postAtFrontOfQueue(worker)

            try {
                sleep(TIMEOUT)
            } catch (exception: Exception) {
                exception.printStackTrace()
            }

            if (handler.hasMessages(0)) {
                //worker has not finished running so the UI thread is being held
                val stackTrace: Array<StackTraceElement> = currentThread().stackTrace
                var output: String = ""
                for (element in stackTrace) {
                    output += element.className + " " + element.methodName + " " + element.lineNumber
                }

                print(output)
            }
        }
    }
}
⚠️ The execution of the runnable is always on the main thread, but since it doesn’t do any work, it is not supposed to impact your application’s performance. You could also decide to run it every desired time interval.
use getHistoricalProcessExitReasons
Option #2 can make your life simpler, as its API gives you a lot of information.
Introduced in Android 11 (API level 30), getHistoricalProcessExitReasons does exactly what you think it does. It returns a list of recorded objects that account for the most recent application terminations.
This method is called on the ActivityManager and accepts three arguments:
- The package name – of String type (can be null)
- The process’s id that belonged to the package – of int type
- The maximum number of reasons you want to get back – of int type
It’s important to note that all of these arguments can be substituted with default values. That is, you can pass null as the package name and get the entire exit reasons for the caller’s UID
So what do these recorded objects contain? Well, these objects are of ApplicationExitInfo type and they can provide you with a lot of useful information.
For starters, you could call the getReason method to find out why the process terminated. This method returns an integer marking the code for the exit reason. If the value returned is 6, that means the application was terminated because it was unresponsive due to the fact that an ANR happened.
That’s neat, but how can we see where the ANR happened? For that we can use getTraceInputStream. Like the name implies, the returned value is an InputStream of bytes which needs to be read like any other InputStream.
An example output looks like the following:
I/System.out: ----- pid 2738 at 2022-04-26 17:48:12 -----
    Cmd line: com.tomerpacific.anrdetection
    Build fingerprint: 'Android/sdk_phone_x86/generic_x86:11/RSR1.210210.001.A1/7193139:userdebug/dev-keys'
    ABI: 'x86'
    Build type: optimized
I/System.out: Zygote loaded classes=15746 post zygote classes=728
    Dumping registered class loaders
    #0 dalvik.system.PathClassLoader: [], parent #1
    #1 java.lang.BootClassLoader: [], no parent
I/System.out: #2 dalvik.system.PathClassLoader: [/data/app/~~C_0mqw-g_9cjPjIR_kpRIg==/com.tomerpacific.anrdetection-3-t-I6JR9Q3QA6UY7L8iPA==/base.apk], parent #1
    Done dumping class loaders
    Classes initialized: 302 in 19.361ms
    Intern table: 31490 strong; 543 weak
    JNI: CheckJNI is on; globals=637 (plus 31 weak)
I/System.out: Libraries: libandroid.so libaudioeffect_jni.so libcompiler_rt.so libicu_jni.so libjavacore.so libjavacrypto.so libjnigraphics.so libmedia_jni.so libopenjdk.so librs_jni.so libsfplugin_ccodec.so libsoundpool.so libstats_jni.so libwebviewchromium_loader.so (14)
    Heap: 91% free, 2330KB/26MB; 67022 objects
    Dumping cumulative Gc timings
I/System.out: Average major GC reclaim bytes ratio inf over 0 GC cycles
    Average major GC copied live bytes ratio 0.738176 over 4 major GCs
    Cumulative bytes moved 11482280
    Cumulative objects moved 217937
    Peak regions allocated 28 (7168KB) / 768 (192MB)
I/System.out: Start Dumping histograms for 1 iterations for young concurrent copying
    ProcessMarkStack:    Sum: 26.311ms 99% C.I. 26.311ms-26.311ms Avg: 26.311ms Max: 26.311ms
    ScanImmuneSpaces:    Sum: 5.625ms 99% C.I. 5.625ms-5.625ms Avg: 5.625ms Max: 5.625ms
    VisitConcurrentRoots:    Sum: 1.121ms 99% C.I. 1.121ms-1.121ms Avg: 1.121ms Max: 1.121ms
I/System.out: (Paused)ClearCards:    Sum: 375us 99% C.I. 7us-235us Avg: 28.846us Max: 235us
    GrayAllDirtyImmuneObjects:    Sum: 329us 99% C.I. 329us-329us Avg: 329us Max: 329us
    VisitNonThreadRoots:    Sum: 327us 99% C.I. 327us-327us Avg: 327us Max: 327us
I/System.out: InitializePhase:    Sum: 306us 99% C.I. 306us-306us Avg: 306us Max: 306us
    (Paused)GrayAllNewlyDirtyImmuneObjects:    Sum: 164us 99% C.I. 164us-164us Avg: 164us Max: 164us
    (Paused)FlipCallback:    Sum: 144us 99% C.I. 144us-144us Avg: 144us Max: 144us
    SweepSystemWeaks:    Sum: 142us 99% C.I. 142us-142us Avg: 142us Max: 142us
I/System.out: ScanCardsForSpace:    Sum: 125us 99% C.I. 125us-125us Avg: 125us Max: 125us
    ThreadListFlip:    Sum: 96us 99% C.I. 96us-96us Avg: 96us Max: 96us
    ClearFromSpace:    Sum: 78us 99% C.I. 78us-78us Avg: 78us Max: 78us
    CopyingPhase:    Sum: 76us 99% C.I. 76us-76us Avg: 76us Max: 76us
I/System.out: FlipOtherThreads:    Sum: 58us 99% C.I. 58us-58us Avg: 58us Max: 58us
    ProcessReferences:    Sum: 54us 99% C.I. 19us-35us Avg: 27us Max: 35us
    SweepArray:    Sum: 53us 99% C.I. 53us-53us Avg: 53us Max: 53us
I/System.out: EnqueueFinalizerReferences:    Sum: 38us 99% C.I. 38us-38us Avg: 38us Max: 38us
    RecordFree:    Sum: 37us 99% C.I. 14us-23us Avg: 18.500us Max: 23us
    ForwardSoftReferences:    Sum: 25us 99% C.I. 25us-25us Avg: 25us Max: 25us
    FlipThreadRoots:    Sum: 21us 99% C.I. 21us-21us Avg: 21us Max: 21us
I/System.out: (Paused)SetFromSpace:    Sum: 19us 99% C.I. 19us-19us Avg: 19us Max: 19us
    ResumeRunnableThreads:    Sum: 12us 99% C.I. 12us-12us Avg: 12us Max: 12us
    EmptyRBMarkBitStack:    Sum: 8us 99% C.I. 8us-8us Avg: 8us Max: 8us
    SwapBitmaps:    Sum: 7us 99% C.I. 7us-7us Avg: 7us Max: 7us
    Done Dumping histograms
    young concurrent copying paused:    Sum: 750us 99% C.I. 750us-750us Avg: 750us Max: 750us
I/System.out: young concurrent copying freed-bytes: Avg: 1052KB Max: 1052KB Min: 1052KB
    Freed-bytes histogram: 960:1
    young concurrent copying total time: 35.641ms mean time: 35.641ms
    young concurrent copying freed: 8956 objects with total size 1052KB
I/System.out: young concurrent copying throughput: 255886/s / 29MB/s  per cpu-time: 179578666/s / 171MB/s
    Average minor GC reclaim bytes ratio 0.742269 over 1 GC cycles
    Average minor GC copied live bytes ratio 0.276211 over 2 minor GCs
    Cumulative bytes moved 1410368
    Cumulative objects moved 26626
I/System.out: Peak regions allocated 28 (7168KB) / 768 (192MB)
    Total time spent in GC: 35.641ms
    Mean GC size throughput: 28MB/s per cpu-time: 169MB/s
    Mean GC object throughput: 251284 objects/s
    Total number of allocations 75978
    Total bytes allocated 3382KB
    Total bytes freed 1052KB
I/System.out: Free memory 23MB
    Free memory until GC 23MB
    Free memory until OOME 189MB
    Total memory 26MB
    Max memory 192MB
    Zygote space size 3040KB
    Total mutator paused time: 750us
I/System.out: Total time waiting for GC to complete: 80.600us
    Total GC count: 1
    Total GC time: 35.641ms
    Total blocking GC count: 0
    Total blocking GC time: 0
    Histogram of GC count per 10000 ms: 0:1
    Histogram of blocking GC count per 10000 ms: 0:1
    Native bytes total: 15621964 registered: 98204
I/System.out: Total native bytes at last GC: 15537168
    /system/framework/oat/x86/android.hidl.manager-V1.0-java.odex: quicken
    /system/framework/oat/x86/android.test.base.odex: quicken
    /system/framework/oat/x86/android.hidl.base-V1.0-java.odex: quicken
I/System.out: Current JIT code cache size (used / resident): 0KB / 32KB
    Current JIT data cache size (used / resident): 4KB / 32KB
    Zygote JIT code cache size (at point of fork): 45KB / 48KB
    Zygote JIT data cache size (at point of fork): 33KB / 36KB
    Current JIT mini-debug-info size: 26KB
I/System.out: Current JIT capacity: 64KB
    Current number of JIT JNI stub entries: 0
    Current number of JIT code cache entries: 48
    Total number of JIT compilations: 6
    Total number of JIT compilations for on stack replacement: 1
I/System.out: Total number of JIT code cache collections: 0
    Memory used for stack maps: Avg: 35B Max: 52B Min: 28B
    Memory used for compiled code: Avg: 125B Max: 257B Min: 69B
    Memory used for profiling info: Avg: 70B Max: 188B Min: 20B
    Start Dumping histograms for 48 iterations for JIT timings
    Compiling:    Sum: 385.780ms 99% C.I. 0.556ms-25.610ms Avg: 8.037ms Max: 25.610ms
I/System.out: TrimMaps:    Sum: 44.431ms 99% C.I. 2.400us-5148us Avg: 925.645us Max: 5643us
    Done Dumping histograms
    Memory used for compilation: Avg: 83KB Max: 322KB Min: 8560B
    ProfileSaver total_bytes_written=0
    ProfileSaver total_number_of_writes=0
    ProfileSaver total_number_of_code_cache_queries=0
I/System.out: ProfileSaver total_number_of_skipped_writes=0
    ProfileSaver total_number_of_failed_writes=0
    ProfileSaver total_ms_of_sleep=5000
    ProfileSaver total_ms_of_work=0
I/System.out: ProfileSaver total_number_of_hot_spikes=5
    ProfileSaver total_number_of_wake_ups=0
I/System.out: suspend all histogram:    Sum: 11.468ms 99% C.I. 0.018ms-10.658ms Avg: 1.042ms Max: 11.094ms
    DALVIK THREADS (15):
    "main" prio=5 tid=1 Runnable
      | group="main" sCount=0 dsCount=0 flags=0 obj=0x72107008 self=0xe7d05410
      | sysTid=2738 nice=-10 cgrp=top-app sched=0/0 handle=0xf6267478
I/System.out:   | state=R schedstat=( 5812106631 1041760011 2536 ) utm=535 stm=45 core=0 HZ=100
      | stack=0xff7cb000-0xff7cd000 stackSize=8192KB
      | held mutexes= "mutator lock"(shared held)
        at com.tomerpacific.anrdetection.MainActivity$onCreate$1$1.onClick(MainActivity.kt:18)
        at android.view.View.performClick(View.java:7448)
        at android.view.View.performClickInternal(View.java:7425)
I/System.out:     at android.view.View.access$3600(View.java:810)
        at android.view.View$PerformClick.run(View.java:28305)
I/System.out:     at android.os.Handler.handleCallback(Handler.java:938)
        at android.os.Handler.dispatchMessage(Handler.java:99)
        at android.os.Looper.loop(Looper.java:223)
        at android.app.ActivityThread.main(ActivityThread.java:7656)
I/System.out:     at java.lang.reflect.Method.invoke(Native method)
        at com.android.internal.os.RuntimeInit$MethodAndArgsCaller.run(RuntimeInit.java:592)
        at com.android.internal.os.ZygoteInit.main(ZygoteInit.java:947)
This is only a partial snippet of all the output, but you can see that it provides a ton of information, including:
- Free memory/Total memory/Max memory
- Heap diagnostic (percentage free, size and amount of objects allocated)
- The stacktrace of the main thread
Other useful methods include:
- getTimestamp – the timestamp of when the process terminated
- getDescription – a system description of why the process terminated
Be Resourceful
If your application does suffer from ANRs, solving them can be quite tricky. This can be because you're not getting a complete stacktrace (or not having one at all), you're not able to reproduce it, or it's happening on some esoteric device. Well, what can you do?
In Android Studio version ≥ 3.2, you have a utility called CPU Profiler. This tool lets you inspect your thread activity during the runtime of your application. With it, you might find out which threads are running, for how long, and where they are running.
To use it, inside Android Studio, go to View → Tool Window → Profiler:
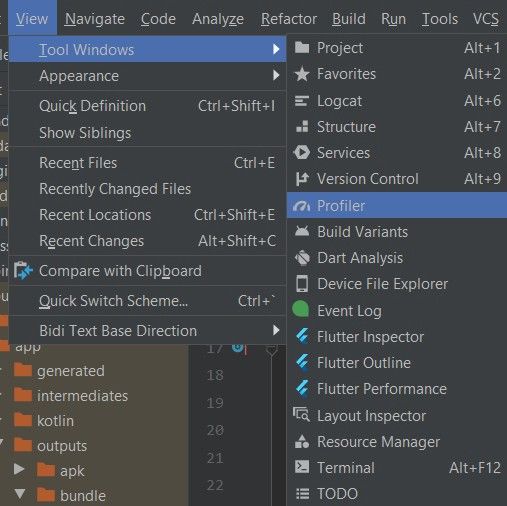
A window will open at the bottom of the screen. Once you attach a process to it, you will see three timelines:
- Event timeline
- CPU timeline
- Thread timeline
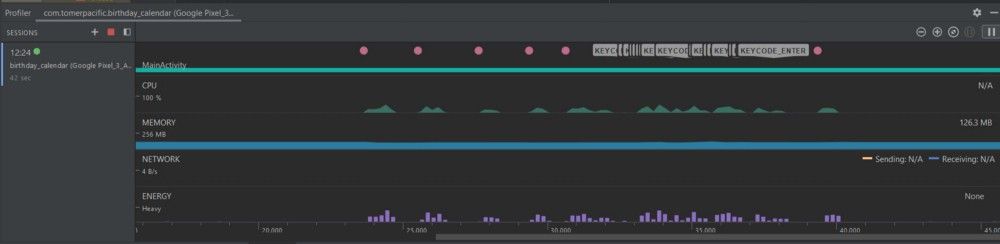
You want to focus on the Thread timeline to see if anything is out of the ordinary there. Each thread’s activity can be identified by three colors:
- Green – indicates that the thread is running or in a runnable state
- Yellow – indicates that the thread is waiting for the execution of some I/O operation
- Gray – indicates the thread is sleeping
Wrapping Up
Hopefully you have gained some confidence in making your applications as ANR-proof as you can. Using the tools and techniques listed above may help prevent your application’s next ANR.
You are welcome to check out some of my other articles on GitHub: