Amazon Elastic Container Service (ECS) is a container orchestration service provided by Amazon Web Services (AWS). It is a solution developed by AWS to take care of the problem of managing large clusters of containers.
Why Use ECS?
There are other container orchestration tools, each with its merits, but ECS is made for AWS and provides seamless integration into the AWS ecosystem. You can use it with AWS Elastic Load Balancer (ELB), AWS Identity and Access Management (IAM), AWS CloudTrail, store persistent data in the AWS Elastic Block Store, or monitor it with AWS CloudWatch.
You can also use it with AWS Fargate, which is a serverless compute engine that provides fully managed containers.
What is Monitoring?
Monitoring is the process of tracking and observing the performance, availability and overall health of your resources, services, and applications. This helps to detect and troubleshoot issues before they impact users, improve application reliability and availability, optimize resource utilization and enhance the security of your applications.
It’s just a way to make sure all the infrastructure is running the way it is supposed to. It also helps you to know how much traffic your app is receiving if it’s a web app or website, and what is really going on with it.
There are different aspects of monitoring, some of which include:
Performance monitoring: Here, we track and monitor the performance metrics of infrastructure, such as CPU usage, memory consumption, disk, I/O, and networks, and so on.
Error and log monitoring: Here, we collect and analyze logs and error messages.
Availability monitoring: We ensure that the systems are up and running.
Security monitoring: We also track and monitor security-related events and activities to respond to potential threats and vulnerabilities. Monitoring can help you detect things like a DoS attack by identifying unusual patterns in incoming traffic.
What Do You Monitor on ECS?
In cloud monitoring, metrics are used to monitor the health and performance of the infrastructure. They are used together with dimensions. Metrics are the data points collected and monitored to measure the performance, health, and usage of your cloud resources and services.
Dimensions are attributes and characteristics that help to filter, categorize and give context to metrics. They are represented in the form of key/value pairs.
Amazon ECS provides various metrics for monitoring resources. Some of them include:
CPUReservation: This is the percentage of CPU units reserved by running tasks.
MemoryReservation: Percentage of memory reserved by running tasks.
CPUUtilization: This is the percentage of CPU units used by running tasks.
MemoryUtilization: This is the percentage of memory used by running tasks.
ContainerInstances: This is the number of container instances in the cluster.
RunningTasksCount: The number of tasks that are running currently in the cluster.
Amazon ECS also provides dimensions, some of which are:
ContainerName: The name of the container.
ClusterName: The name of the ECS cluster.
ServiceName: The name of the service
ServiceNameSpace: The namespace used to group a set of services in a cluster.
InstanceType: This refers to the type of EC2 instance used. For example: t2.micro, c4.large, r5.xlarge, and so on.
TaskID: The unique identifier assigned to each task.
In AWS ECS, you can monitor your resources at different levels. For example, at the cluster level, you can look at things like CPUUtilization, CPUReservation, MemoryUtilization, and MemoryReservation. At the service level, you can see things like CPUUtilization and MemoryUtilization.
How Do You Monitor ECS**?**
You can do this by making use of:
Amazon CloudWatch: This is a monitoring service by AWS that allows you to collect, analyze and visualize data from your AWS resources. It also helps you to set up alarms and be notified when a threshold is reached.
AWS Management Console: You can also view your cluster or service metrics directly on the management console.
The ECS API: The ECS API provides programmatic access to the ECS service so you can use it to create, modify and monitor clusters and resources from outside AWS.
Third party tools: There are third-party tools like Datadog, Prometheus, and others that can be used to monitor these metrics. Some of them will work seamlessly with AWS, some will require you to install an agent.
For monitoring of ECS on EC2 instances, you have direct access to the underlying EC2 instances, and can use traditional server monitoring tools to monitor metrics on the OS. For ECS on Fargate however, you don't have access to the EC2 instances.
How to Monitor ECS Clusters With AWS CloudWatch
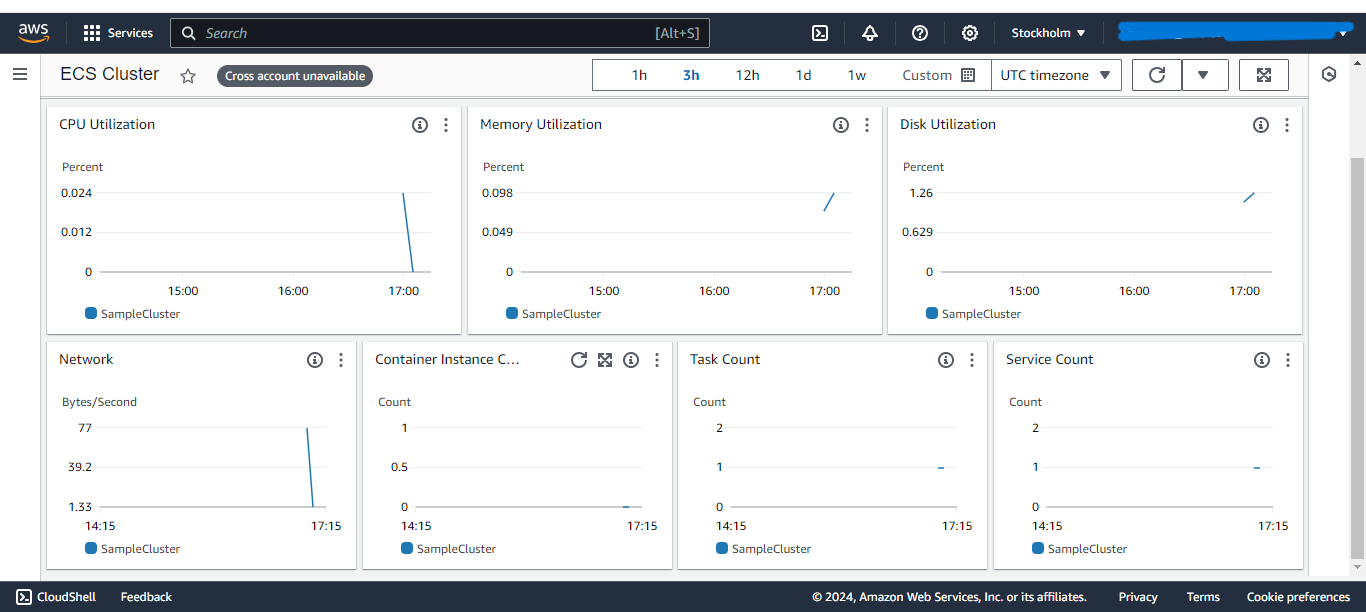
With AWS CloudWatch, you can monitor your ECS clusters in many ways, from metrics to logs to setting up alarms. In this guide, I’ll show you how to use the Automatic Dashboards to view ECS cluster metrics. To do that, follow these steps:
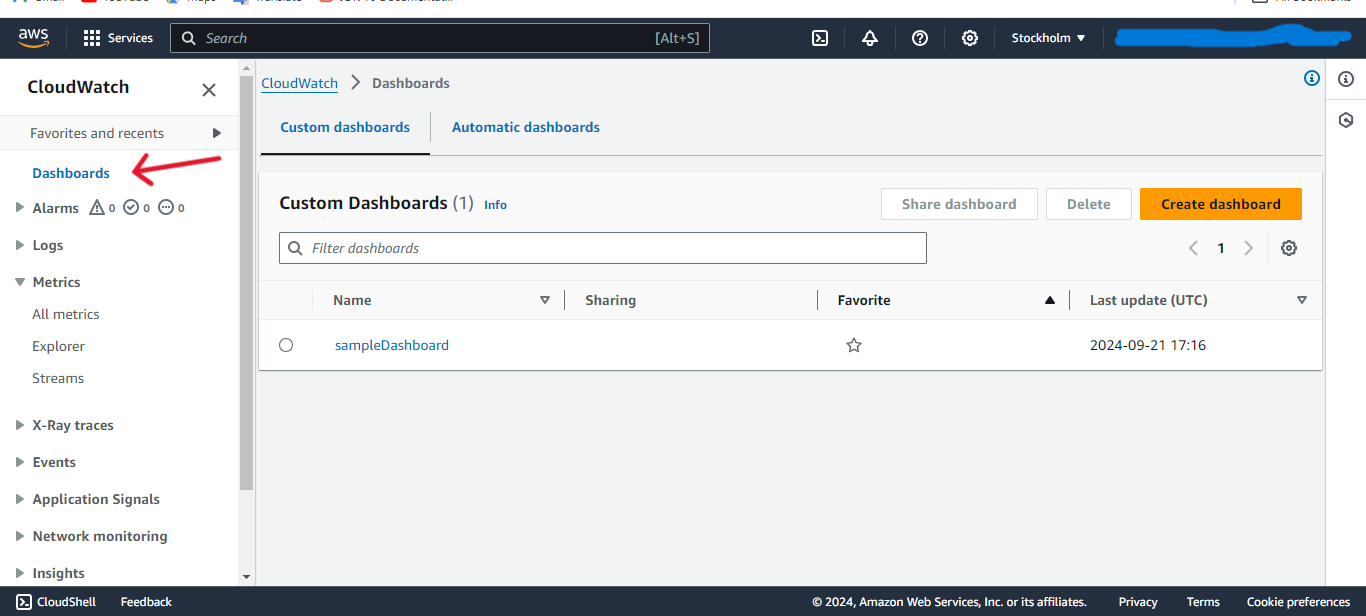
- From the AWS Management Console, open CloudWatch and go to Dashboards on the sidebar.
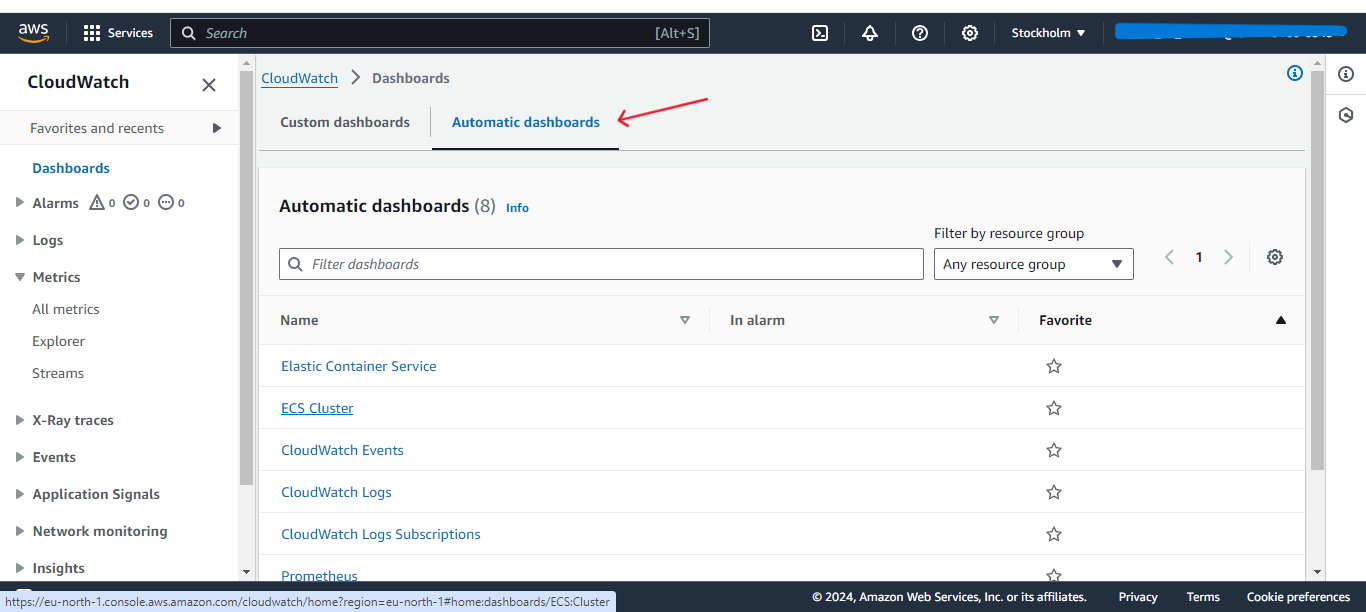
- Click on the Automatic Dashboards tab.
- Click on ECS Cluster. This will take you to the dashboard where you’ll see the pre-configured metrics for your ECS clusters.
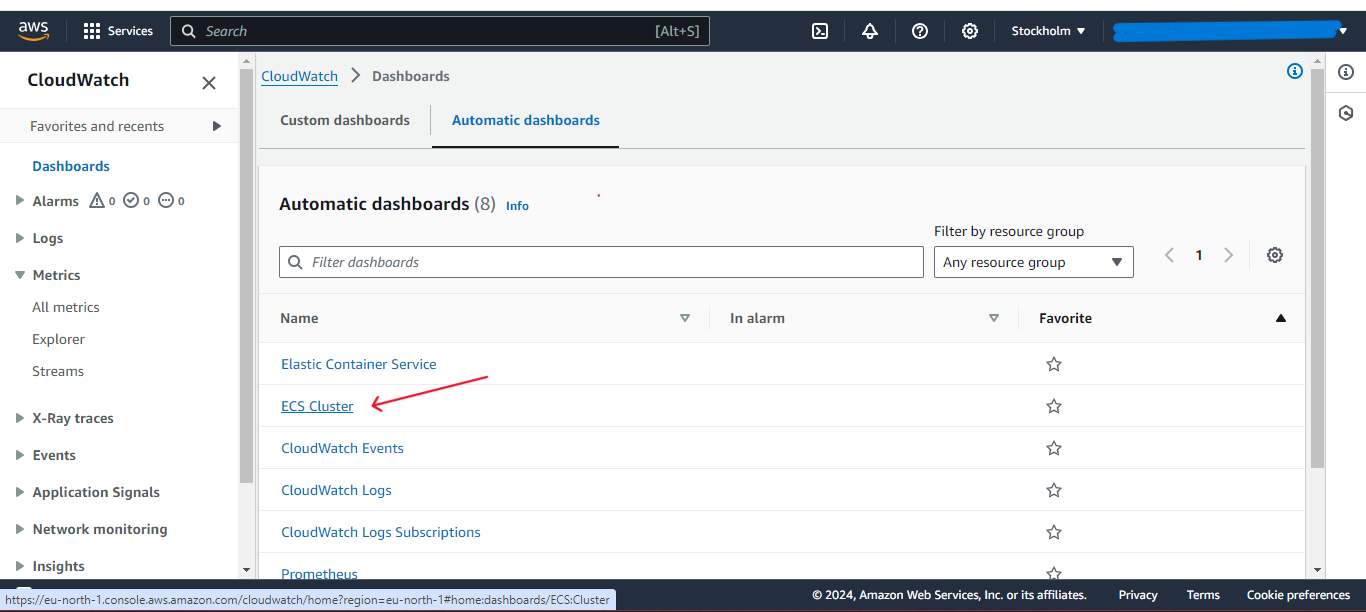
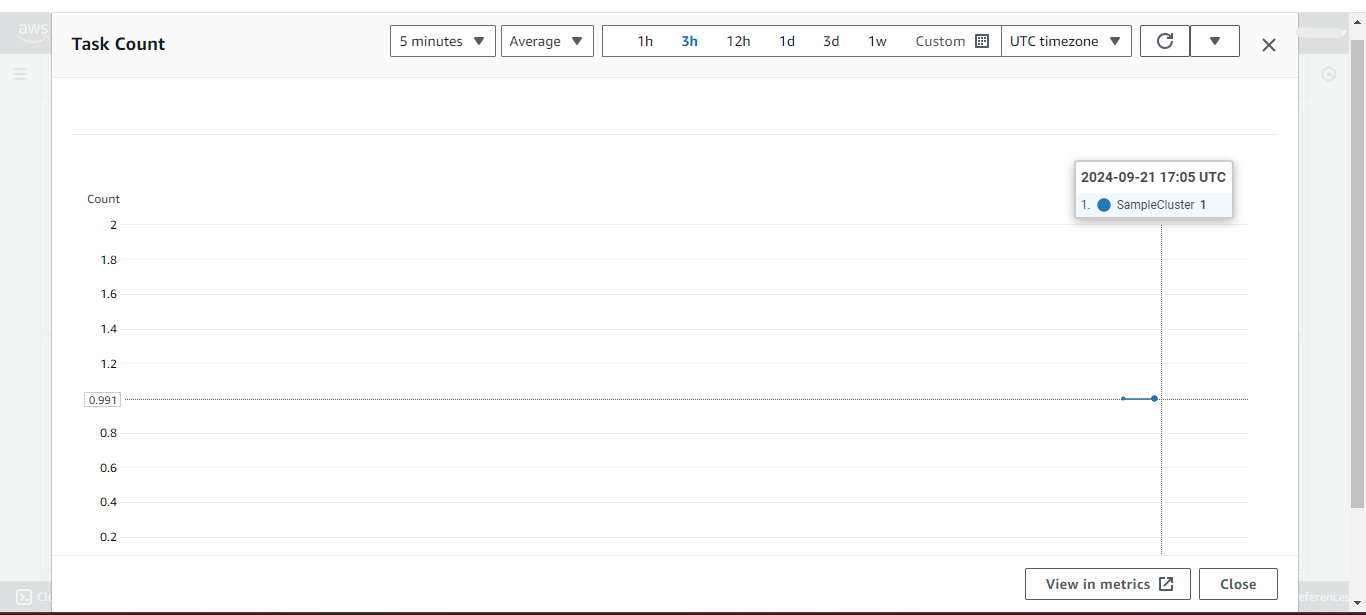
You can also expand individual metrics.
Wrapping Up
In this article, you learned about ECS monitoring. You learned about the different metrics you can monitor and how to monitor them.
Lastly, you learned how to monitor ECS clusters using AWS CloudWatch.
Thanks for reading. You can connect with me on LinkedIn or follow me on X.

