
By Ignacio Chavarria
Uber and Cabify, the leading non-taxi rideshare companies in Latin America, both charge minimum fares. Only Uber has implemented time charges.
After running a simulation of 72,000 trips, we were able to observe the financial impact of opting in — or out of — features that we identify as valuable tools that hedge both ends of the partner-driver risk curve.
The partner-driver risk curve
Let’s assume that Company XYZ only charges by the kilometre and a base fare called banderazo in Colombia, and bandeirada in Brazil. By the way, base fare is not the same as minimum fare.
For a driver using Company XYZ’s app, all trips are not equal. The following graph shows how a driver’s risk will vary at different trip lengths and speed, when only charging by distance. The graph assumes that all other factors for the trip are the same.
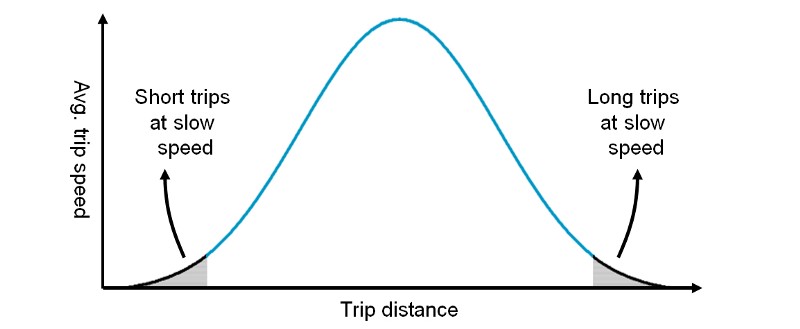 As you move right across the X-axis, the distance of trips gets longer. Moving up the Y-axis means that cars are moving at higher average speeds. Drivers’ risk for Company XYZ increases in the opposite direction relative to average trip speed. This is because drivers spend more time on trips without charging for it. This graph is not meant to imply that trips follow a Gaussian distribution. Trips likely follow a right-skewed, Pareto-like distribution, as shown in the simulation below.
As shown above, Company XYZ drivers probably dislike both short trips travelling at slow speeds (due to heavy traffic, client stops, or other reasons) and especially long trips travelling at slow speeds. Long trips at slow speeds pose a much higher risk to Company XYZ’s drivers, forcing them to assume the opportunity cost (and gas expense) of time spent in traffic. When drivers do not charge for time, this tail risk is placed directly on them.
Simulating rideshare trips in Kanyeville
For the remainder of this study, we’ll use data obtained in one month from a simulation we ran for an imaginary market called Kanyeville (yes, named after Yeezy).
The simulation runs with the following assumptions:
- The distance of trips follow a right-skewed distribution
- Mean trip distance equals 4 km
- 20% of trips have a slow average speed of 5 km/hr, while 80% have normal average speed of 40 km/hr
- Each rideshare company in Kville (how locals call it) has an average of 200 daily active drivers. Each driver makes an average of twelve trips per day, totalling 72,000 trips per month, per company.
 _Data generated using [SciPy](https://www.scipy.org/" rel="noopener" target="blank" title=")
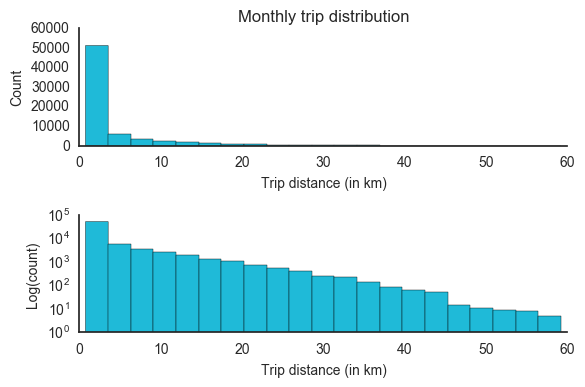
The first chart shows trip distribution, by distance, at normal scale. The second uses a logarithmic scale to increase the visibility of the curve’s tail. In the log graph, the high variance in the tail, indicating that long trips, those above the mean-trip distance (MTD), can vary highly. In this sample, drivers drove trips that were as far as 60 km.
In this study, we analyzed two pricing features that impact different ends of the curve. Minimum fares increase monetization at the front-end of the curve (where short trips are found — meaning those under the MTD make up about 80% of total trips). Time charges have their highest positive impact on the curve’s tail, where longer trips are found.
Sure, time charges affect all trips. Anyone who’s been in a car knows the difference between being stuck in traffic while driving a couple of blocks and being stuck in a traffic jam while on the highway. Now imagine being a rideshare driver who only gets paid by the distance. We’ll also measure what this difference means financially to drivers.
The impact of the minimum fare
To measure the impact of minimum fare, the following script simulates the value of drivers’ fares over a month, with and without a minimum fare (MF):
Simulation results are shown in the illustration below. Daily gross fares are compared from different perspectives. Each scenario assumes a charge of $0.50/km and a $2.50 minimum fare:
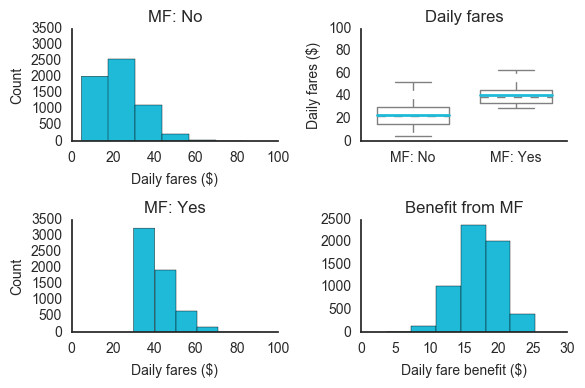
The plots on the left compare the frequency distributions for daily fares. The minimum fares shift from the front end of the curve towards higher values. The gap in the graph on the top right shows how mean daily fares nearly double because a minimum fare is charged. Finally, the bottom-right plot shows the daily benefit, in dollars, from minimum fares. It shows a mean daily benefit of around $17 per driver. To be clear, these are the values of daily gross fare and have not been adjusted for company commissions.
In terms of cumulative probability, the following graph compares the curves of daily fare values for scenarios with and without a minimum fare:
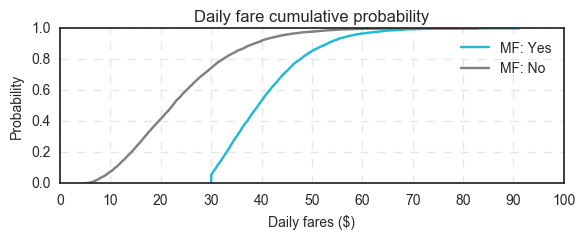
The benefits of minimum fares are once again very clear. Nearly 50% of Kanyeville drivers make over $40/day in gross fares when they charge minimum fares. Only 10% of drivers who do not charge minimum fare make over $40/day.
These results make a good argument for minimum fares. This is probably why minimum fares are so common. But what about the impact of charging by the minute? We’ll take a look at that in the next section.
The impact of time charges
To measure the impact of charging by the second, the script below ran to simulate a month’s worth of individual trip fares, per driver, with and without a time charge:
Note: In this section, we imagine that there are two rideshare companies in Kanyeville: Company U and Company C. The only difference between their pricing structure is that the former has a $0.05/minute time charge.
Simulation results are shown in the four graphs below. Individual trip fares are compared between the two companies. One company only charges by distance ($0.50/km) and the other charges by both distance and time ($0.50/km and $0.05/minute):
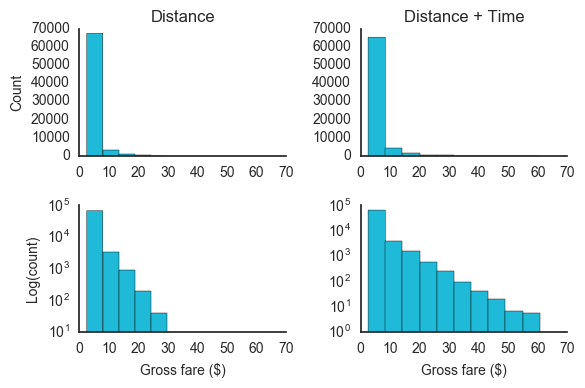 Top left: Shows trip-fare frequency distribution when companies charge by distance only. Top right: Shows the trip-fare frequency distribution when companies charge by both distance and time. Bottom left: Same as top left graph, but on a log scale. Bottom right: Same as top right graph, but on a log scale.
In the graph above, the top row compares trip-fare frequency distributions between two companies. One company charges only for the distance of the trip (top left). Another company charges for both distance and time (top right). The second row uses a log scale to increase the visibility of the tail for both curves.
Why log the results? Because at normal scale, both distributions appear similar (with most fare price occurrences at the front of the curves). At log scale, the impact of the time charge is much clearer. The longer tail shows a larger number of high-fare trips. It’s important to note that for the companies represented in this graph, the mean fare values were $3.50 and $4.00, respectively. This indicates a 14% increase in average fares.
The plots below split low-fare trips from high-fare trips, for both pricing models, to review the change in mean and maximum-trip fares.
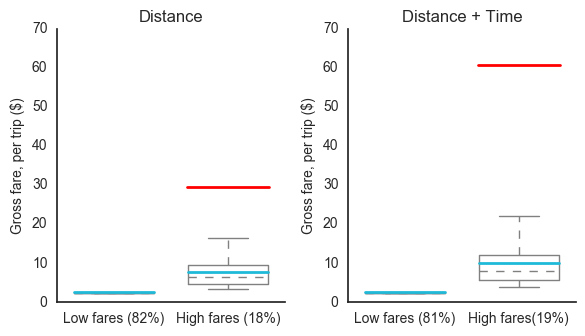
The time charge barely had an impact on low-fare trips (those below the mean), where it increased mean fares by roughly only 1%. However, the time charge played a crucial role on high-fare trips, where it increased mean fares by 31% and doubled the maximum-fare values.
Further, the following violin plots split the data by pricing structure, trip distance, and trip speed:
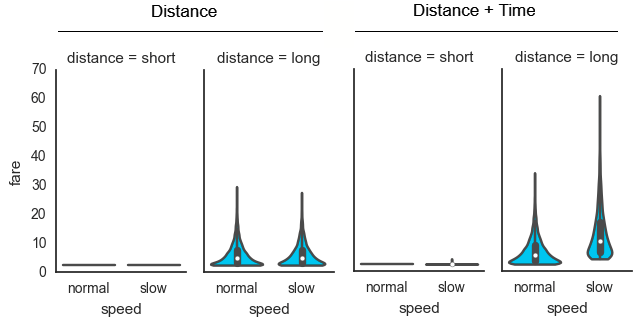
As expected, long distance trips with slow average speeds saw the highest increase in fare price — more than double — when a time charge was added. Out of the $41K in total monthly fares in this simulation, 66% came from long, slow trips. These occurred only 5% of the time.
The frequency of fare increases can be succinctly summarized in the following:
- There was no fare increase 60% of the time
- There was a 4% average fare increase, 15% of the time
- There was a 14% average fare increase, 20% of the time
- There was a 119% average fare increase, 5% of the time
The odds of seeing a fare increase can be better observed in the following cumulative probability graph:
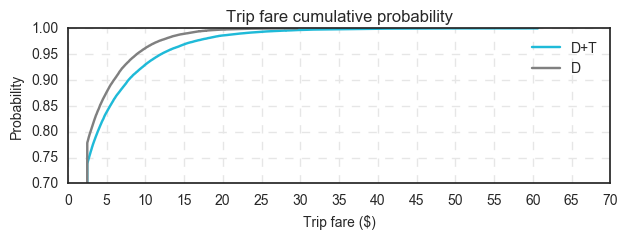
The rider experience remains mostly the same. Only rarely (5% of the time) do high price increases kick in. However, for drivers, when that increase kicks in, it acts as a hedge. The increase effectively reduces the impact that heavy traffic and/or rider stops would otherwise have on the drivers’ daily income.
Essentially, when a rideshare company adds a time charge to its pricing model, it embraces long-tail events. This includes long trips in high traffic, which mostly favor drivers (who take a greater percentage of the fares). Companies that only charge by distance remain fragile to these events. The long-tail event risks are transferred completely to the drivers, who have to assume additional costs — such as gas, opportunity cost of their time, and wear and tear of their cars — without making any extra revenue.
Sure, the second company might argue that they purposely favor the rider by having the driver assume the tail risk. But one must wonder if this is actually sustainable. After all, riders and drivers have asymmetric impacts on the operations of their company.
A good way to quantify this asymmetry is to observe the stark difference that rideshare companies will pay for new riders and drivers. For example, some companies will hurl cash at their competitors’ drivers to get them to try their app — I’ve seen offers go as high as $500/driver — but, has anyone ever offered as much to a rider?
I’ve never seen a new rider get offered more than $25. But let’s say $50 was offered. That number still values a driver 10 times more than a rider. With that in mind, it makes sense for rideshare companies to protect their higher value users — the drivers — by transferring the tail risk to the riders.
Thanks for reading! If you enjoyed the article, hold down the ? button below to help spread the word.
You can find the code repository on my Github. Use it to run your own pricing simulations!
If you have questions about either implementing it for your own analysis, or want to collaborate on a future article, or simply wanna say “Hi”, hit me up on Twitter and/or LinkedIn.