
Open a terminal on any systemd machine and run this:
systemd-analyze
On the laptop I'm writing this on, it says:
Startup finished in 5.855s (firmware) + 8.469s (loader) + 3.106s (kernel)
+ 12.181s (userspace) = 29.613s
graphical.target reached after 12.175s in userspace
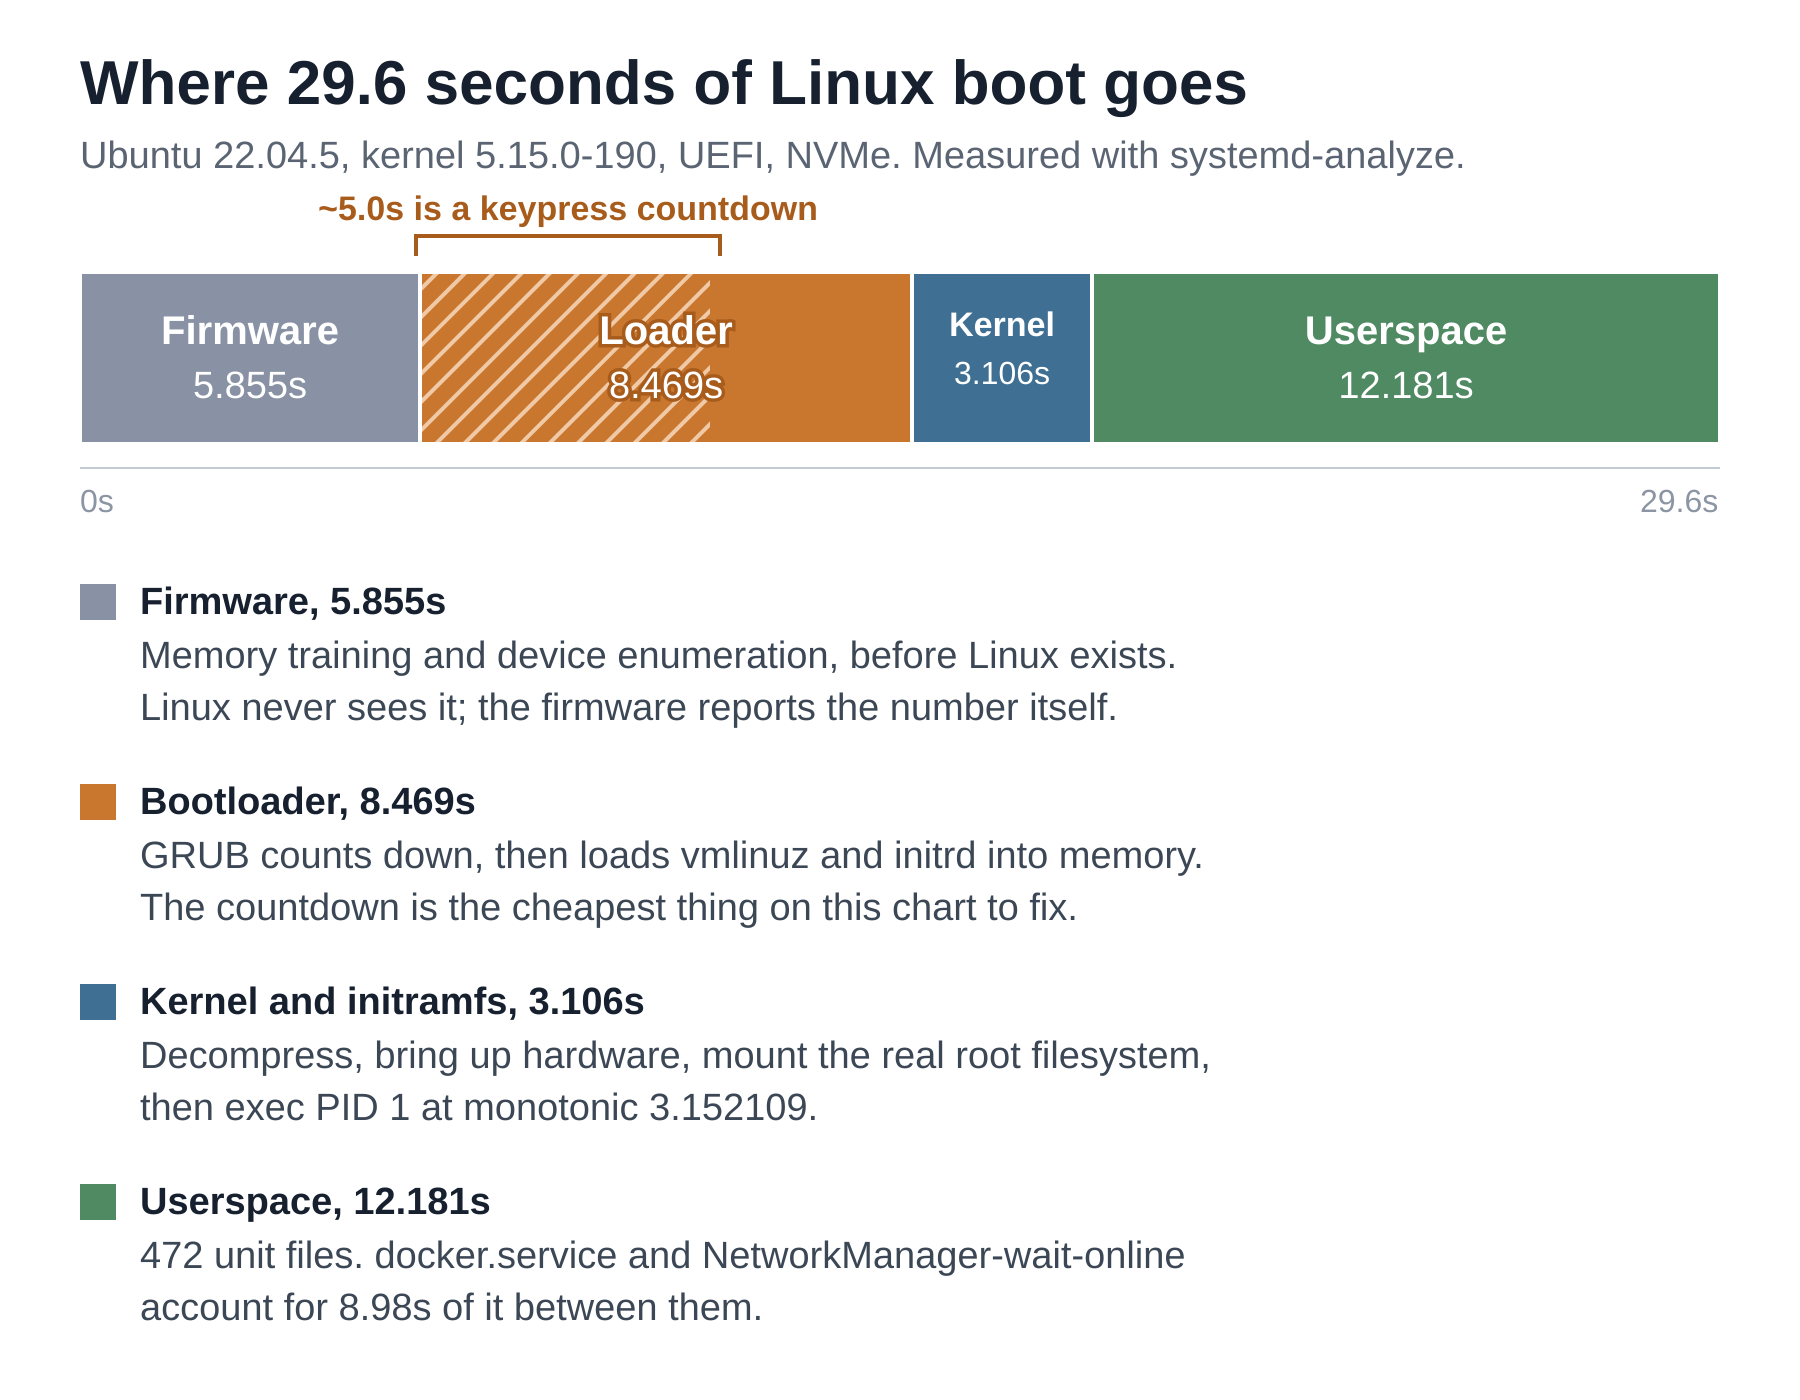
Add those four and you get 29.611, not the 29.613 printed on the last line. That gap is real and it isn't a mistake: systemd-analyze truncates each phase for display while summing the underlying microseconds, so a couple of milliseconds hide in the rounding. It's a small thing, and it will save you an evening of hunting for a bug that isn't there.
Four numbers, and most people's mental model accounts for one of them. The kernel took three seconds. The bootloader before it took eight and a half, and the firmware before that took nearly six. Fourteen seconds of this machine's boot happened before Linux was running at all, and I chose a good part of it without noticing.
This article follows the Linux boot process the whole way through one real boot, from the firmware handing control to a bootloader to a login prompt on your screen. Everything here you can run yourself, and almost none of it needs root.
Table of Contents
What You Need
Any Linux machine running systemd, which covers Ubuntu, Debian, Fedora, Arch, and most things people install in 2026. A terminal. That's it.
The machine I'm measuring is Ubuntu 22.04.5 LTS running kernel 5.15.0-190-generic, booting in UEFI mode from an NVMe disk with an ext4 root filesystem, with systemd 249 as PID 1. Yours will differ, sometimes by a lot, and I'll say where to expect that.
One command needs root and one file is restricted on many systems. I'll flag both when we get there.
The Linux Boot Process is Four Handoffs, Not One
The word "boot" suggests a single process. But it's four, and they barely know about each other.
Firmware runs first, from a chip on the motherboard, and its job is to find something bootable and start it.
It then hands control to a bootloader and stops. The bootloader's job is to find a kernel, load it into memory along with an initial filesystem, and jump to it. It then stops.
The kernel brings up hardware, mounts a root filesystem, and starts exactly one userspace process. Then it stops being in charge, though it keeps servicing that process forever afterward.
That first process, PID 1, starts everything else.
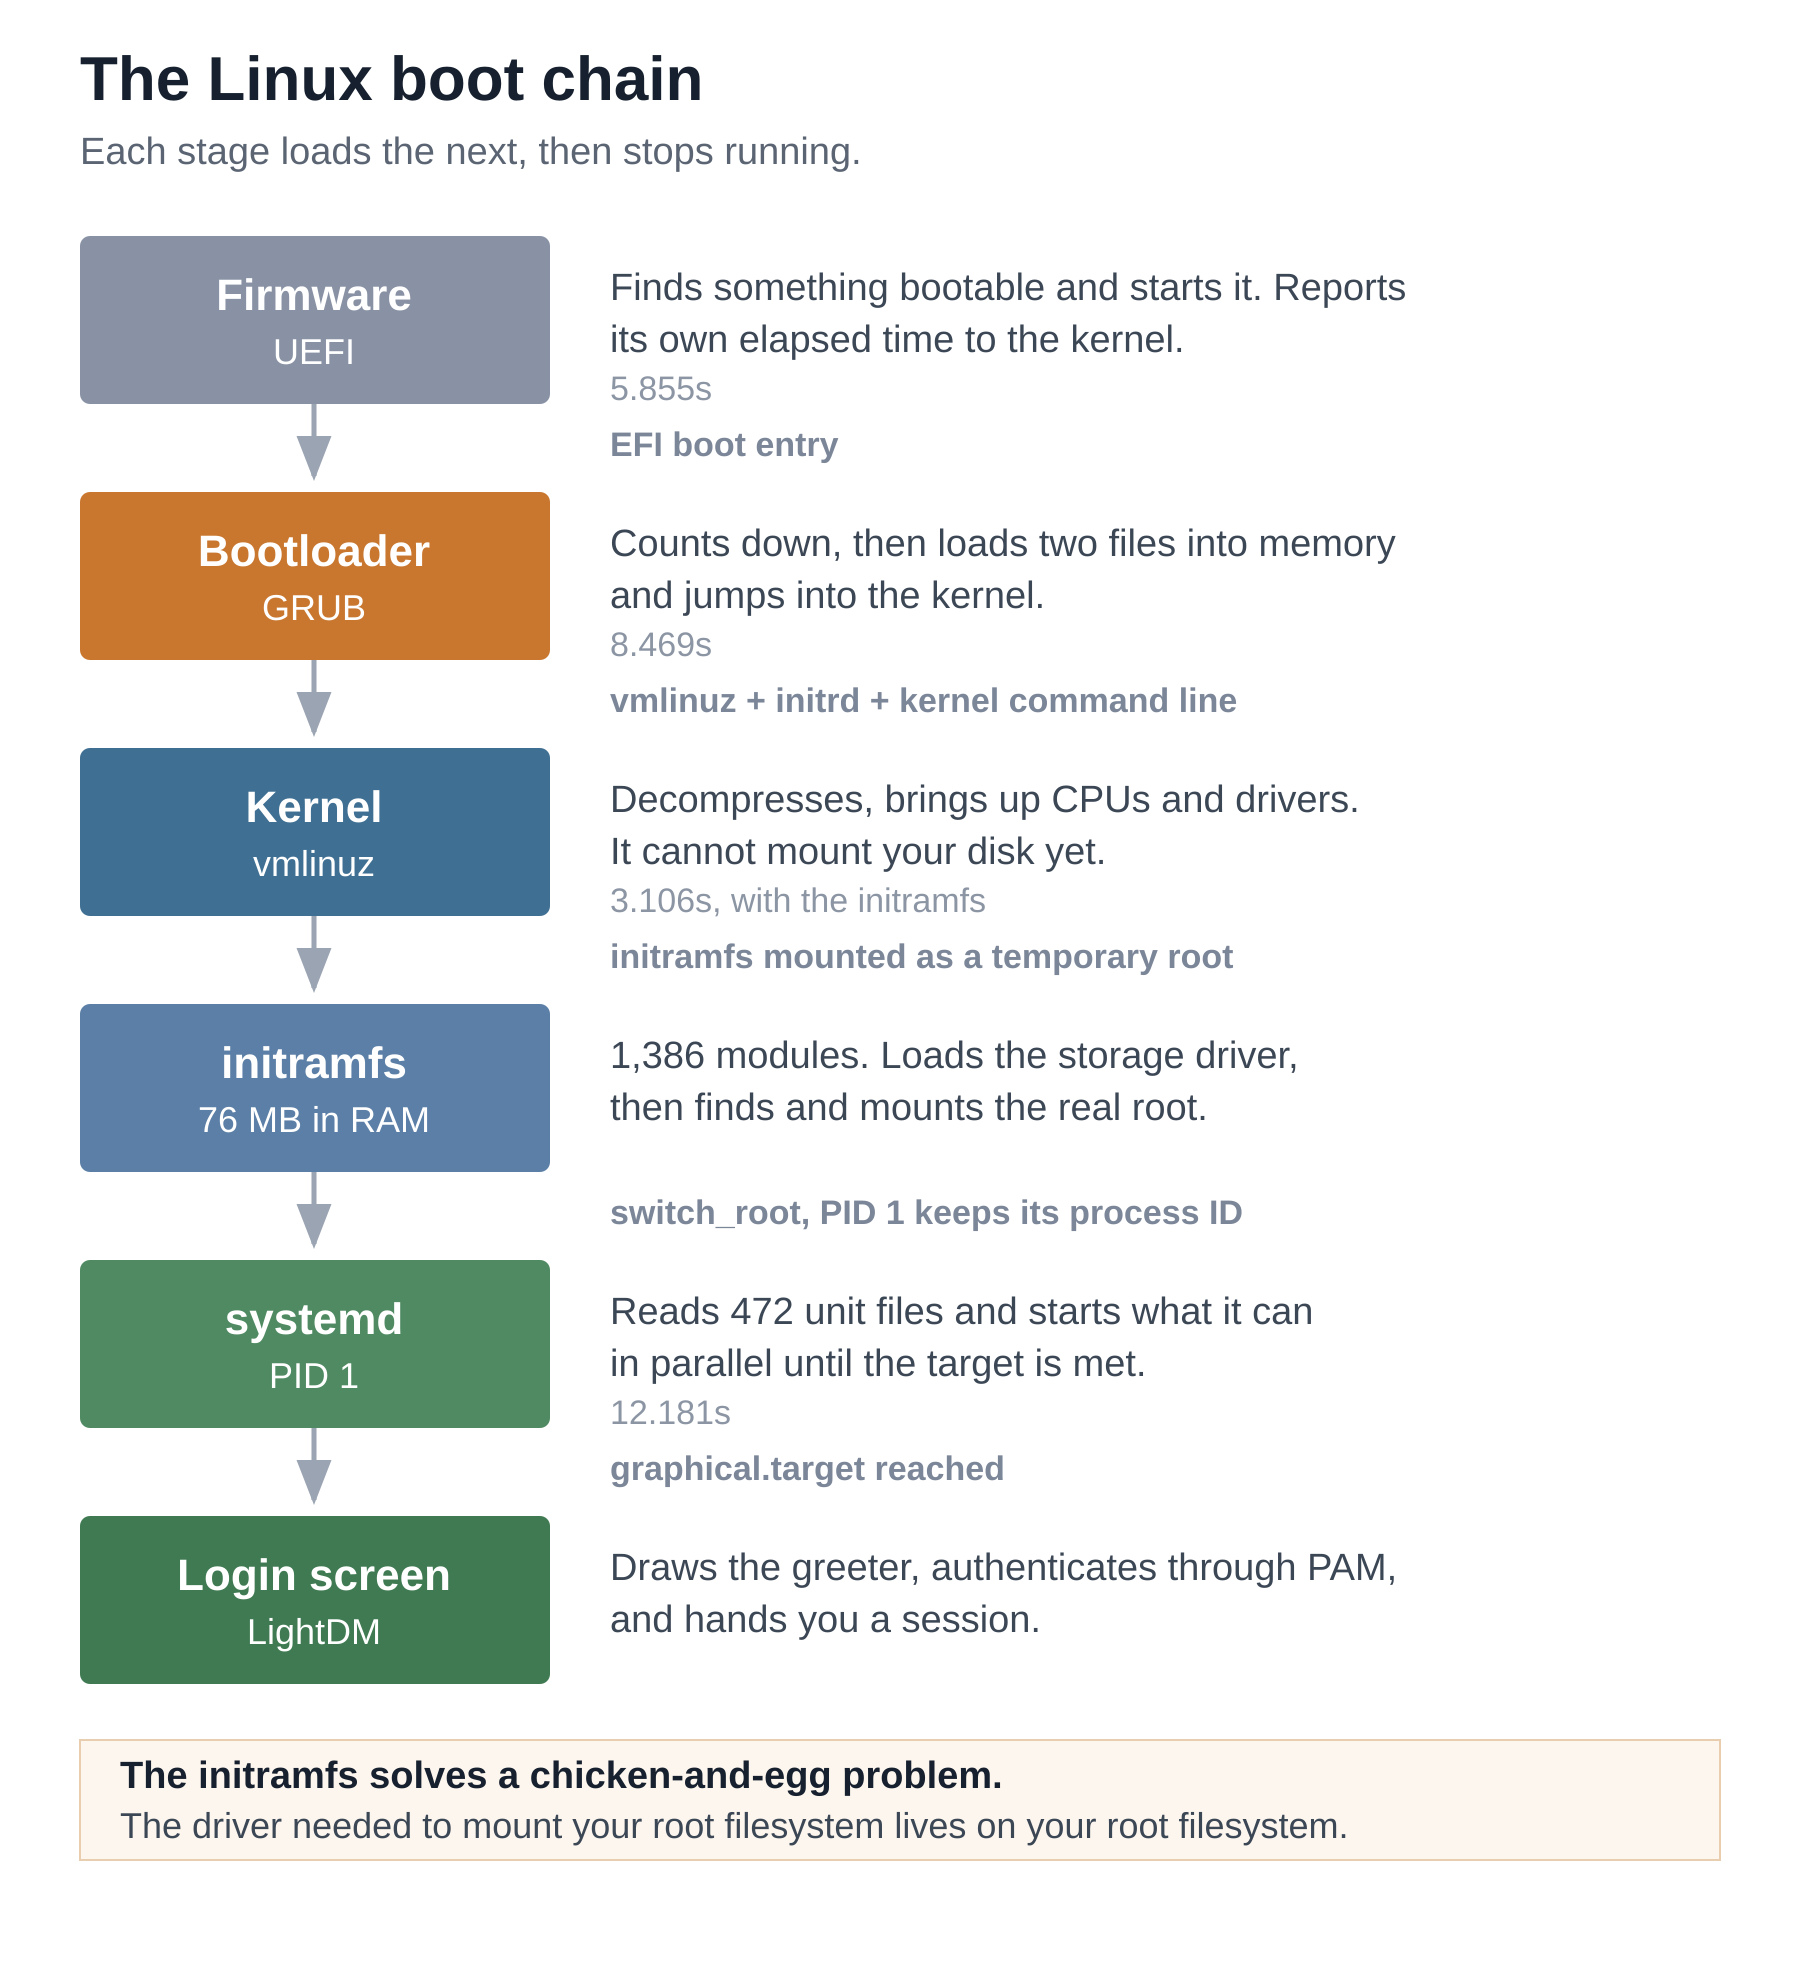
Each handoff is one way. The firmware isn't sitting underneath Linux waiting to help. The bootloader is gone from memory. Hold onto that, because it explains why the four numbers in systemd-analyze are measured by different things and mean different things.
Firmware, and the Part Linux Never Sees
The 5.855 seconds attributed to firmware is the only figure here that Linux didn't measure itself, and you can read the exact source it came from:
cat /sys/firmware/acpi/fpdt/boot/bootloader_launch_ns
5855973785
That's 5.855973785 seconds, which is the 5.855 systemd-analyze reported, truncated for display. The firmware wrote it into an ACPI table called the Firmware Performance Data Table before handing over, and the kernel exposes the table's fields under that directory. Its sibling fills in the rest:
cat /sys/firmware/acpi/fpdt/boot/exitbootservice_end_ns
On this machine that reads 14325507185, or 14.325 seconds, which is firmware and bootloader combined and matches the two phases added together.
Here's the part that trips people up. The gate isn't UEFI, it's whether your firmware publishes an FPDT at all. Plenty of UEFI machines don't, virtual machines especially, and on those systemd-analyze reports no firmware phase and no loader phase either, starting its accounting at the kernel. Check for the table rather than for UEFI:
ls /sys/firmware/acpi/fpdt/boot/ 2>/dev/null || echo "no FPDT, so no firmware timing"
If that prints nothing, your firmware isn't reporting, and there's no way to recover the number from inside Linux.
Almost six seconds is a lot, and there isn't much you can do about it from inside Linux. It's memory training and device enumeration, plus whatever your vendor decided to run before handing over. On a laptop with fast storage this is often the single largest phase, which surprises people who spend their optimization effort on services.
The Bootloader, and the Five Seconds You Chose
Here's the number that changes how you read the whole output. The loader phase took 8.469 seconds, nearly three times what the kernel took. Almost none of that was work.
grep ^GRUB_TIMEOUT /etc/default/grub
On this machine:
GRUB_TIMEOUT="5"
Five of those 8.469 seconds are GRUB counting down and waiting for a keypress that never comes. That's a configuration choice, made once, probably by the installer, and then never revisited. If you've ever wondered why your machine feels slow to start despite good hardware, this is the first place to look, and it's the cheapest fix in this entire article.
While GRUB is waiting, it already knows what it's going to do. You can read the instructions it passed along:
cat /proc/cmdline
BOOT_IMAGE=/boot/vmlinuz-5.15.0-190-generic root=UUID=b4d0343e-9df4-40a7-be97-dcd51bdbf553
ro splash intel_iommu=on vt.handoff=7
That single line is the entire contract between the bootloader and the kernel. BOOT_IMAGE is which kernel got loaded. root=UUID=... names the filesystem to mount, by UUID rather than device name so it survives disks being renumbered. ro says mount it read-only at first. splash asks for a graphical boot screen instead of scrolling text. intel_iommu=on enables the IOMMU, and vt.handoff=7 is Ubuntu passing the virtual terminal to the graphical stack without a flicker.
GRUB loads two files into memory: the kernel, and an initial filesystem image we'll come back to shortly. Then it jumps into the kernel and ceases to exist.
The Kernel Phase: Three Seconds to a Working Machine
Now Linux is running. The kernel decompresses itself, sets up memory management, brings up the CPUs, initializes drivers, and looks for a root filesystem.
Watch it happen, with timestamps measured from the moment the kernel started:
journalctl -k -b -o short-monotonic | head
[    0.000000] devils-dell kernel: microcode: microcode updated early to revision 0x100
[    0.000000] devils-dell kernel: Linux version 5.15.0-190-generic
[    0.000000] devils-dell kernel: Command line: BOOT_IMAGE=/boot/vmlinuz-5.15.0-190-generic
[    0.000000] devils-dell kernel: KERNEL supported cpus:
Zero is when the kernel began executing, not when you pressed the power button. Everything before this point, all fourteen seconds of firmware and bootloader, is outside this clock entirely. That's the first thing to understand about kernel boot timestamps, and it's why dmesg output makes some machines look far faster than they are.
You may have reached for dmesg there and been refused:
dmesg: read kernel buffer failed: Operation not permitted
That's deliberate, and you can confirm it:
sysctl kernel.dmesg_restrict
Ubuntu sets kernel.dmesg_restrict = 1, which limits the kernel ring buffer to root because it leaks kernel addresses useful to an attacker. Use journalctl -k instead, which reads the same messages through the journal and works as an ordinary user.
One more detail from /proc/cmdline explains something people notice and rarely investigate. The kernel was told to mount the root filesystem ro, read-only, yet the system you're using now clearly writes to disk. Check what it looks like today:
findmnt -n -o SOURCE,FSTYPE,OPTIONS /
/dev/nvme0n1p2 ext4 rw,relatime,errors=remount-ro
It's read-write now, so something changed it. The root filesystem is mounted read-only first so that a filesystem check can run safely against it, since checking a filesystem while processes are writing to it is how you turn a small problem into a large one.
Once that check passes, userspace remounts the same filesystem read-write in place, and the errors=remount-ro option you can see there is the reverse promise: if the kernel hits a filesystem error later, it drops back to read-only instead of writing to something it no longer trusts.
Now find the exact moment the kernel stopped being alone:
journalctl -b -o short-monotonic | grep -m1 'systemd\[1\]'
[ 3.152109] devils-dell systemd[1]: Inserted module 'autofs4'
3.15 seconds in, PID 1 logged its first line. That matches the 3.106 seconds systemd-analyze attributes to the kernel, and it's the handoff. From here the kernel does nothing on its own initiative. It answers system calls, and every decision about what runs next belongs to userspace.
What the initramfs is, and the Chicken-and-Egg Problem it Solves
There's a step hidden inside that three seconds, and it's the part of Linux boot that confuses people most.
The kernel needs to mount your root filesystem. To do that, it needs a driver for your storage controller and a driver for the filesystem, and possibly code to assemble a RAID array, open an encrypted volume, or activate LVM. Those drivers live in modules. The modules live on the root filesystem. Which the kernel can't mount yet.
The way out is a small filesystem the bootloader loads into memory alongside the kernel, complete in itself. Look at it:
ls -l /boot/initrd.img-$(uname -r)
lsinitramfs /boot/initrd.img-$(uname -r) | wc -l
lsinitramfs /boot/initrd.img-$(uname -r) | grep -c '\.ko'
Those paths and that tool are Debian and Ubuntu conventions. On Fedora the image is /boot/initramfs-$(uname -r).img and the tool is lsinitrd. On Arch it's usually /boot/initramfs-linux.img, read with lsinitcpio.
On this machine the image is 79,945,887 bytes, roughly 76 MB, holding 2,318 files of which 1,386 are kernel modules. It's a real, working, if minimal Linux system that exists to solve one problem: find and mount the actual root filesystem.
Once it succeeds, it does something unusual. It never exits. It swaps the real root into place, moves itself out of the way, and executes the real /sbin/init without ever starting a new process tree. PID 1 changes identity mid-flight and keeps its process ID.
If you use Arch or a minimal Fedora install, your initramfs may be a tenth of this size, because Ubuntu builds a generic one containing drivers for hardware you don't own so that the same image boots on any machine. That's a deliberate trade of size against portability, and lsinitramfs will show you what you're carrying.
PID 1, and Where the Other Twelve Seconds Go
The kernel finished at 3.1 seconds. The login screen appeared at 12.175 seconds of userspace. So what happened in between?
systemctl get-default
systemctl list-unit-files --no-legend | wc -l
systemctl list-units --type=service --state=running --no-legend | wc -l
graphical.target
472
44
systemd's model is that you name a goal and it works out the order. The goal here is graphical.target, which wants multi-user.target, which wants a working network, filesystems, logging, and dozens of other things.
There are 472 unit files installed on this machine and 44 services actually running. systemd builds a dependency graph from those and starts everything it can in parallel, waiting only where a real dependency exists.
That parallelism is why boot analysis is harder than it looks. Dozens of things are happening at once, and the total isn't the sum of the parts.
Why systemd-analyze blame Misleads You About Boot Time
The obvious next command is the wrong one, and the trap is worth walking into deliberately:
systemd-analyze blame | head -5
3min 48.947s fstrim.service
     44.548s plocate-updatedb.service
     13.953s apt-daily.service
      4.875s docker.service
      4.106s NetworkManager-wait-online.service
Read that against the total. Userspace took 12.181 seconds. The top entry claims three minutes and forty-nine. Both numbers are correct, and the contradiction is the whole point.
blame lists how long each unit took to start, for every unit systemd has started, whenever it started. It says nothing about whether the unit was on the path to your login screen. Check the top three:
systemctl show fstrim.service -p TriggeredBy -p WantedBy
systemctl list-timers fstrim.timer
TriggeredBy=fstrim.timer
WantedBy=
NEXT                        LEFT        LAST                        PASSED
Mon 2026-09-14 00:59:36 IST 4 days left Mon 2026-09-07 00:33:35 IST 2 days ago
WantedBy is empty, so nothing pulls it in at boot. It's triggered by a timer. It last ran two days ago and runs again in four.
plocate-updatedb.service and apt-daily.service are the same shape, triggered by their own timers.
The top three entries in blame, nearly five minutes of apparent boot time, contributed exactly nothing to how long you waited for a login prompt.
The first entry that's genuinely on the boot path is docker.service, fourth in the list, at 4.875 seconds.
I'd rather you take the general lesson than the specific one. A measurement that reports on a superset of what you care about will mislead you in proportion to how much of that superset is irrelevant. blame isn't broken. It answers a different question than the one people ask it.
Reading the Critical Chain
The command that answers the actual question is this one:
systemd-analyze critical-chain
graphical.target @12.175s
└─multi-user.target @12.175s
  └─docker.service @7.297s +4.875s
    └─network-online.target @7.295s
      └─NetworkManager-wait-online.service @3.188s +4.106s
        └─NetworkManager.service @3.151s +35ms
          └─network-pre.target @3.150s
            └─netfilter-persistent.service @1.377s +1.772s
              └─local-fs.target @1.374s
The @ is when a unit became active. The + is how long it took. Now the twelve seconds make sense: docker.service at 4.875 and NetworkManager-wait-online.service at 4.106 account for nearly nine of them, and they're serialized because Docker wants a working network before it starts.
NetworkManager-wait-online is the one to look at first on most desktops. It does what its name says, which is block until the network is actually up, and on a laptop associating with Wi-Fi that can be seconds of doing nothing. It exists so that services needing a network don't start before there is one. Whether you need that guarantee is a real question with a real answer, and it depends on what you run.
Two cautions about this output. It shows one chain, not every slow thing, so a unit that was slow but off the critical path never appears. And the @ times aren't a causal sequence you can read top to bottom. My own output has a Docker network mount timestamped at 11 seconds nested underneath a target that completed at 650 milliseconds, which looks impossible until you realize the tree shows dependency edges and not a sequence of events. Read the + values for cost and the structure for ordering constraints, and don't read the nesting as a chronology.
Why Your Linux Boot Time Will Be Different
Everything above is one boot on one machine, and the specific figures are worth less than the method. Before you compare yours to mine, know which parts move and why.
Firmware time varies more than anything else here, and it has almost nothing to do with Linux. A desktop with lots of RAM to train and a dozen USB devices to enumerate can spend fifteen seconds where this laptop spends six. If your firmware has a fast boot option, that option is what it sounds like: skipping enumeration steps, at the cost of not noticing hardware you plugged in.
Loader time is mostly your timeout, so it's mostly your decision. Kernel time moves with how much hardware you have and how much of the initramfs has to be unpacked and searched. This is why a distribution-generic initramfs like Ubuntu's costs more here than a host-specific one built for your machine alone. If your root filesystem is encrypted, some of what looks like kernel time is actually you typing a passphrase.
Userspace time is where your machine differs from mine most, because it reflects what you installed rather than what you own. Docker costs me nearly five seconds and would cost you nothing if you don't run it.
Run it a few times before drawing conclusions. Boot timing varies between runs on the same machine, and a single reading tells you less than you'd like.
The Login Screen, and the Handoff to You
The last step is the one you see:
systemctl status display-manager --no-pager | head -1
loginctl show-session $(loginctl | awk 'NR==2{print $1}') -p Type -p Class
● lightdm.service - Light Display Manager
Type=x11
Class=user
On this machine, the display manager is LightDM, started as part of graphical.target. It opens a session on a virtual terminal, draws the greeter, and waits.
Behind it, systemd has already created a seat and a session slot for whoever logs in. When you type your password, the display manager authenticates through PAM, systemd assigns the session, and your desktop environment starts as a user process.
That vt.handoff=7 from the kernel command line pays off here. It hands the virtual terminal to the graphical stack without the screen blanking and redrawing, which is the difference between a smooth boot and a flickering one.
From this point, the kernel is doing what it always does, which is answering system calls. If you want to follow what happens next, I wrote about that boundary in detail.
Conclusion
You can now account for your own boot, phase by phase, with numbers instead of guesses. On this laptop, 29.6 seconds breaks down as almost six seconds of firmware you can't control, eight and a half seconds of bootloader that's mostly a countdown you can delete, three seconds of kernel, and twelve seconds of userspace dominated by two services waiting on the network.
More usefully, you have a way to tell a real measurement from a plausible one. systemd-analyze blame looks authoritative and answers a question nobody asked. The critical chain answers the right question and still needs care, because its tree maps dependencies, not chronology.
A few directions from here. Set GRUB_TIMEOUT=1 and regenerate the config, with sudo update-grub on Debian and Ubuntu or sudo grub2-mkconfig -o /boot/grub2/grub.cfg on Fedora, then reboot and watch five seconds vanish. Run systemd-analyze plot > boot.svg and open it in a browser for the parallel view the text output flattens. Or look at whether NetworkManager-wait-online.service is earning its four seconds on your machine, which for most desktops it isn't.
Epilogue
The reason I went looking at any of this is that I'm building a Linux distribution with an Android-style permission model, where a program gets only the authority its manifest asks for rather than everything its user happens to have. That turns the boot sequence into a security question. Every process started before you log in runs with more authority than anything you launch afterward, and until I could name each one and say why it was there, I had no real way to argue about which of them deserved it.
You can find more of what I write at thechris.in.


