

Have you ever found yourself staring at lines of code, trying to wrap your head around how all the different functions fit together and interact with each other?
It can be a daunting task, especially in larger, more complex programs.
But fear not! There is a way to visualize the flow of function calls and make sense of it all: the call graph.
Imagine being able to see a diagram that shows you exactly how each function fits into the bigger picture, and how they call upon each other to get their job done. Sounds like a dream come true, right?
Well, it's not just a dream. With the right tools and techniques, you can automate the creation of a call graph and gain a much better understanding of your codebase.
In this article, we'll show you how to do just that. We'll cover both static and dynamic approaches to creating call graphs, and discuss the pros and cons of each.
Whether you're a seasoned developer or just starting out, you'll find valuable insights and information in this guide on how to automate call graph creation. So grab your favorite text editor and let's get started!
In this article, we will cover:
- What is a Call Graph?
- Dynamic vs Static Call Graphs
- Why do we need Call Graphs?
- Automatic Call Graph Generation
- Dynamic Call Graph Generation
- Conclusion
What is a Call Graph?
A call graph is a graphical representation of the relationships between different function calls within a program. It shows how the functions in a program interact with each other, allowing developers to understand the flow of the program and identify potential performance issues.
Call graphs can be created manually, but this can be a tedious and time-consuming process, especially for large software projects and applications.
That's where automation comes in. By automating the creation of call graphs, developers can save time and effort, and focus on more important tasks.
There are two main approaches to automating call graph creation: static analysis and dynamic analysis. Static analysis involves analyzing the source code of a program without executing it, while dynamic analysis involves running the program and analyzing its behavior as it executes.
Both approaches have their own benefits and drawbacks, and the best approach for a given situation will depend on the specific needs and goals of the developer.
In this article, we'll explore both approaches in more detail and discuss how to choose the right one for your needs.
Regardless of which approach you choose, automating call graph creation can be a powerful tool for improving the efficiency and effectiveness of your software development process.
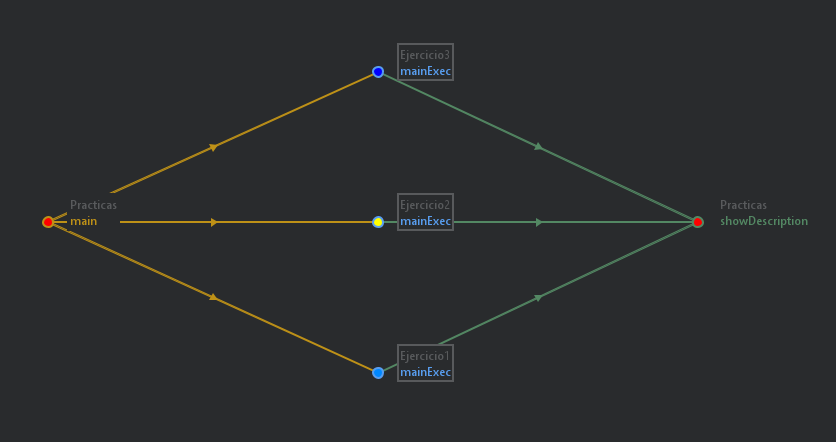 Image by author
For example, the image above shows what would be the call graph of some simple Java code whose purpose is to execute one of 3 possible subprograms with their own inputs and outputs.
import java.util.Scanner;

class Ejercicio3 extends Practicas {
    public String name = "3---Inversor dígitos";
    public String description = "Devuelve el número con los dígitos invertidos";

    public void mainExec() {
        showDescription(name, description);

        int b = in.nextInt();
        int h = in.nextInt();
        System.out.println(b*h/2);
    }
}

class Ejercicio2 extends Practicas {
    public String name = "2---Inversor dígitos";
    public String description = "Devuelve el número con los dígitos invertidos";

    public void mainExec() {
        showDescription(name, description);

        int input = in.nextInt();
        String temp = ""+input;
        String out = "";
        for(int i=0;i<temp.length();i++){
            out += temp.charAt(temp.length()-i-1);
        }
        int out1 = Integer.parseInt(out);
        System.out.println(out1);
    }
}

class Ejercicio1 extends Practicas {
    public String name = "1---Programa Hola mundo";
    public String description = "Simplemente Hola mundo";

    public void mainExec() {
        showDescription(name, description);
        System.out.println("Hello world!");
    }
}

public class Practicas {
    Scanner in = new Scanner(System.in);

    public void showDescription(String name, String description) {
        System.out.println(String.format("Nombre: %s \nDescripción: %s\nResultado de ejecución:\n", name, description));
    }

    public static void main(String args[]) {
           Ejercicio1 ej1 = new Ejercicio1();
           ej1.mainExec();

           Ejercicio2 ej2 = new Ejercicio2();
           ej2.mainExec();

           Ejercicio3 ej3 = new Ejercicio3();
           ej3.mainExec();
    }
}
As you can see inside the code, each subprogram is stored in a Class called directly from the main() method.
Dynamic vs Static Call Graphs
A dynamic call graph is a representation of the flow of control within a program as it is executed. It shows the sequence of function calls that are made during the execution of the program, along with the parameters that are passed to each function.
In contrast, a static call graph is a representation of the flow of control within a program that is constructed based on the source code of the program, without considering any actual execution of the program.
One of the main differences between dynamic and static call graphs is the level of detail that they provide.
A dynamic call graph shows the exact sequence of function calls that were made during the execution of a program, along with the specific parameters that were passed to each function.
This can be very useful for debugging and optimizing code, as it allows developers to see exactly how the program is executing and identify any potential bottlenecks or inefficiencies.
In contrast, a static call graph is based on the source code of the program and does not consider any actual execution of the program. As a result, a static call graph does not provide as much detail as a dynamic call graph and may not accurately reflect the actual flow of control within the program.
But static call graphs can still be very useful for understanding the overall structure of a program and identifying potential dependencies between different parts of the code.
Another difference between dynamic and static call graphs is the way they are constructed.
Dynamic call graphs are generated as the program is executed, so they require the program to be run in order to be created. This can be time-consuming, especially for large programs, and may require the program to be run multiple times in order to capture all of the possible execution paths.
In contrast, static call graphs can be generated directly from the source code of the program, without the need to actually run the program. This can be much faster and more efficient, especially for large programs, and allows developers to analyze the structure of the program without having to wait for it to execute.
There are also some limitations to both dynamic and static call graphs. Dynamic call graphs can only provide information about the actual execution of the program and do not consider any potential execution paths that were not taken. This can make it difficult to identify certain types of bugs or inefficiencies that may only occur under certain conditions.
Static call graphs, on the other hand, can only provide information about the potential execution paths of the program and do not consider any actual execution of the program. This can make it difficult to accurately reflect the actual flow of control within the program, especially if the program has complex control flow or makes use of advanced language features such as recursive functions or exception handling.
Overall, dynamic and static call graphs are both useful tools for understanding the flow of control within a program. You can use them together to get a more complete picture of how a program is executing.
Dynamic call graphs provide detailed information about the actual execution of a program, while static call graphs provide a more abstract view of the potential execution paths of a program.
Both can be very useful for debugging, optimizing, and maintaining code, and you can use them in a variety of different contexts to help yourself better understand and improve your code.
Why Do We Need Call Graphs?
The main benefits of using call graphs, as we saw in previous sections, can be summarized through the following concepts:
- Understanding the codebase
- Debugging
- Performance optimization
- Refactoring
By visualizing the flow of control through the code, we can see how different parts of the code interact with each other and how they fit into the bigger picture. This can be particularly useful when working on a codebase that is new to you, as it can give you a high-level overview of how everything fits together.
Call graphs can also be useful for debugging. By visualizing the flow of control through the code, developers can identify potential issues or bugs, such as infinite loops or recursion. This can be especially helpful when working on a codebase that is prone to bugs or when you are trying to fix a particularly tricky issue.
They also improve performance optimization, displaying which functions or methods are called frequently and which may be causing delays. Using this info, we can identify performance leaks and take steps to optimize the code.
This can be especially important in applications that need to be fast and responsive, such as real-time systems or mobile apps.
Finally, we can take advantage of call graphs when refactoring code. To visualize which functions or methods are dependent on the code you are modifying, we can see the impact of their changes and ensure that they don't break anything.
This can be especially important when working on a codebase that is critical to an organization's operations, as it can help prevent costly downtime.
Automating the creation of call graphs is beneficial because it can save time and effort for the developer. Instead of manually drawing a call graph, you can use a tool to automatically generate the graph based on the code. This can be particularly useful in large codebases, where manually creating a call graph could be time-consuming.
Additionally, automated call graph creation helps make sure that the call graph is accurate and up-to-date, as it will be based on the most recent version of the code. This becomes especially important in codebases that are constantly evolving, as it can help ensure that the call graph remains relevant and correct.
In short, call graphs can be incredibly useful for developers working on a software project. They help developers understand the codebase, debug issues, optimize performance, and refactor code.
Automating the creation of call graphs can save time and effort for the developer and ensure that the call graph is accurate and significant.
Automatic Call Graph Generation
The first method we will cover is the creation of a static call graph in Java, since there are code editors such as Intellij Ultimate that offer tools and plugins to visualize such a graph without having to add more lines of code.
So, once you have the editor open, press Ctrl+Alt+S to access editor Settings, or simply go to File->Settings menu. Then, enter the Plugins section and search for the Call Graph plugin.
 Image by author
As you can see in its description, its goal is to visualize Java (only language supported) call graphs in the simplest possible way, which we can take advantage of.
After installing the plugin, you can start creating your own static call graphs by going to View->Tool Window->Call Graph. If it doesn't appear in the top menu, you may have to restart the editor.
 Image by author
Finally, you are now able to easily visualize your code flow and relationships between inner components, as you can see in the above example extracted from this project, which we will also use in future cases.
Continuing with static call graphs, we will focus on a specific method suitable for the Python programming language. So we will start by installing the required modules to carry out the process:
!pip install pyvis
!pip install pycg
With the pip command, we have installed pyvis, which provides a simple and intuitive interface for creating, visualizing, and analyzing networks. Also, we have included pycg to extract the graph format information of a desired Python script file.
In this case, we will use as a simple initial example a script containing only a hello world program. However,you can use any desired program, regardless of complexity or extension:
print("hello world")
Once everything is ready to run, the first step is to get the call graph data by using pycg library. With the following command we store in a .json file all the neccessary information about our static call graph, which later will be converted to its visual representation:
!pycg file.py -o cg.json
The second step is to visualize the resulting graph from the .json file. So, with pyvis and json Python modules, we can transform our current JSON format data into an HTML file that displays an interactive version of the resulting graph.
import networkx as nx
from pyvis.network import Network
import json

def toNetwork(data: dict)->  nx.DiGraph:
    nt = nx.DiGraph()

    def checkKey(name):
        if name not in nt:
            nt.add_node(name, size=40)

    for node in data:
        checkKey(node)
        for child in data[node]:
            checkKey(child)
            nt.add_edge(node,child)
    return nt

def ntw_pyvis(ntx:nx.DiGraph):
    net = Network(width="1000px",height="1000px", directed=True)
    for node in ntx.nodes:
        net.add_node(node, **{"label":node},)

    for edge in ntx.edges:
        net.add_edge(edge[0], edge[1], width=1)
    net.show('graph.html')

with open("cg.json","r") as f:
    data = json.load(f)

ntw_pyvis(toNetwork(data))
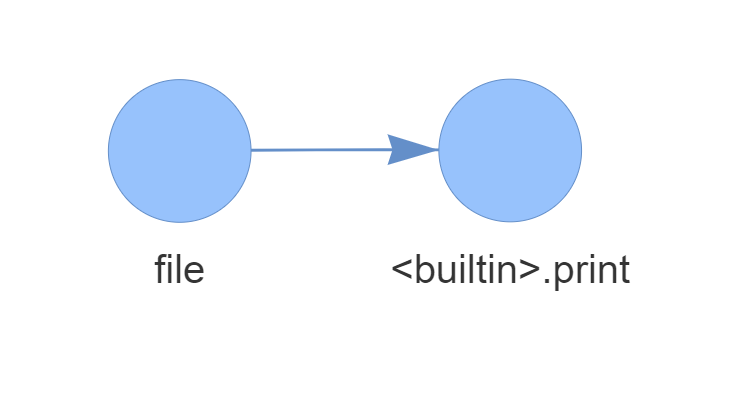 Image by author
For a simple hello world program, this would be the static call graph. As you can see, there is a source node (file.py) and a sink one encapsulating the unique function present in our program, the built-in print().
 Image by author
However, not all static call graphs need to have a source and sink, since they can call any number of functions, classes, or even other modules.
For instance, the above graph shows a more complex algorithm whose main function is to play a Wordle game in a smart way. Notice the amount of built-in functions involved in it, as well as the references between the script's functions. This all proves that the graph doesn't always have a fixed structure – instead it's dependent on the quality of the written code.
Dynamic Call Graph Generation
In this final section, we will learn how to automatically create a dynamic call graph to monitor Python processes.
In contrast to the previous method, here we only need one module to generate the graph, and the overall additional code needed for the process is substantially simpler.
!pip install pycallgraph
When we have installed the pycallgraph library, which as its own name states, will be in charge of generating and visualizing the dynamic call graph associated to our code.
We can import it into a new Python script and use PyCallGraph/GraphvizOutput objects to generate a .png file with the corresponding call graph.
from pycallgraph import PyCallGraph
from pycallgraph.output import GraphvizOutput

graph = GraphvizOutput()
graph.output_file = "file4.png"

with PyCallGraph(output=graph):
  print("Hello world")
 Image by author
For a simple hello world program launched from Google Colab, you can observe that the graph's structure now depends on the process by which our code was run.
So, if a function is not reached by the execution flow, it won't be shown in the dynamic graph, whereas in the static graph it will be. This is one of the most transcendental reasons why we make the distinction between both types.
import re
import math
import json
import os
import concurrent
from concurrent.futures import ProcessPoolExecutor
import requests
import numpy as np

from pycallgraph import PyCallGraph
from pycallgraph.output import GraphvizOutput

def procesarEntrada():
    entrada = []
    while len(entrada) != 5:
        entrada = [int(a) for a in input()[:5] if int(a) in range(0, 3)]
    return entrada


def generatePattern(entrada, word):
    pattern = ""
    procesed = {}

    for j in range(len(entrada)):
        letra = word[j]
        if letra not in procesed:
            condition = [k for k in range(j + 1, len(entrada)) if word[k] == letra and entrada[k] == 2]
            if entrada[j] == 0:
                if condition == []: procesed[letra] = 0
            else:
                procesed[letra] = 0
            pattern += [f"(?=[^{letra}]*$)" if condition == [] else f"(?!.{{{j}}}{letra})",
                        f"(?!.{{{j}}}{letra})(?=.*{letra})" + "".join(f"(?!.{{{i}}}{letra})" for i in [k for k in range(j + 1, len(entrada)) if word[k] == letra and entrada[k] in [0, 1]]),
                        f"(?=.{{{j}}}{letra})" + "".join(f"(?!.{{{i}}}{letra})" for i in [k for k in range(j + 1, len(entrada)) if word[k] == letra and entrada[k] in [0, 1]])][
                entrada[j]]
    return f"^{pattern}.*$"


def scoreWord(word, d):
    combinations = ["00000", "00001", "00002", "00010", "00011", "00012", "00020", "00021", "00022", "00100", "00101",
                    "00102", "00110", "00111", "00112", "00120", "00121", "00122", "00200", "00201", "00202", "00210",
                    "00211", "00212", "00220", "00221", "00222", "01000", "01001", "01002", "01010", "01011", "01012",
                    "01020", "01021", "01022", "01100", "01101", "01102", "01110", "01111", "01112", "01120", "01121",
                    "01122", "01200", "01201", "01202", "01210", "01211", "01212", "01220", "01221", "01222", "02000",
                    "02001", "02002", "02010", "02011", "02012", "02020", "02021", "02022", "02100", "02101", "02102",
                    "02110", "02111", "02112", "02120", "02121", "02122", "02200", "02201", "02202", "02210", "02211",
                    "02212", "02220", "02221", "02222", "10000", "10001", "10002", "10010", "10011", "10012", "10020",
                    "10021", "10022", "10100", "10101", "10102", "10110", "10111", "10112", "10120", "10121", "10122",
                    "10200", "10201", "10202", "10210", "10211", "10212", "10220", "10221", "10222", "11000", "11001",
                    "11002", "11010", "11011", "11012", "11020", "11021", "11022", "11100", "11101", "11102", "11110",
                    "11111", "11112", "11120", "11121", "11122", "11200", "11201", "11202", "11210", "11211", "11212",
                    "11220", "11221", "11222", "12000", "12001", "12002", "12010", "12011", "12012", "12020", "12021",
                    "12022", "12100", "12101", "12102", "12110", "12111", "12112", "12120", "12121", "12122", "12200",
                    "12201", "12202", "12210", "12211", "12212", "12220", "12221", "12222", "20000", "20001", "20002",
                    "20010", "20011", "20012", "20020", "20021", "20022", "20100", "20101", "20102", "20110", "20111",
                    "20112", "20120", "20121", "20122", "20200", "20201", "20202", "20210", "20211", "20212", "20220",
                    "20221", "20222", "21000", "21001", "21002", "21010", "21011", "21012", "21020", "21021", "21022",
                    "21100", "21101", "21102", "21110", "21111", "21112", "21120", "21121", "21122", "21200", "21201",
                    "21202", "21210", "21211", "21212", "21220", "21221", "21222", "22000", "22001", "22002", "22010",
                    "22011", "22012", "22020", "22021", "22022", "22100", "22101", "22102", "22110", "22111", "22112",
                    "22120", "22121", "22122", "22200", "22201", "22202", "22210", "22211", "22212", "22220", "22221",
                    "22222"]
    finalScore = 0

    for c in combinations:
        entrada = [int(i) for i in c]
        pattern = generatePattern(entrada, word)
        p = 0
        for i in d.keys(): p += 1 if re.match(pattern, i) else 0
        p /= len(d)
        finalScore += p * math.log(p, 2) if p > 0 else 0
    # print(f"{word}:{finalScore}")
    return finalScore


def paralelDict(item, d):
    return {i: scoreWord(i, d) for i in item}


def updateDict(d, pattern):
    d = {k: 0 for (k, v) in d.items() if re.match(pattern, k)}

    n = os.cpu_count()
    chunkSize = math.ceil(len(d) / n)
    out = {}
    with ProcessPoolExecutor(n) as executor:
        futures = [executor.submit(paralelDict, list(d.keys())[chunkSize * i:chunkSize * (i + 1)], d) for i in range(n)]
        for future in concurrent.futures.as_completed(futures):
            out.update(future.result())
        executor.shutdown()
    return out


def validarEntrada(entrada, word, globalPattern):
    procesed = {}
    for i in range(len(entrada)):
        letra = word[i]
        if letra not in procesed:
            if entrada[i] == 0:
                if (f"(?=.{{{i}}}{letra})" in globalPattern) or (f"(?=.*{letra})" in globalPattern and not max(
                        [entrada[j] == 2 and word[j] == letra for j in range(i + 1, len(entrada))] + [False])) or max([entrada[j] == 1 and word[j] == letra for j in range(i + 1, len(entrada))] + [False]):
                    print(f"Error en 0 letra {letra}")
                    return False
            elif entrada[i] == 1:
                if f"(?=.{{{i}}}{letra})" in globalPattern:
                    return False
            elif entrada[i] == 2:
                if f"(?!.{{{i}}}{letra})" in globalPattern or f"(?=[^{letra}]*$)" in globalPattern:
                    print(f"Error en 2 letra {letra}")
                    return False
            procesed[letra] = 0
    return True

if __name__ == '__main__':
  graph = GraphvizOutput()
  graph.output_file = "file3.png"

  with PyCallGraph(output=graph):
    intentos = 6
    d = json.loads(requests.get("https://media.githubusercontent.com/media/cardstdani/practica-java/main/Data/DictScoreData.txt").text)
    globalPattern = ""
    for intento in range(intentos):
        print(len(d), d, len(d))
        word = max(d, key=d.get)
        print(word, d[word])

        entrada = procesarEntrada()
        pattern = generatePattern(entrada, word)
        if validarEntrada(entrada, word, globalPattern):
            globalPattern += pattern[1:-3]
            try:
              d=json.loads(requests.get(f"https://media.githubusercontent.com/media/cardstdani/practica-java/main/Data/MaxTree/Dict{intento+1}-{''.join([str(a) for a in entrada])}.txt").text)
            except:
              d = updateDict(d, pattern)
        else:
            print("Error detectado, entrada inconsistente")
            intento -= 1
        if entrada == [2, 2, 2, 2, 2]:
            break
To complete this section, we will generate the dynamic call graph of a more complex code like the above one, which is the Wordle Solver algorithm previously mentioned.
If we run the code from our personal computer, we will get the next result:
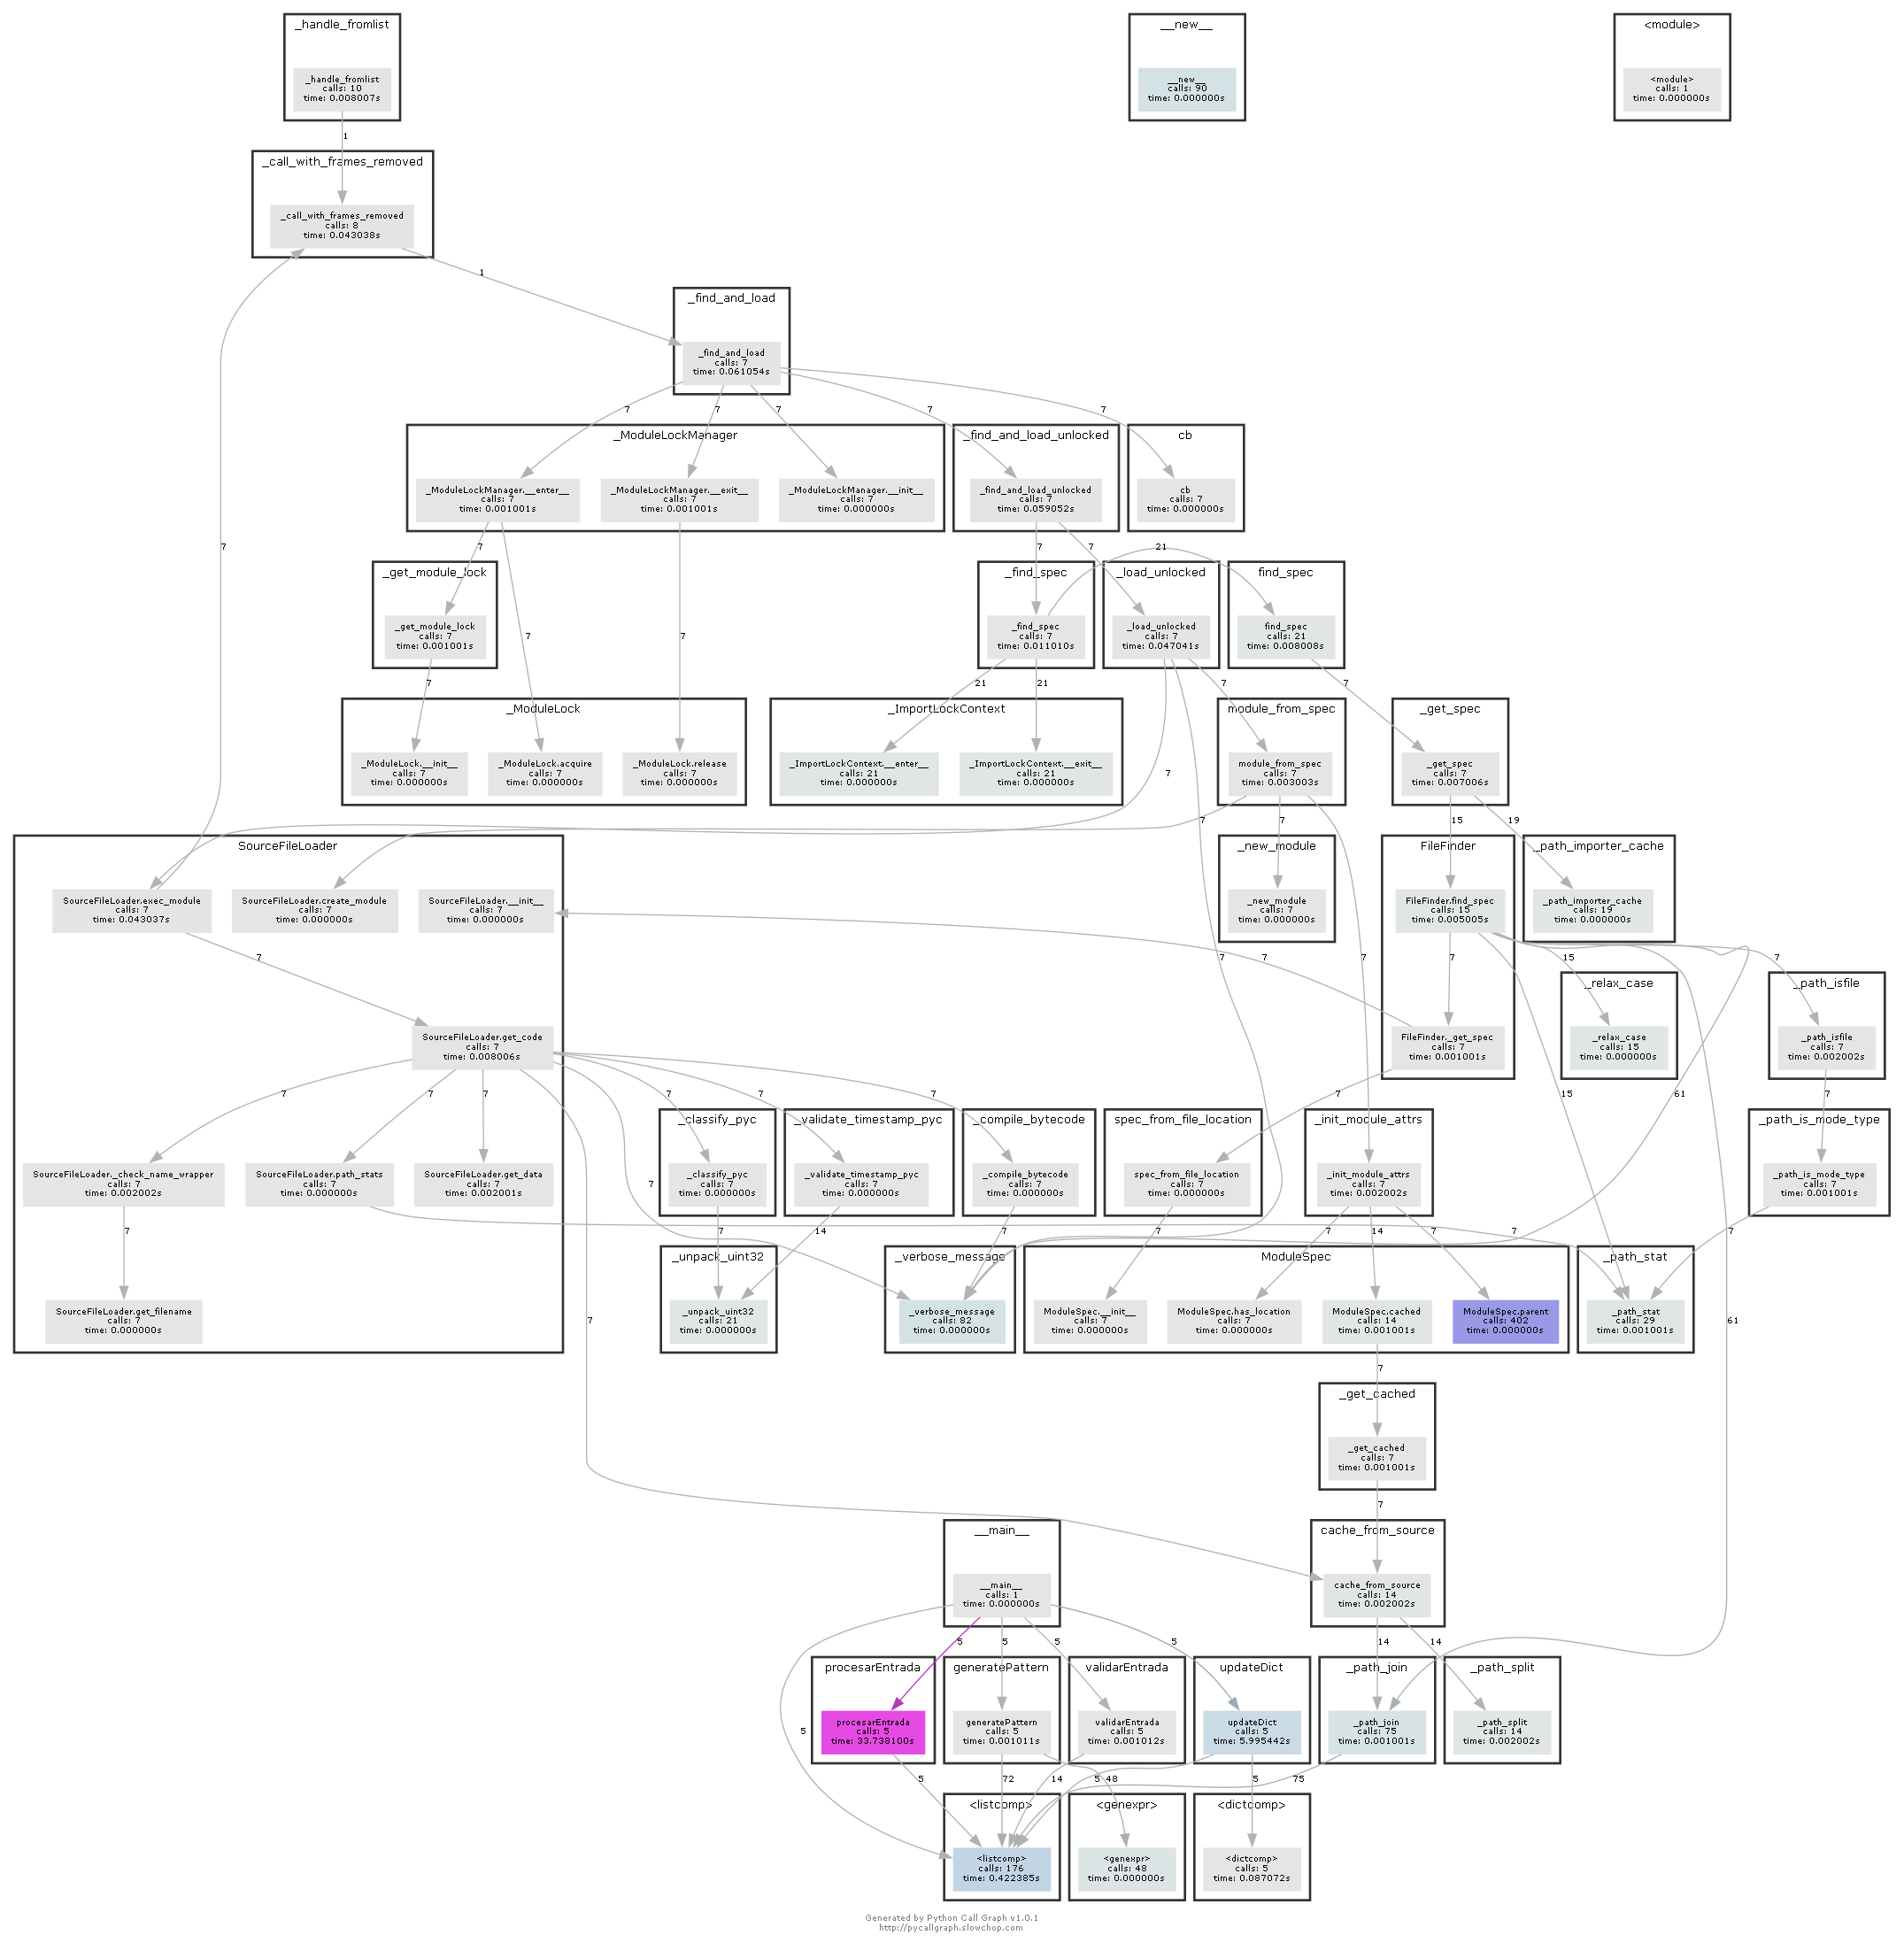 Image by author
You can observe how in each node, there are some data about the function's name, calls during the process lifetime and time "alive" during execution. Also, the calls number can be inferred by the indegree of each node, displayed in the middle of every directed edge.
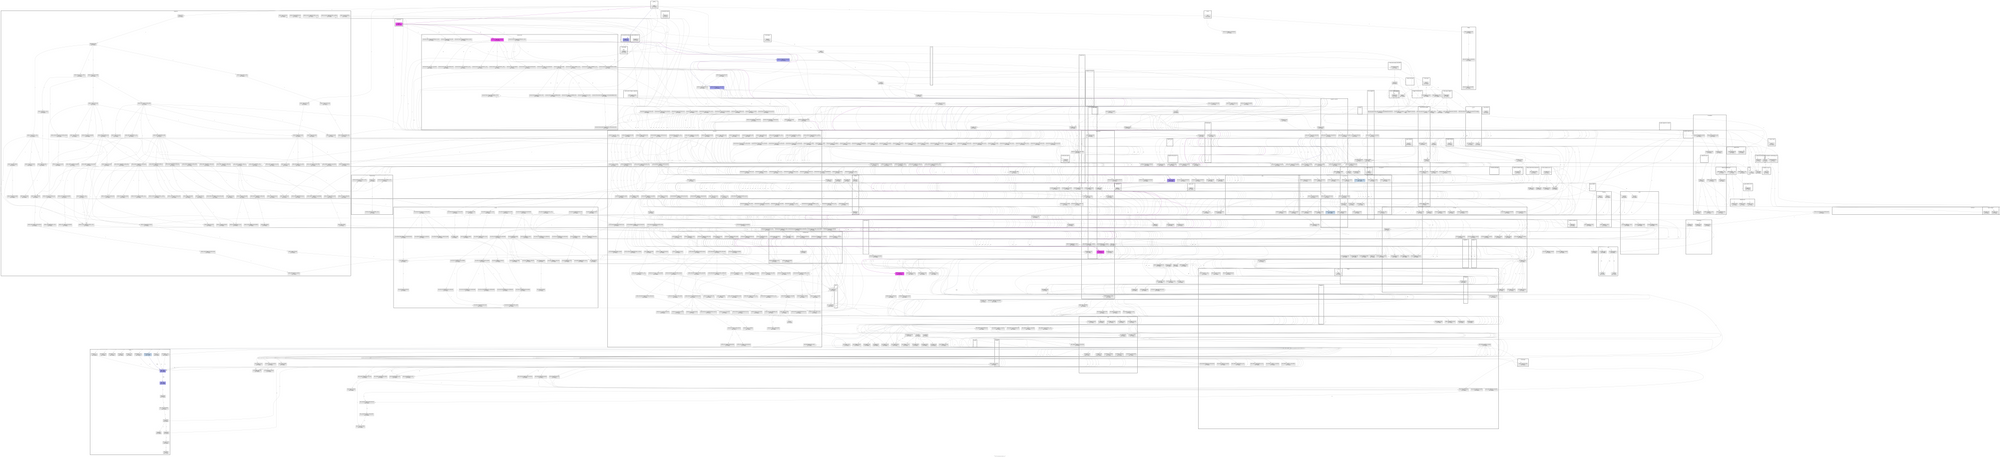 Image by author
However, if we run the code from Google Colab, we will encounter a much more complex call graph, the consequence of all sub-processes that must be performed to communicate with the remote machine offered by Google services, as well as the multiple server data retrievals and multiprocessing routines that requires the code itself.
Conclusion
With this guide you have learned how to automate the creation of call graphs, which on its own might not seem as valuable as it really is.
But they can become essential in situations where we must optimize algorithms large enough that reading their code proves to be inefficient compared to using a graphical representation.